

Abstract
BACKGROUND
Over the past 2 decades, clinical studies have provided evidence that cerebrospinal fluid (CSF) amyloid β1–42 (Aβ1–42), total τ(t-τ), and τ phosphorylated at Thr181 (p-τ181) are reliable biochemical markers of Alzheimer disease (AD) neuropathology.
CONTENT
In this review, we summarize the clinical performance and describe the major challenges for the analytical performance of the most widely used immunoassay platforms [based on ELISA or microbead-based multianalyte profiling (xMAP) technology] for the measurement of CSF AD biomarkers (Aβ1–42, t-τ, and p-τ181). With foundational immunoassay data providing the diagnostic and prognostic values of CSF AD biomarkers, the newly revised criteria for the diagnosis of AD include CSF AD biomarkers for use in research settings. In addition, it has been suggested that the selection of AD patients at the predementia stage by use of CSF AD biomarkers can improve the statistical power of clinical trial design. Owing to the lack of a replenishable and commutable human CSF-based standardized reference material (SRM) and significant differences across different immunoassay platforms, the diagnostic–prognostic cutpoints of CSF AD biomarker concentrations are not universal at this time. These challenges can be effectively met in the future, however, through collaborative ongoing standardization efforts to minimize the sources of analytical variability and to develop reference methods and SRMs.
SUMMARY
Measurements of CSF Aβ1–42, t-τ, and p-τ181 with analytically qualified immunoassays reliably reflect the neuropathologic hallmarks of AD in patients at the early predementia stage of the disease and even in presymptomatic patients. Thus these CSF biomarker tests are useful for early diagnosis of AD, prediction of disease progression, and efficient design of drug intervention clinical trials.
Alzheimer disease (AD)4 is a complex progressive neurodegenerative disease that leads to loss of memory and cognitive function and is pathologically characterized by amyloid plaques and neurofibrillary tangles (NFT) that are formed largely by fibrillar forms of β-amyloid (Aβ) and hyperphosphorylated τ(p-τ), respectively. During the past 2 decades, cumulative molecular and clinical studies have provided the basis for our understanding of the molecular characteristics and progressive pathologic features of these hallmarks. Because cerebrospinal fluid (CSF), owing to its direct contact with the extracellular space of the brain, is the most useful biological fluid reflecting molecular events in the brain (1), intense research efforts have been made to develop biochemical biomarkers in CSF. On the basis of the prevailing scientific evidence, CSF biomarkers have been incorporated into the revised diagnostic criteria of AD for research purposes as supportive evidence for AD pathophysiology (2), although not yet for routine diagnostic use in clinical practice. The multimodal biomarkers (e.g., genetic, CSF, and imaging biomarkers) for the detection of AD and/or for the prediction of disease progression are closely related to each other but their clinical utility varies across the different disease stages. An important current research focus is determining the best combination of genetic, biochemical, and imaging biomarkers as well as measures of cognitive function that provide for improved diagnostic accuracy at different stages of the disease.
In this review, we describe the characteristics and analytical performance of the widely used immunoassay platforms for measurement of core proteins associated with AD pathogenesis (Aβ1–42 and τ proteins). We discuss the probable sources of analytical variability and current global efforts to overcome the challenges of advancing the use of these immunoassays in clinical practice. In addition, we briefly review the association of CSF biomarkers with imaging biomarkers and genetic factors. Finally, we summarize the clinical utility of immunoassay-based Aβ and τ protein measurements in CSF for early and differential diagnosis and for predicting AD disease progression.
Core Proteins Associated with the Pathogenesis as Biomarkers for AD
The amyloid cascade hypothesis proposes that accumulation of Aβ, cleaved from amyloid precursor protein (APP) by amyloidogenic enzyme activity, and formation of fibrillar plaques is a primary pathological event leading to NFT formation, loss of synapses and neurons, and dementia (3). Although this hypothesis has been the basis for AD drug discovery over the past decade, the failure of all clinical trials to date that target Aβ has challenged this hypothesis and stimulated efforts to search for other therapeutic targets such as τ-mediated neurodegeneration (4). This notwithstanding, Aβ continues to be a major focus for AD drug discovery, and among the various Aβ species derived from APP, Aβ1–42 is more amyloidogenic and toxic than the more biologically abundant Aβ1–40 form. Once Aβ1–42 is generated from APP by amyloidogenic β-secretase (also known as β-site APP cleaving enzyme) and γ-secretase, Aβ1–42 is prone to aggregation into various toxic oligomer species followed by insoluble fibril formation, and eventually, amyloid plaques by mechanisms not fully elucidated (Fig. 1A). When self-aggregation of Aβ1–42 occurs, the hydrophobic C-terminus of the peptide (the epitope for the Aβ1–42-specific antibody) is likely to be buried within the aggregation core (5). Furthermore, the monomeric and polymeric molecular profiles of Aβ1–42 in the CSF of AD patients and healthy controls are unknown and challenging to measure. In addition, aggregates of Aβ1–42 with other CSF proteins occur and are likely to be another source of the heterogeneity of Aβ1–42 in CSF. The accumulation of Aβ plaques in the brain can be assessed by the semiquantitative use of molecular amyloid positron emission tomography (PET) ligands, such as 11C-labeled Pittsburgh compound B (PiB) (6) and the recently developed ligand, florbetapir F18 (AV-45) (7). PiB binding negatively correlates with CSF Aβ1–42 concentration (8, 9), a finding that is consistent with the hypothesis that accumulation of Aβ1–42-rich plaque in the brain is a likely cause of decreased CSF Aβ1–42 concentrations. Amyloid plaque burden measured by either CSF Aβ1–42 or PiB binding reaches a maximum early in the course of the disease, and abnormal Aβ accumulation is frequently found in a proportion of nondemented elderly controls without cognitive impairment (8, 10, 11). The lowered concentration of CSF Aβ1–42 and amyloid-PET findings are indicators of amyloid plaque accumulation in the brain in these individuals, and additional longitudinal studies are needed to clarify the pathogenic role of amyloid burden in the brain of healthy individuals without cognitive impairment.
Fig. 1. Pathogenic process of core proteins (Aβ and τ proteins) associated with the pathogenesis of AD.
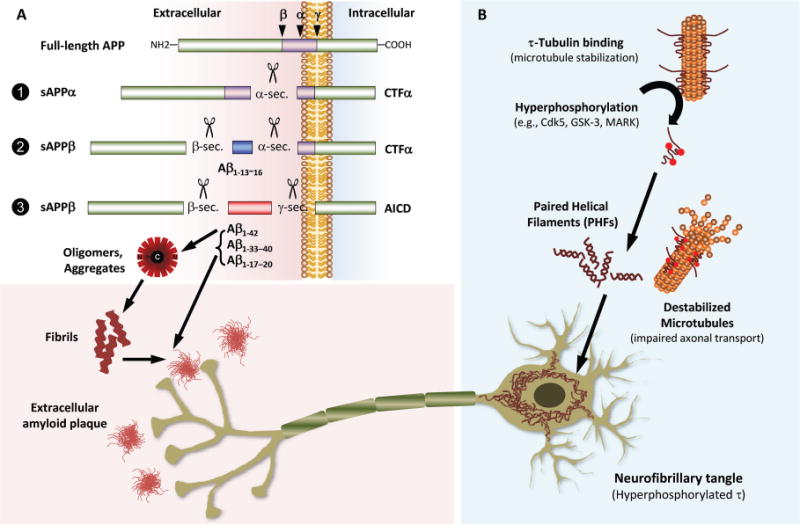
(A), Full-length APP, a transmembranous protein, can be cleaved by α-,β-, or γ-secretases (sec.) (indicated by small arrows in the left upper panel), which recognize specific sites of Aβ peptide, into nonamyloidogenic or amyloidogenic Aβ peptide fragments, soluble APPs, and intracellular peptide fragments (α- and β-sec.–generated carboxy-terminal fragments or α- and β-CTFs and the γ-secretase–generated APP intracellular domain). β-sec. cleaves at position 1 in the Aβ sequence, whereas α-sec. and γ-sec. have multiple probable cleavage sites around amino acids at position 13–16 or 17–20 and 33–42 of Aβ, respectively. α-sec. cleaves full-length APP (pathway 1) to generate soluble APPα and CTFα. APP is cleaved by β-sec. followed by α-sec. to generate nonamyloidogenic small fragments of Aβ sized from 13 to 16 (Aβ1–13–Aβ1–16), the soluble form of APPβ (sAPPβ), and CTFα (pathway 2). If full-length APP is cleaved by β-sec. and γ-sec. [an enzyme complex consisting of presenilin, nicastrin, PEN2 (presenilin enhancer 2), and APH1 (anterior pharynx defective 1)], amyloidogenic Aβ1–42 and other types of carboxy-terminal truncated Aβ fragments (Aβ1–17, 1–18, 1–19, 1–20, Aβ1–33, 1–34, 1–37, 1–38, 1–39, 1–40), sAPPβ, and APP intracellular domain are generated (pathway 3). The sticky Aβ1–42 is prone to aggregate into various types of toxic oligomer with a buried carboxy-terminus and is a pathologic substrate of amyloid plaque formation with other truncated Aβ peptides, including Aβ1–40. (B), When τ proteins, which normally bind to and stabilize microtubules, are hyperphosphorylated by several serine/threonine kinases [e.g., Cdk5 (cyclin-dependent kinase 5), GSK3 (glycogen synthase kinase 3), and MARK (microtubule-affinity-regulating kinase)], the hyperphosphorylated τ proteins no longer bind microtubules and self-aggregate to form PHFs. Depletion of τ from microtubules results in their instability, thereby leading to impaired axonal transport and synaptic dysfunction. The progressive accumulation of PHFs leads to their aggregation into intracellular NFTs and neuropil threads.
AD is primarily a disease of the limbic cortex, including the hippocampus as well as the neocortex, and τ protein is highly expressed in the cortical axons therein, where its primary function seems to be the regulation of microtubule stability. This function is regulated by several different posttranslational modification steps, primarily phosphorylation by serine/threonine kinases. Following the aberrant hyperphosphorylation of τ by kinases, the p-τ dissociates from microtubules, leading to the formation of paired helical filaments (PHFs) that aggregate into NFTs and neuropil threads (4, 12). Although the exact relationship between Aβ and τ pathologies remains unclear, both form amyloid deposits, and the amyloid cascade hypothesis posits that the formation of τ pathologies is downstream in the sequence of pathogenic events. However, this proposal is difficult to reconcile with the results of the studies of Braak and colleagues, suggesting that τ pathologies appear long before Aβ deposits are seen (13). p-τ detached from microtubules results in the loss of τ function, microtubule structure, and axonal integrity and further aggregates into NFTs (4) (Fig. 1B). In this context, the increase of CSF total τ (t-τ) and p-τ concentrations reflects cortical axonal degeneration and NFT pathology, respectively. Although increased t-τ concentrations in CSF are observed in disorders with cortical damage or degeneration, in particular Creuzfeldt-Jacob disease, dementia with Lewy bodies (DLB), frontotemporal lobar degeneration (FTLD), vascular dementia (VaD), stroke, and brain trauma, the increase in concentration of CSF p-τ (e.g., p-τ231 or p-τ181) has been reported to be a more specific signature of AD than non-AD type dementia (14, 15). Because the complementary features of increased CSF τ proteins reflecting cortical neurodegeneration, fluorodeoxyglucose (FDG)-PET abnormality, and structural MRI findings are well correlated with synaptic damage and cognitive impairments in AD (16, 17), CSF τ protein concentrations and FDG-PET or structural MRI findings are indicators of neuronal dysfunction and neurodegeneration in the brain.
Mixed Pathology of AD
In the brain of the AD patient, the pathogenic events of Aβ1–42 deposition, NFT formation, and neuronal damage are likely to be mirrored by decreased Aβ1–42 and increases of p-τ181 and t-τ concentrations in CSF, respectively. Thus, the decrease of Aβ1–42 and increase of t-τ and p-τ181 in CSF are the characteristic features of the CSF AD signature. However, because of a significant proportion of dementia patients having mixed pathology along with overlap in signs and symptoms (18, 19), it is challenging to differentiate AD patients, particularly at early stages of the disease, from other diverse forms of non-AD type dementia, including FTLD, DLB, VaD, and dementia with Parkinson disease. Although the pathologic substrates of the non-AD type dementia, including vascular pathology, TAR DNA-binding protein 43, and Lewy body pathology, are well defined, these pathologies are frequently coincident in patients with AD and vice versa (18–22). It is not uncommon for disagreement between the pathologic and clinical diagnoses to occur in cases with heterogeneous pathology, which will lead to underestimation of the accuracy of biochemical biomarkers to differentiate patients with AD or mixed pathology from healthy controls (22). In comparison with clinical diagnosis alone, AD CSF biomarkers clearly add certainty to establish the diagnosis, particularly in clinically ambiguous cases, as has been supported by autopsy-confirmed studies (22–24). Furthermore, the combination of AD CSF biomarkers with structural or molecular imaging biomarkers may contribute to even further improvement of diagnostic accuracy and/or predictability of disease progression compared to clinical measures (25–27). However, the usefulness of CSF biomarkers, including Aβ1–42 and τ proteins as well as imaging biomarkers, for differentiation of patients with mixed pathology should be further evaluated in patients with autopsy-confirmed diagnosis (22). In addition, the development of biomarker tests such as α-synuclein, a marker for Lewy bodies, is another strategy for further improving on the diagnostic accuracy in mixed pathologies (21).
Immunoassays of AD CSF Biomarkers
With the development of monoclonal antibodies (mAbs) specific for Aβ1–42 (28) and antibodies used to detect total τ (all isoforms independent of phosphorylation) or specific for phosphorylated (29, 30), the earliest reports have described studies in which ELISA was used to demonstrate lower concentrations of Aβ1–42 and higher concentrations of total τ and phosphorylated τ in the CSF of AD patients compared to CSF of healthy elderly patients (29–31). Multiplexed quantification of biologic materials performed with a prototype microsphere-based flow cytometric immunoassay was described by Gordon and McDade in 1997 (32). In 2005, the microsphere-based Luminex-xMAP® technology (xMAP) with a flow cytometric method allowing simultaneous measurement of Aβ1–42, t-τ, and p-τ181 was developed (33). More recently, the concentrations of Aβ1–38, Aβ1–40, Aβ1–42, and soluble APPs in CSF measured by an electrochemiluminescence (ECL) detection method [Meso Scale Discovery® (MSD)] were reported as biomarkers of AD (34–36).
ANALYTICAL PLATFORMS
The singleplex ELISA kit (Innotest kit for Aβ1–42, t-τ, and p-τ181 from Fujirebio-Innogenetics) and multiplex kit for xMAP (INNO-BIA AlzBio3 kit from Fujirebio-Innogenetics) are the most widely used immunoassay platforms for measurement of CSF AD biomarkers. The ECL method of MSD technology is currently emerging as a singleplex or multiplex immunoassay platform. The epitope regions of antigens (Aβ1–42, t-τ, and p-τ181) for binding of specific capture or detector mAbs in the ELISA or xMAP system are illustrated in Fig. 2. In the MSD platform, single- or multiple-antibody coated carbon electrodes integrated in 96-well plates provide the solid phase of the sandwich immunoassays. Following binding of the antigen with precoated primary antibody, a ruthenium-conjugated secondary antibody emitting light upon electrochemical stimulation provides the means for quantification. The signal is then amplified by microscopy and the images are captured and analyzed by MSD-specific software. However, compared to the ELISA and xMAP platforms, data obtained with the MSD platform for AD CSF biomarkers are sparse at this time. The characteristics of each analytical platform are summarized in Table 1.
Fig. 2. Amino acid sequences of epitopes for capture and detector mAbs used in Aβ1–42, t-τ, or p-τ181 measurement by ELISA and xMAP immunoassay platforms.
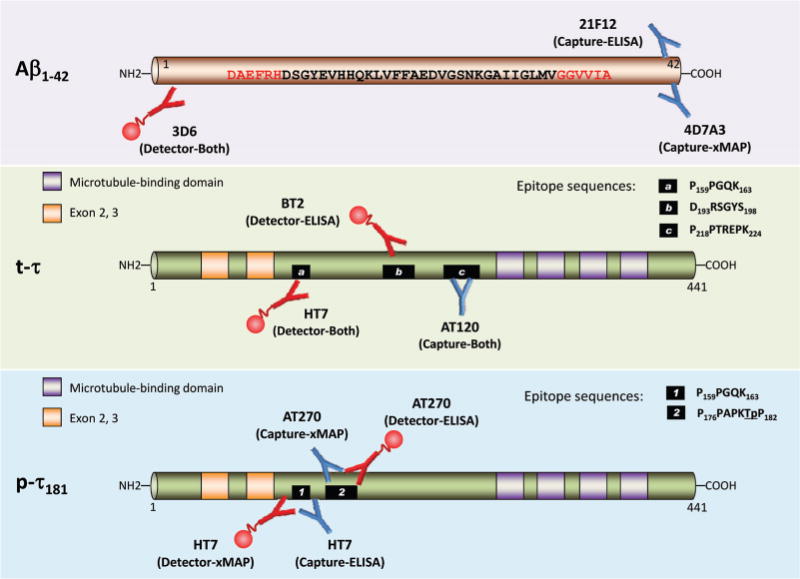
Blue-colored antibody and small globe-tailed red-colored antibody indicate capture antibody and biotinylated detector antibody, respectively. Upper panel: a primary capturing 21F12 mAb in the Innotest kit-ELISA system or a 4D7A3 mAb in the INNO-BIA AlzBio3 kit-xMAP system binds specifically to the C-terminus of Aβx–42 peptides. The biotinylated 3D6 mAb is used in both immunoassay systems as a detector antibody binding to the N-terminus of Aβ1–42. The combination of 21F12–3D6 and 4D7A3–3D6 mAbs specifically quantifies the Aβ1–42 in both platforms without cross-reactivity with Aβ1–40 or truncated Aβ peptides. Red-colored sequences are epitopes for capture and detector antibodies. Middle panel: for CSF t-τ quantification, the AT120 capture mAb binding to the proline-rich domain in the center of all isoforms of human τ (3R/0N, 3R/1N, 4R/0N, 4R/1N, 3R/2N, and 4R/2N; the isoform illustrated in this Fig. is 4R/2N) independent of their phosphorylation is used both in the Innotest-ELISA and the INNO-BIA AlzBio3 kit. Following the binding of biotinylated detection mAbs (HT7 and BT2 for ELISA, HT7 for xMAP), the antigen–antibody complex is detected by a peroxidase-labeled streptavidin (ELISA) or a streptavidin-phycoerythrin fluorochrome (xMAP). The epitope sequence for each mAb is presented as a small black box. Lower panel: to detect p-τ181, the HT7, which binds to all isoforms, is used as a capture (ELISA) or a detector mAb (xMAP), and the AT270, which is specific to τ phosphorylated at the Thr181 position (underlined), is used as a detector (ELISA) or a capture mAb (xMAP). The epitope sequence for each mAb is presented as a numbered small black box.
Table 1.
Characteristics of immunoassay platforms for measurement of CSF AD biomarkers.
| ELISA | xMAP | MSD | |
|---|---|---|---|
| Solid phase | Immunoplate | Microspheres | Immunoplate with carbon electrodes |
| Coating process of precoated antibody | Passive adsorption | Covalent chemical coupling | Passive adsorption |
| Calibrators | Freshly prepared from provided lyophilized peptide | Ready-to-use calibrators in aqueous solution | Freshly dilute provided stock peptide solution |
| Detection | SVa-peroxidase | SV-PE | ECL |
| Range of calibrators (pg/mL) | Ab1–42: 125–2000 | Ab1–42: 60–2000 | Ab1–42: 0.19–3170 |
| t-τ: 75–1200 | t-τ: 25–1500 | t-τ: 4.39–9600 | |
| p-τ181: 15.6–500 | p-τ181: 10–250 | ||
| Total sample volume required for 3 analytes | 250 μL for duplicates | 150 μL for duplicates | 50 μL for duplicatesb |
SV, streptavidin; PE, phycoerythrin.
For 1-analyte (Aβ1–42 or t-τ) measurement.
ANALYTICAL PERFORMANCE OF ELISA AND xMAP PLATFORMS
To establish the clinical utility of the biologic markers, the precision and accuracy of analytical methods are fundamental prerequisites. In addition, a selected analytical platform needs to be highly sensitive to measure a broad range of analyte concentrations in clinical samples and highly specific to detect the analyte of interest without a sample extraction step. The range of calibrators for Aβ1–42, t-τ, and p-τ181 of the Innotest-ELISA system and the AlzBio3-Luminex platform include the concentration ranges observed in the CSF of healthy elderly individuals or AD patients, and the ranges of the AlzBio3-Luminex platform are wider than those of the Innotest-ELISA system (37). The lowest detectable concentration of the MSD platform for Aβ1–42 and t-τ is lower than that of ELISA or xMAP, and the range of calibrator concentrations for the MSD is wider than for ELISA or xMAP. It should be noted that these lower limits of quantitation are determined using aqueous standard calibrators, not CSF-based calibrators, because CSF pools or substitute surrogate CSF matrix materials are not available for these immunoassays at present.
The 21F12/3D6 mAb combination in the Innotest-ELISA system is highly specific for Aβ1–42, with no detectable cross-reactivity with other Aβ species (38). For t-τ measurement by the Innotest-ELISA, total proteins are reacted with the combination of 1 capturing mAb (AT120) and 2 detecting mAbs (HT7 and BT2). These mAbs do not cross-react with Aβ peptides. p-τ181 is captured by an AT270 mAb specific for the epitope that includes Thr181, and HT7 is used as the detector mAb. There is no cross-reactivity with non-phosphorylated τ or Aβ protein (39). For simultaneous measurement of Aβ1–42, t-τ, and p-τ181 using the Luminex-xMAP platform, no cross-reactivity as measured on microspheres coupled with capture mAb, 4D7A3 (Aβ1–42), AT120 (t-τ), or AT270 (p-τ181) with nontarget peptides was observed in aqueous or CSF samples (33), confirming the assay specificity of the Luminex-AlzBio3 platform.
On the basis of a review of reported studies, the repeatability (within-run or intraassay precision) and intermediate (interassay) precision performance of the ELISA and xMAP platforms for the measurement of CSF AD biomarkers supports their intended clinical uses (Table 2). Several studies measuring CSF AD biomarkers in aqueous or CSF samples using each or both platforms reported similar intraassay and interassay variability (%CV), and the precision profiles of both platforms are comparable (9, 33, 37, 40–43). The concentrations of Aβ1–42, t-τ, and p-τ181 measured by the xMAP platform in the same CSF samples are different from those measured by ELISA, although the concentrations are highly correlated (9, 40).
Table 2.
Precision performance of immunoassay for CSF AD biomarkers
| References | Imprecision or interlaboratory variability (mean %CV for Aβ1–42, t-τ, and p-τ181, respectively) |
|
|---|---|---|
| Innotest-ELISA | AlzBio3-xMAP | |
| Andreasen et al. (1999) (41) | Intraassay for Aβ1–42 < 5% | |
| Interassay for Aβ1–42 < 10% | ||
| Olsson et al. (2005) (33) | Intraassay (aqueous) | Intraassay (aqueous) |
| 3.0, 4.6, 2.0 | 2.0, 3.2, 1.8 | |
| Intraassay (CSFs) | ||
| 3.8, 3.6, 2.7 | ||
| Lewczuk et al. (2006) (42) | Intraassay (CSFs) | |
| 7.5, 5.3, 3.3 | ||
| Interlaboratory (CSFs) | ||
| 29, 26, 27 | ||
| Reijn et al. (2007) (40) | Interassay | Interassay |
| 6.4, 8.3, 3.8 | 5.3, 8.4, 5.4 | |
| Vanderstichele et al. (2008) (37) | Intraassay (CSF) | Intraassay (CSF) |
| 3.5, 4.3, 2.3 | 2.6, 3.1, 2.1 | |
| Lewczuk et al. (2008) (78) | — | Intraassay (aqueous) |
| 12.1, 8.1, 3.6 | ||
| Interassay (aqueous) | ||
| 12.9, 9.6, 9.6 | ||
| Verwey et al. (2009) (44) | Interassay (CSFs) | Interlaboratory (CSFs) |
| 25, 18, 7 | 20, 14, 22 | |
| Interlaboratory (CSFs) | ||
| 26, 18.5, 14 | ||
| Shaw et al. (2009) (57) | Interassay (CSFs) <10% | |
| Interassay (aqueous) <7% | ||
| Fagan et al. (2011) (9) | Intraassay (CSFs, Mean) | Intraassay (CSFs, Mean) |
| 4.2, 4.5, 1.7 | 3.7, 3.6, 3.9 | |
| Intraassay (CSFs, Median) | Intraassay (CSFs, Median) | |
| 3.7, 2.5, 1.2 | 3.0, 2.7, 3.6 | |
| Mattsson et al. (2011) (45) | Within-center (CSFs) | Within-center (CSFs) |
| 10.9, 11.1, 8.9 | 10.0, 6.9, 13.5 | |
| Interassay (CSFs) | Interassay (CSFs) | |
| 14, 10, 11 | 14, 9, 11 | |
| Shaw et al. (2011) (43) | Within-center (aqueous)a | |
| 8.4, 5.0, 3.4 | ||
| Within-center (CSFs)a | ||
| 5.3, 6.7, 10.8 | ||
| Interlaboratory (CSFs) | ||
| 17.9, 13.1, 14.6 | ||
Overall mean values of interassay (within center) precision from 7 centers.
However, the interlaboratory variability (reproducibility) in concentrations of AD CSF biomarkers can be substantial. Using the Innotest-ELISA method, Lewczuk et al. reported higher interlaboratory variability (%CV values of 29%, 26%, and 27% for Aβ1–42, t-τ, and p-τ181, respectively) than intralaboratory variability (7.5%, 5.3%, and 3.3%CV, respectively) in CSF samples (42). Another multicenter comparison study measuring AD biomarkers in CSF pools reported large interlaboratory variability in both Innotest-ELISA (%CV values of 26%, 18.5%, and 14% for Aβ1–42, t-τ, and p-τ181, respectively) and the AlzBio3-Luminex platform (%CV values of 20%, 14%, and 22%, for Aβ1–42, t-τ, and p-τ181, respectively) (44). Recently the results of the first 2 rounds of the Alzheimer’s Association external QC program for CSF biomarkers program were published (45). Interlaboratory variability, particularly for Aβ1–42, is the first-ranking contributor to the total variability of the Innotest-ELISA and AlzBio3-Luminex platforms. A study of the qualification of the analytical performance of the AlzBio3-Luminex system in 7 centers revealed that interlaboratory variability was higher (SD %CV values of 17.9%,13.1%, and 14.6% for Aβ1–42, t-τ, and p-τ 181, respectively) than intralaboratory variability (5.3%, 6.7%, and 10.8%, respectively) in CSF pools and test/retest performance (5.7%, 5.6%, and 11.5%, respectively) during a total of 38 analytical runs of CSF aliquots (43).
The variability in the concentrations of AD CSF biomarkers across studies may be due to a combination of preanalytical and analytical factors as well as differences in research participant selection (e.g., differences in age of selected patients and control individuals) and clinical factors (e.g., diagnostic algorithms). Recently, the Alzheimer’s Biomarkers Standardization Initiative (ABSI) members published an informative review paper that described the consensus reached on the issues of preanalytical sources of variability (46). In addition to preanalytical sources of variability, several aspects related to analytical procedures, interpretation of results, and reagent lot-to-lot variability can also contribute to the observed intra- and/or interlaboratory variability (45, 47). Essential to the process of addressing the sources of analytical variability, a detailed checklist and protocol for analytical procedures should be applied to independent experiments using the same batches of CSFs and kits of the same lot number. Because any given experimental step that might be overlooked by analysts can be a significant factor (e.g., repeated back and forth pipetting of reagents or samples), interlaboratory comparison studies under a detailed experimental protocol and with detailed documentation of procedural steps are essential to determine sources of variability. In addition, experience with the procedure is essential to decrease variability. We are currently collaborating in an interlaboratory comparison study across 3 experienced laboratories, including the use of a well-vetted and detailed experimental protocol and 10 CSF pools, using the AlzBio3-Luminex platform with the same kit lot number. This study will hopefully provide further information on analytical sources of variability for the AlzBio3-Luminex platform.
STANDARDIZED REFERENCE MATERIALS AND METHODS
As for other areas of laboratory testing such as blood glucose, cholesterol, or hormone tests, consistent and uniform cutpoint values for AD CSF biomarkers and the associated diagnostic utilities are important to establish. The wide variability of AD CSF biomarker concentrations depending on the study is one of the main limitations for the use of these biomarkers for research purposes at the present time, and there is an urgent and critical need for collaborative efforts to address these issues to hasten the future use of these diagnostic aids in clinical practice. This challenge probably can be resolved by efforts to develop standardized reference materials (SRM) and reference methods, as we have learned from previous experience with serum proteins (48). In addition, a recent study has shown that use of CSF as the calibrator matrix removed the measurement bias between the ELISA and xMAP immunoassays (49), emphasizing the significance of this essential detail of these biomarker test methods.
Unfortunately, to date, SRM and reference methods for CSF Aβ1–42, t-τ, and p-τ181 measurement are not fully developed. The Reference Materials Working Group, a specialized working group in the Global Consortium for the Standardization of CSF Biomarkers (GCSB), supported by the Alzheimer’s Association (50), aims to develop an internationally available SRM for CSF AD biomarker test methods and establish reference methods with which Aβ and τ concentrations will be assigned to the SRM. In collaboration with the Reference Materials Working Group, the IFCC will certify the SRM, once the SRM and reference methods are developed. To this end, a metrology institute known as the Institute for Reference Materials and Measurements (IRMM) has formally decided to assist the GCSB in the development of certified SRMs (CRMs) for CSF Aβ1–42, t-τ, and p-τ181. Because the variability in major serum proteins was dramatically reduced by the development of an international CRM for major human serum proteins (48), the development of CRM and reference methods by multidisciplinary efforts, including the GCSB, IFCC, IRMM, and Alzheimer’s Association, will strongly facilitate comparison of laboratory results over time and between laboratories and finally reduce the bias component of variability in measurement of AD CSF biomarkers.
MASS SPECTROMETRIC QUANTITATION AS A REFERENCE METHOD
There are potential sources of bias in the concentrations of CSF AD biomarkers determined by immunoaffinity-based methods. The bias, at least in part, may be due to differences in sensitivity to matrix effects across analytes and antibodies. For example, because Aβ1–42 has a propensity for aggregation, nonspecifically binds to proteins, and has poor solubility, CSF matrix factor(s) may influence the fraction of Aβ1–42 that binds to the mAb used for immunoassay (51). To overcome the matrix effects, Lame et al. reported an LC-MS quantification of Aβ1–38, Aβ1–40, and Aβ1–42 by selected reaction monitoring under denaturing conditions (i.e., mixing samples with high-concentration guanidine hydrochloride) without extensive sample purification or preparation (52). Successful quantification required a matrix-interference–free calibration matrix, which was accomplished using a 4% rat plasma surrogate matrix (52) and included use of N15-labeled Aβ peptides as internal standards. Using a 96-well plate–based high-throughput mixed-bed ion exchange solid-phase extraction (SPE) procedure for the denatured samples, the investigators obtained excellent analytical performance and analytical sensitivity (52). Major features of sample preparation and calibration of the selected reaction monitoring with a tandem mass spectrometry approach to Aβ peptide quantification include: (a) use of pooled human CSF (53) or a surrogate artificial CSF matrix material as described above the use of a mixture of bovine serum albumin in an artificial CSF electrolyte solution for the calibration standards, (b) disruption of aggregated forms of Aβ peptides in CSF by use of a high concentration of guanidine hydrochloride, and (c) use of mixed-bed ion exchange sample-cleaning steps in a 96-well plate format. The advantages of this method are: (i) a matrix-effects–resistant Aβ1–42 quantification, (ii) the ability to include additional isoforms of Aβ, (iii) discrimination of the modified forms of a target peptide, (iv) freedom from antibody-based sample purification, and (v) the potential for low interlaboratory variability.
Using a similar methodology, pooled human CSF as the matrix for calibrators, and N15-labeled Aβ peptides as standards, Pannee et al. showed diagnostic performance for the Aβ1–42/Aβ1–40 ratio and Aβ1–42 concentration that are comparable to those obtained with ELISA (53). An interlaboratory round robin study, sponsored by the Alzheimer’s Association and involving 4 laboratories with considerable experience in the development of SRM/tandem mass spectrometric methods is currently underway and will for the first time compare performance across methods, for which each is using a different calibration matrix but essentially the same sample preparation method (50). This effort, we believe, will be an important step forward for establishing methodology that is both quantitative and precise for the measurement of Aβ in CSF. There are no reports of mass spectrometric quantification of t-τ or p-τ proteins at this time. This situation is likely attributable to the fact that the concentration, on a molar basis, of t-τ species is much lower than that for Aβ1–42 and that there are multiple isoforms and truncated forms of τ proteins, necessitating additional sample preparation steps to assure adequate detectability. To overcome the challenge of the much lower concentrations of the τ proteins, the use of an antibody capture step together with the latest most sensitive SRM/tandem mass spectrometry platforms could provide the needed tools to accomplish the task.
Clinical Implications of AD biomarkers
Measurements of CSF Aβ1–42, t-τ, and p-τ181 are widely used for the early detection of AD neuropathology with high sensitivity and specificity. Aβ1–42, t-τ, p-τ181, and their ratio values (e.g., t-τ/Aβ1–42) in CSF can improve the accuracy of clinical diagnosis and/or prediction of disease progression (Fig. 3).
Fig. 3. Distribution of sensitivity and specificity reported in clinical studies for discrimination of AD from controls or other non-AD types of dementia and for predicting the progression of MCI to AD.
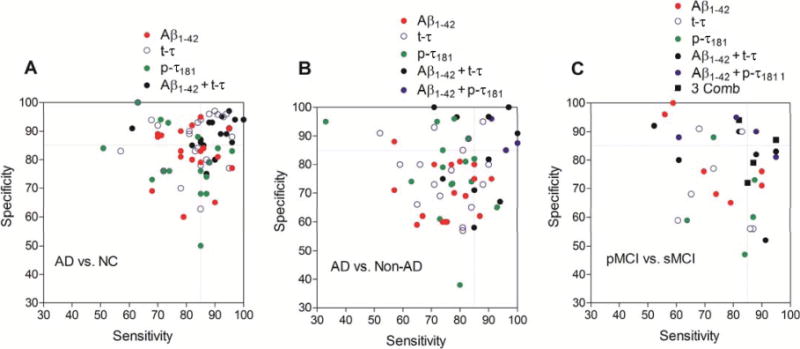
(A), Sensitivity and specificity for the diagnosis of AD. Controls include healthy elderly study participants free of dementia or controls with nonneurodegenerative disorders free of neurodegenerative disease. (B), Sensitivity and specificity for differential diagnosis of AD versus other non-AD type dementias, including FTLD, DLB, VaD, and/or PDD. (C), Sensitivity for patients with MCI whose disease progresses to AD (pMCI) and specificity for MCI patients with stable cognitive function (sMCI). Three Comb: Aβ1–42 + t-τ + p-τ181. Dotted lines indicate 85% of sensitivity and specificity. We identified studies through a systematic search in PubMed with search terms of “cerebrospinal fluid,” “biomarker,” “Alzheimer disease,” “sensitivity,” and “specificity” and from the references of retrieved studies (see the Supplemental References for these selected references in the Data Supplement that accompanies the online version of this report at http://www.clinchem.org/content/vol59/issue6). It should be noted that the disease severity of AD and the follow-up periods of MCI patients across the studies documenting sensitivity and specificity of CSF AD biomarkers are variable.
EARLY DIAGNOSIS AND DIFFERENTIAL DIAGNOSIS
Using the ELISA format with mAbs specific for Aβ1–42 and τ proteins, several groups reported the earliest studies that documented the clinical performance of CSF biomarkers for differentiation of AD patients from cognitively healthy controls (28–31). Following these earliest studies, a number of small-scale single-center studies and larger-scale multicenter studies reproduced the diagnostic performance of the individual CSF biomarkers and showed that the combination of CSF Aβ1–42 and protein concentration values is more useful for early detection of AD neuropathology than individual biomarker data (23, 54–59). For this review, we reexamined previous reports of studies demonstrating diagnostic or prognostic values of CSF AD biomarker(s). We excluded studies demonstrating sensitivity and specificity with a small number (n < 100) of study individuals (Fig. 3). The range of reported sensitivity and specificity for the individual CSF biomarkers for AD neuropathology detection is wide. The mean sensitivity for AD diagnosis is 81.6% for Aβ1–42 (n = 19 reports; 95% CI, 77.6–85.5), 82.5% for t-τ (n = 26 reports; 95% CI, 77.9–87.0) and 78.8% for p-τ181 (n = 16 reports; 95% CI, 72.5–85.1). The mean specificity is 82.9% for Aβ1–42 (95% CI, 78.1–87.8), 86.2% for t-τ (95% CI, 81.8–90.5), and 79.1% for p-τ181 (95% CI, 72.7–85.5). The combination of Aβ1–42 plus t-τ increases the sensitivity and specificity, with mean values of 88.7% (n = 16 reports; 95% CI, 84.0–93.5) and 88.7% (95% CI, 85.6–91.8), respectively (Fig. 3A). We cannot exclude the effects of different platforms, sample sizes, and patient population across studies on the clinical performance of CSF AD biomarkers. However, it is likely that the combination of CSF Aβ1–42 and t-τ improves the individual clinical performance of each for early detection of AD neuropathology. Particularly, in studies measuring CSF biomarkers in individuals with autopsy-confirmed diagnosis, the combination of Aβ1–42, t-τ, and/or p-τ181 showed clinically reliable (≥85%) sensitivity and specificity, test accuracy, and/or positive and negative predictive value for AD diagnosis (22, 23, 57, 59) and it has been shown that using clinical instead of neuropathological diagnosis underestimates the accuracy of the biomarkers. These autopsy-based studies also documented the close connection between CSF biomarkers and the neuropathology they reflect.
The decrease of Aβ1–42 and increase of t-τ in CSF is not a specific pathologic signature for AD, and other non-AD dementias may have a similar CSF signature. For example, the concentration of Aβ1–42 is lower and of t-τ is higher in CSF of DLB patients compared with healthy elderly controls, but to a lesser extent than in AD; however, most of the DLB patients have coincident AD pathology and this could explain in part the results (22). Compared with differentiation of AD patients from healthy elderly individuals, the sensitivity and specificity of individual CSF biomarkers for discrimination of clinically diagnosed AD from non-AD dementias are relatively low (22, 56). The mean sensitivities of individual biomarkers reported in previous studies to discriminate AD from other non-AD dementias are 75.4% for Aβ1–42 (n = 16 reports; 95% CI, 70.1–80.8), 75.4% for t-τ (n 18 reports; 95% CI, 70.1–80.7), and 75.2% for p-τ181 (n = 15 reports; 95% CI, 67.7–82.8). The mean specificities of individual biomarkers are 70.8% for Aβ1–42 (95% CI, 65.7–75.8), 77.6% for t-τ (95% CI, 72.0–83.3), and 77.4% for p-τ181 (95% CI, 68.9–85.8). However, when the concentrations of CSF Aβ1–42 and τ proteins were combined, particularly Aβ1–42 and p-τ181, the mean sensitivity (86.5% for Aβ1–42 + t-τ in 10 reports and 95.7% for Aβ1–42 p-τ181 in 3 reports) and specificity (83.7% for Aβ1–42 t-τ in 10 reports and 89.5% for Aβ1–42 p-τ181 in 3 reports) were much improved (Fig. 3B). The finding that CSF τ protein phosphorylated at a specific site (e.g., p-τ181 or p-τ231) is a relevant biomarker for the differentiation of AD neuropathology from non-AD dementias (14, 15, 60) has been substantiated by studies based on autopsy-confirmed diagnosis (22, 23, 61). Another important aspect of AD detection is the more recent appreciation of the occurrence of mixed neuropathology in a substantial percentage of patients with a clinical diagnosis of AD. Thus, an important emphasis in AD biomarker research is the investigation of more specific biomarkers to discriminate AD from specific non-AD–type dementias.
TRACKING DISEASE PROGRESSION
According to a recently proposed model for the pathological trajectory of AD, the abnormality of Aβ is the first detectable change, followed by τ pathology and neuronal injury, abnormality of brain structure, and memory dysfunction followed by decreased clinical function (17). Because the molecular pathologic features of CSF AD biomarkers precede clinical symptoms, it has been suggested that CSF AD biomarkers might be useful to predict disease progression (Fig. 3C). This idea is supported by several large-scale multicenter longitudinal studies suggesting that the combination of CSF Aβ1–42 with t-τ and/or p-τ181 concentration values can detect mild cognitive impairment (MCI) patients who progress to AD (progressive MCI) compared to stable MCI patients with a high predictive performance (36, 57, 59, 62–64). However, several other studies revealed only a modest level of predictive performance of CSF biomarkers, even when they were combined (58, 65–67). These latter results should be interpreted with caution, because the follow-up periods differed across these studies. Because approximately 12%–15% of individuals with MCI annually progress to AD (26, 68), it probably will take at least 7 years before most of the patients with progressive MCI have become demented. A recent study with follow-up of 9.2 years revealed that the combination of the Aβ1–42:p-τ181 ratio values and t-τ concentrations (using an unbiased cutpoint value as determined by mixed-model analysis) could predict the progression of MCI to AD with high sensitivity (82%), specificity (94%), positive and negative predictive values of 94% and 82%, respectively (62). Studies with a moderate follow-up period (3–5 years) have also revealed high sensitivity and specificity results from the combined use of CSF biomarkers (36, 43). These studies, therefore, strongly suggest that CSF biomarkers will reliably enable the enrollment of patients at an earlier stage of the disease process for clinical trials of candidate disease-modifying therapies.
USE IN CLINICAL TRIALS
At present, there are no available drugs that modify disease progression. Several new drug candidates with disease-modifying potential are now being evaluated in clinical trials (69). However, the recent disappointing results of several clinical trials involving patients at the mild to moderate stage of AD emphasize the need for biomarkers that detect AD pathology in the early MCI stage or even at the presymptomatic stage (70). In connection with this, the incorporation of CSF Aβ1–42, t-τ, and p-τ181 in the current revised criteria for AD diagnosis for research, particularly in the criteria defining MCI or preclinical stages of AD, may provide a tool that enables enrichment. Recent studies in patients with familial AD that demonstrated the decline of CSF Aβ1–42 and the increase of CSF τ proteins to begin 25 years and 15 years before expected symptomatic onset, respectively (71), support the previously observed association between CSF AD biomarkers and pathophysiological changes in the preclinical stage without cognitive impairment (8, 72), although a well defined relationship between preclinical biomarker evidence and rate of clinical progression in sporadic AD still has to be clarified. Because of the heterogenous endophenotypes of AD, patients can be further stratified for clinical trials using reliable biomarkers in combination with CSF Aβ1–42, t-τ, and p-τ181 to predict the disease progression. Apolipoprotein E (ApoE) ε4 genotype is an established genetic risk factor for AD and one of the genetic biomarkers that can be applied at the stage of patient stratification. For example, the phase II trial of rosiglitazone, a peroxisome proliferator-activated receptor agonist in patients with mild-to-moderate AD showed significant cognitive improvement in ApoE ε4 noncarriers but not in ε 4 carriers, although a subsequent phase III study failed to show efficacy with rosiglitazone monotherapy in ε 4 noncarriers (73). The strategy of patient stratification according to ApoE genotypes was also applied to a recent clinical trial of bapineuzumab, a humanized mAb selective for the N-terminus of Aβ (74). The enrichment and stratification strategy for recruitment of patients on the basis of biomarkers is likely to improve sample homogeneity and statistical power, and therefore it may allow for a substantial reduction in sample sizes and for cost-saving in clinical prevention trials or clinical trials of AD modifying therapy in MCI patients (75, 76). Furthermore, CSF biomarkers can be used as pharmacodynamic markers for candidates with disease-modifying potential. For example, the change of CSF Aβ concentrations in patients receiving a developing drug or placebo can be instructive in selecting dosage for development and can inform a go or no-go decision (77). This potential utility of CSF biomarkers will benefit from planned systematic collection of longitudinal biomarker measurements in upcoming treatment trials.
Conclusions
Substantial data for 2 immunoassay methods, based on the ELISA and xMAP platforms, for the measurement of CSF τ and Aβ AD biomarkers provide support for the use of these precision-based tests for reliable detection of AD neuropathology. Such data are of substantial foundational value for advancing these platforms toward their clinical utility. The measurement of CSF AD biomarkers in general and CSF τ and Aβ in particular has several clinical implications in the field of AD research. First, the precision-based relative quantification of CSF AD biomarkers can differentiate AD patients at an early predementia (MCI) stage from elderly individuals without cognitive impairment or those individuals with a non-AD dementia. Second, CSF AD biomarker measurements can be used to predict and monitor disease progression, although further long-term longitudinal studies with enough follow-up time are needed to confirm the predictive performance of these tests for AD detection in the elderly population without cognitive impairment as well as for monitoring AD progression. Third, CSF AD biomarker measurements can be used as readouts for target engagement for disease-modifying therapies and to monitor the therapeutic effect of such drug candidates and their pharmacodynamic profiles in human study participants. Finally, CSF AD biomarkers may be useful to identify patients at an early disease stage to enrich populations in the design of clinical trials with the prospect of increasing statistical power and reducing costs in drug-intervention trials. For the purpose of the qualification of CSF AD biomarkers for use in AD clinical trials, studies of the statistical qualification and modeling of existing data for CSF AD biomarkers are underway (Fig. 4). Further controlling analytical variability across laboratories is an important goal in this field, and several efforts including the Alzheimer’s Disease Neuroimaging Initiative, the Alzheimer’s Association-sponsored external QC program, and the collaborative development of SRM and mass spectrometry reference methods put emphasis on recognizing sources of analytical variability and minimizing them. Ultimately, research with a focus on the multimodal combination of clinical, genetic, imaging, and CSF biomarkers may provide a clinically applicable modality for AD diagnostics.
Fig. 4. Flow chart for qualification and standardization of CSF AD biomarker measurement and multidisciplinary efforts for future clinical applications.
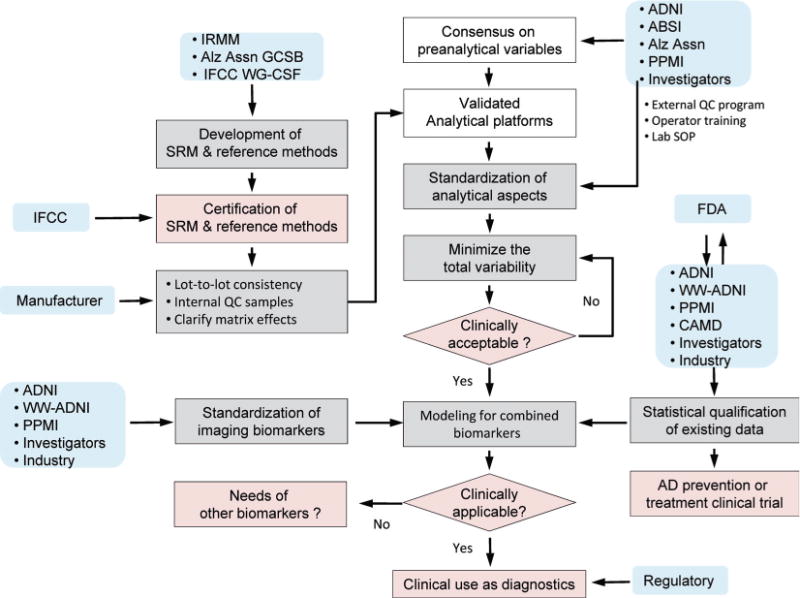
Boxes shaded white, gray, or pink indicate processes have been accomplished to a large degree, are underway and ongoing, or need to be accomplished, respectively. Blue boxes indicate principal entities or partners who have responsibility or have a major role in each indicated activity. Several approaches for the modeling of combined biomarkers are emerging, although additional studies supporting the clinical utility of combined biomarkers are required. The Coalition Against Major Diseases (CAMD) (www.c-path.org/camd.cfm) is making a major collaborative effort in support of the qualification by the US Food and Drug Administration (FDA) of CSF AD biomarkers for use as an enrichment tool in clinical trials. WW-ADNI, World-Wide Alzheimer’s Disease Neuroimaging Initiative (www.adni-info.org); Alz Assn, Alzheimer’s Association (www.Alz.org); PPMI, Parkinson’s Progression Markers Initiative (www.ppmi-info.org).
Supplementary Material
Footnotes
Nonstandard abbreviations: AD, Alzheimer’s disease; NFT, Neurofibrillary tangle; Aβ, β-amyloid peptide; p-τ, hyperphosphorylated τ; CSF, cerebrospinal fluid; APP, amyloid precursor protein; PET, positron emission tomography; PiB, Pittsburgh compound B; PHF, paired helical filament; t-τ, total τ; DLB, dementia with Lewy body; FTLD, frontotemporal lobar degeneration; VaD, vascular dementia; FDG, fluorodeoxyglucose; mAb, monoclonal antibody; ECL, electrochemiluminescence; MSD, Meso Scale Discovery; ABSI, Alzheimer’s Biomarkers Standardization Initiative; SRM, standardized reference material; GCSB, Global Consortium for the Standardization of CSF Biomarkers; IRMM, Institute for Reference Materials and Measurements; CRM, certified standardized reference material; SPE, solid-phase extraction; MCI, mild cognitive impairment; ApoE, apolipoprotein E.
Author Contributions: All authors confirmed they have contributed to the intellectual content of this paper and have met the following 3 requirements: (a) significant contributions to the conception and design, acquisition of data, or analysis and interpretation of data; (b) drafting or revising the article for intellectual content; and (c) final approval of the published article.
Authors’ Disclosures or Potential Conflicts of Interest: Upon manuscript submission, all authors completed the author disclosure form. Disclosures and/or potential conflicts of interest:
Employment or Leadership: None declared.
Consultant or Advisory Role: L.M. Shaw, Innogenetics-Fujirebio through participation in the Alzheimer’s Disease Neuroimaging Initiative.
Stock Ownership: None declared.
Honoraria: L.M. Shaw, Siemens and NIA/NIH Alzheimer’s Disease Neuroimaging Initiative grant U01 AG0249.
Expert Testimony: None declared.
Patents: None declared.
Research Funding: None declared.
References
- 1.Peskind ER, Riekse R, Quinn JF, Kaye J, Clark CM, Farlow MR, et al. Safety and acceptability of the research lumbar puncture. Alzheimer Dis Assoc Disord. 2005;19:220–5. doi: 10.1097/01.wad.0000194014.43575.fd. [DOI] [PubMed] [Google Scholar]
- 2.Dubois B, Feldman HH, Jacova C, DeKosky ST, Barberger-Gateau P, Cummings J, et al. Research criteria for the diagnosis of Alzheimer’s disease: revising the NINCDS-ADRDA criteria. Lancet Neurol. 2007;6:734–46. doi: 10.1016/S1474-4422(07)70178-3. [DOI] [PubMed] [Google Scholar]
- 3.Hardy J, Selkoe DJ. The amyloid hypothesis of Alzheimer’s disease: progress and problems on the road to therapeutics. Science. 2002;297:353–6. doi: 10.1126/science.1072994. [DOI] [PubMed] [Google Scholar]
- 4.Lee VM, Brunden KR, Hutton M, Trojanowski JQ. Developing therapeutic approaches to tau, selected kinases, and related neuronal protein targets. Cold Spring Harb Perspect Med. 2011;1:a006–437. doi: 10.1101/cshperspect.a006437. [DOI] [PMC free article] [PubMed] [Google Scholar]
- 5.Urbanc B, Cruz L, Yun S, Buldyrev SV, Bitan G, Teplow DB, Stanley HE. In silico study of amyloid beta-protein folding and oligomerization. Proc Natl Acad Sci USA. 2004;101:17345–50. doi: 10.1073/pnas.0408153101. [DOI] [PMC free article] [PubMed] [Google Scholar]
- 6.Klunk WE, Engler H, Nordberg A, Wang Y, Blomqvist G, Holt DP, et al. Imaging brain amyloid in Alzheimer’s disease with Pittsburgh Compound-B. Ann Neurol. 2004;55:306–19. doi: 10.1002/ana.20009. [DOI] [PubMed] [Google Scholar]
- 7.Clark CM, Schneider JA, Bedell BJ, Beach TG, Bilker WB, Mintun MA, et al. Use of florbetapir-PET for imaging -amyloid pathology. JAMA. 2011;305:275–83. doi: 10.1001/jama.2010.2008. [DOI] [PMC free article] [PubMed] [Google Scholar]
- 8.Fagan AM, Mintun MA, Mach RH, Lee SY, Dence CS, Shah AR, et al. Inverse relation between in vivo amyloid imaging load and cerebrospinal fluid Aβ42 in humans. Ann Neurol. 2006;59:512–9. doi: 10.1002/ana.20730. [DOI] [PubMed] [Google Scholar]
- 9.Fagan AM, Shaw LM, Xiong C, Vanderstichele H, Mintun MA, Trojanowski JQ, et al. Comparison of analytical platforms for cerebrospinal fluid measures of β-amyloid 1–42, total tau, and p-tau181 for identifying Alzheimer disease amyloid plaque pathology. Arch Neurol. 2011;68:1137–44. doi: 10.1001/archneurol.2011.105. [DOI] [PMC free article] [PubMed] [Google Scholar]
- 10.Pike KE, Savage G, Villemagne VL, Ng S, Moss SA, Maruff P, Mathis CA, et al. β-amyloid imag ing and memory in non-demented individuals: evidence for preclinical Alzheimer’s disease. Brain. 2007;130:2837–44. doi: 10.1093/brain/awm238. [DOI] [PubMed] [Google Scholar]
- 11.Mintun MA, Larossa GN, Sheline YI, Dence CS, Lee SY, Mach RH, et al. [11C]PIB in nondemented population: potential antecedent marker of Alzheimer disease. Neurology. 2006;67:446–52. doi: 10.1212/01.wnl.0000228230.26044.a4. [DOI] [PubMed] [Google Scholar]
- 12.Hanger DP, Anderton BH, Noble W. Tau phosphorylation: the therapeutic challenge for neurodegenerative disease. Trends Mol Med. 2009;15:112–9. doi: 10.1016/j.molmed.2009.01.003. [DOI] [PubMed] [Google Scholar]
- 13.Braak H, Thal DR, Ghebremedhin E, Tredici KD. Stages of the pathologic process in Alzheimer disease: age categories from 1 to 100 years. J Neuropathol Exp Neurol. 2011;70:906–9. doi: 10.1097/NEN.0b013e318232a379. [DOI] [PubMed] [Google Scholar]
- 14.Buerger K, Zinkowski R, Teipel SJ, Tapiola T, Arai H, Blennow K, et al. Differential diagnosis of Alzheimer disease with cerebrospinal fluid level of tau protein phosphorylated at threonine 231. Arch Neurol. 2002;59:1267–72. doi: 10.1001/archneur.59.8.1267. [DOI] [PubMed] [Google Scholar]
- 15.Hampel H, Buerger K, Zinkowski R, Teipel SJ, Goernitz A, Andreasen N, et al. Measurement of phosphorylated tau epitopes in the differential diagnosis of Alzheimer disease: a comparative cerebrospinal fluid study. Arch Gen Psychiatry. 2004;61:95–102. doi: 10.1001/archpsyc.61.1.95. [DOI] [PubMed] [Google Scholar]
- 16.Jack CR., Jr Alzheimer disease: new concepts on its neurobiology and the clinical role imaging will play. Radiology. 2012;263:344–61. doi: 10.1148/radiol.12110433. [DOI] [PMC free article] [PubMed] [Google Scholar]
- 17.Jack CR, Jr, Knopman DS, Jagust WJ, Shaw LM, Aisen PS, Weiner MW, et al. Hypothetical model of dynamic biomarkers of the Alzheimer’s pathological cascade. Lancet Neurol. 2010;9:119–28. doi: 10.1016/S1474-4422(09)70299-6. [DOI] [PMC free article] [PubMed] [Google Scholar]
- 18.Neuropathology Group, Medical Research Council Cognitive Function and Ageing Study (MRC CFAS) Pathological correlates of late-onset dementia in a multicentre, community-based population in England and Wales. Lancet. 2001;357:169–75. doi: 10.1016/s0140-6736(00)03589-3. [DOI] [PubMed] [Google Scholar]
- 19.Jicha GA, Abner EL, Schmitt FA, Kryscio RJ, Riley KP, Cooper GE, et al. Preclinical AD Workgroup staging: pathological correlates and potential challenges. Neurobiol Aging. 2012;33:622.e1–16. doi: 10.1016/j.neurobiolaging.2011.02.018. [DOI] [PMC free article] [PubMed] [Google Scholar]
- 20.Arai T, Mackenzie IR, Hasegawa M, Nonoka T, Niizato K, Tsuchiya K, et al. Phosphorylated TDP-43 in Alzheimer’s disease and dementia with Lewy bodies. Acta Neuropathol. 2009;117:125–36. doi: 10.1007/s00401-008-0480-1. [DOI] [PubMed] [Google Scholar]
- 21.Kotzbauer PT, Cairns NJ, Campbell MC, Willis AW, Racette BA, Tabbal SD, Perlmutter JS. Pathologic accumulation of -synuclein and Aβ in Parkinson disease patients with dementia. Arch Neurol. 2012;69:1326–31. doi: 10.1001/archneurol.2012.1608. [DOI] [PMC free article] [PubMed] [Google Scholar]
- 22.Toledo JB, Brettschneider J, Grossman M, Arnold SE, Hu WT, Xie SX, et al. CSF biomarkers cutoffs: the importance of coincident neuropathological diseases. Acta Neuropathol. 2012;124:23–35. doi: 10.1007/s00401-012-0983-7. [DOI] [PMC free article] [PubMed] [Google Scholar]
- 23.Engelborghs S, De Vreese K, Van de Casteele T, Vanderstichele H, Van Everbroeck B, Cras P, et al. Diagnostic performance of a CSF-biomarker panel in autopsy-confirmed dementia. Neurobiol Aging. 2008;29:1143–59. doi: 10.1016/j.neurobiolaging.2007.02.016. [DOI] [PubMed] [Google Scholar]
- 24.Le Bastard N, Martin JJ, Vanmechelen E, Vanderstichele H, De Deyn PP, Engelborghs S. Added diagnostic value of CSF biomarkers in differential dementia diagnosis. Neurobiol Aging. 2010;31:1867–76. doi: 10.1016/j.neurobiolaging.2008.10.017. [DOI] [PubMed] [Google Scholar]
- 25.Vemuri P, Wiste HJ, Weigand SD, Shaw LM, Trojanowski JQ, Weiner MW, et al. MRI and CSF biomarkers in normal, MCI, and AD subjects: diagnostic discrimination and cognitive correlations. Neurology. 2009;73:287–93. doi: 10.1212/WNL.0b013e3181af79e5. [DOI] [PMC free article] [PubMed] [Google Scholar]
- 26.Landau SM, Harvey D, Madison CM, Reiman EM, Foster NL, Aisen PS, et al. Comparing predictors of conversion and decline in mild cognitive impairment. Neurology. 2010;75:230–8. doi: 10.1212/WNL.0b013e3181e8e8b8. [DOI] [PMC free article] [PubMed] [Google Scholar]
- 27.Walhovd KB, Fjell AM, Brewer J, McEvoy LK, Fennema-Notestine C, Hagler DJ, Jr, et al. Combining MR imaging, positron-emission tomography, and CSF biomarkers in the diagnosis and prognosis of Alzheimer disease. Am J Neuroradiol. 2010;31:347–54. doi: 10.3174/ajnr.A1809. [DOI] [PMC free article] [PubMed] [Google Scholar]
- 28.Motter R, Vigo-Pelfrey C, Kholodenko D, Barbour R, Johnson-Wood K, Galasko D, et al. Reduction of β-amyloid peptide42 in the cerebrospinal fluid of patients with Alzheimer’s disease. Ann Neurol. 1995;38:643–8. doi: 10.1002/ana.410380413. [DOI] [PubMed] [Google Scholar]
- 29.Blennow K, Wallin A, Agren H, Spenger C, Siegfried J, Vanmechelen E. Tau protein in cerebrospinal fluid: a biochemical marker for axonal degeneration in Alzheimer disease? Mol Chem Neuropathol. 1995;26:231–45. doi: 10.1007/BF02815140. [DOI] [PubMed] [Google Scholar]
- 30.Vigo-Pelfrey C, Seubert P, Barbour R, Blomquist C, Lee M, Lee D, et al. Elevation of microtubule-associated protein tau in the cerebrospinal fluid of patients with Alzheimer’s disease. Neurology. 1995;45:788–93. doi: 10.1212/wnl.45.4.788. [DOI] [PubMed] [Google Scholar]
- 31.Arai H, Terajima M, Miura M, Higuchi S, Muramatsu T, Machida N, et al. Tau in cerebrospinal fluid: a potential diagnostic marker in Alzheimer’s disease. Ann Neurol. 1995;38:649–52. doi: 10.1002/ana.410380414. [DOI] [PubMed] [Google Scholar]
- 32.Gordon RF, McDade RL. Multiplexed quantitation of human IgG, IgA, and IgM with the FlowMatrix system. Clin Chem. 1997;43:1799–801. [PubMed] [Google Scholar]
- 33.Olsson A, Vanderstichele H, Andreasen N, De Meyer G, Wallin A, Holmberg B, et al. Simultaneous measurement of β-amyloid(1–42), total tau, and phosphorylated tau (Thr181) in cerebrospinal fluid by the xMAP technology. Clin Chem. 2005;51:336–45. doi: 10.1373/clinchem.2004.039347. [DOI] [PubMed] [Google Scholar]
- 34.Welge V, Fiege O, Lewczuk P, Mollenhauer B, Esselmann H, Klafki HW, et al. Combined CSF tau, p-tau181 and amyloid-β 38/40/42 for diagnosing Alzheimer’s disease. J Neural Transm. 2009;116:203–12. doi: 10.1007/s00702-008-0177-6. [DOI] [PubMed] [Google Scholar]
- 35.Lewczuk P, Kamrowski-Kruck H, Peters O, Heuser I, Jessen F, Popp J, et al. Soluble amyloid precursor proteins in the cerebrospinal fluid as novel potential biomarkers of Alzheimer’s disease: a multicenter study. Mol Psychiatry. 2010;15:138–45. doi: 10.1038/mp.2008.84. [DOI] [PubMed] [Google Scholar]
- 36.Hertze J, Minthon L, Zetterberg H, Vanmechelen E, Blennow K, Hansson O. Evaluation of CSF biomarkers as predictors of Alzheimer’s disease: a clinical follow-up study of 4.7 years. J Alzheimers Dis. 2010;21:1119–28. doi: 10.3233/jad-2010-100207. [DOI] [PubMed] [Google Scholar]
- 37.Vanderstichele H, De Meyer G, Shapiro F, Engelborghs S, De Deyn PP, Shaw LM, Trojanowski JQ. Alzheimer’s disease biomarkers: from concept to clinical utility. In: Galimberti D, Scarpini E, editors. Biomarkers for early diagnosis of Alzheimer’s disease. Hauppauge: Nova Science Publishers, Inc; 2008. pp. 81–122. [Google Scholar]
- 38.Vanderstichele H, Van Kerschaver E, Hesse C, Davidsson P, Buyse MA, Andreasen N, et al. Standardization of measurement of beta-amyloid(1–42) in cerebrospinal fluid and plasma. Amyloid. 2000;7:245–58. doi: 10.3109/13506120009146438. [DOI] [PubMed] [Google Scholar]
- 39.Vanmechelen E, Vanderstichele H, Davidsson P, Van Kerschaver E, Van Der Perre B, Sjogren M, et al. Quantification of tau phosphorylated at threonine 181 in human cerebrospinal fluid: a sandwich ELISA with a synthetic phosphopeptide for standardization. Neurosci Lett. 2000;285:49–52. doi: 10.1016/s0304-3940(00)01036-3. [DOI] [PubMed] [Google Scholar]
- 40.Reijn TS, Rikkert MO, van Geel WJ, de Jong D, Verbeek MM. Diagnostic accuracy of ELISA and xMAP technology for analysis of amyloid b42 and tau proteins. Clin Chem. 2007;53:859–65. doi: 10.1373/clinchem.2006.081679. [DOI] [PubMed] [Google Scholar]
- 41.Andreason N, Hesse C, Davidsson P, Minthon L, Wallin A, Winblad B, et al. Cerebrospinal fluid b-amyloid(1–42) in Alzheimer disease: differences between early- and late-onset Alzheimer disease and stability during the course of disease. Arch Neurol. 1999;56:673–80. doi: 10.1001/archneur.56.6.673. [DOI] [PubMed] [Google Scholar]
- 42.Lewczuk P, Beck G, Gansland O, Esselmann H, Deisenhammer F, Regeniter A, et al. International quality control survey of neurochemical dementia diagnostics. Neurosci Lett. 2006;409:1–4. doi: 10.1016/j.neulet.2006.07.009. [DOI] [PubMed] [Google Scholar]
- 43.Shaw LM, Vanderstichele H, Knapik-Czajka M, Figurski M, Coart E, Blennow K, et al. Qualification of the analytical and clinical performance of CSF biomarker analyses in ADNI. Acta Neuropathol. 2011;121:597–609. doi: 10.1007/s00401-011-0808-0. [DOI] [PMC free article] [PubMed] [Google Scholar]
- 44.Verwey NA, van der Flier WM, Blennow K, Clark C, Sokolow S, De Deyn PP, et al. A worldwide multicentre comparison of assays for cerebrospinal fluid biomarkers in Alzheimer’s disease. Ann Clin Biochem. 2009;46:235–40. doi: 10.1258/acb.2009.008232. [DOI] [PubMed] [Google Scholar]
- 45.Mattsson N, Andreasson U, Persson S, Arai H, Batish SD, Bernardini S, et al. The Alzheimer’s Association external quality control program for cerebrospinal fluid biomarkers. Alzheimers Dement. 2011;7:386–95. doi: 10.1016/j.jalz.2011.05.2243. [DOI] [PMC free article] [PubMed] [Google Scholar]
- 46.Vanderstichele H, Bibl M, Engelborghs S, Le Bastard N, Lewczuk P, Molinuevo JL, et al. Standardization of preanalytical aspects of cerebrospinal fluid biomarker testing for Alzheimer’s disease diagnosis: a consensus paper from the Alzheimer’s Biomarkers Standardization Initiative. Alzheimers Dement. 2012;8:65–73. doi: 10.1016/j.jalz.2011.07.004. [DOI] [PubMed] [Google Scholar]
- 47.Kang JH, Vanderstichele H, Trojanowski JQ, Shaw LM. Simultaneous analysis of cerebrospinal fluid biomarkers using microsphere-based xMAP multiplex technology for early detection of Alzheimer’s disease. Methods. 2012;56:484–93. doi: 10.1016/j.ymeth.2012.03.023. [DOI] [PubMed] [Google Scholar]
- 48.Zegers I, Keller T, Schreiber W, Sheldon J, Albertini R, Blirup-Jensen S, et al. Characterization of the new serum protein reference material ERM-DA470k/IFCC: value assignment by immunoassay. Clin Chem. 2010;56:1880–8. doi: 10.1373/clinchem.2010.148809. [DOI] [PubMed] [Google Scholar]
- 49.Vanderstichele HM, Shaw L, Vandijck M, Jeromin A, Zetterberg H, Blennow K, et al. Alzheimer disease biomarker testing in cerebrospinal fluid: a method to harmonize assay platforms in the absence of an absolute reference standard. Clin Chem. 2013;59:710–2. doi: 10.1373/clinchem.2012.201830. [DOI] [PubMed] [Google Scholar]
- 50.Carillo M, Blennow K, Soares H, Lewczuk P, Mattsson N, Umek R, et al. Global standardization measurement of cerebral spinal fluid for Alzheimer’s disease: an update from the Alzheimer’s Association global biomarkers consortium. Alzheimer Dement. 2013;9:137–40. doi: 10.1016/j.jalz.2012.11.003. [DOI] [PubMed] [Google Scholar]
- 51.Slemmon JR, Meredith J, Guss V, Andreasson U, Andreasen N, Zetterberg H, Blennow K. Measurement of Aβ1–42 in cerebrospinal fluid is influenced by matrix effects. J Neurochem. 2012;120:325–33. doi: 10.1111/j.1471-4159.2011.07553.x. [DOI] [PubMed] [Google Scholar]
- 52.Lame ME, Chambers EE, Blatnik M. Quantitation of amyloid beta peptides Aβ1–38, Aβ1–40, and Aβ1–42 in human cerebrospinal fluid by ultra-performance liquid chromatography-tandem mass spectrometry. Anal Biochem. 2011;419:133–9. doi: 10.1016/j.ab.2011.08.010. [DOI] [PubMed] [Google Scholar]
- 53.Pannee J, Portelius E, Oppermann M, Ktkins A, Hornshaw M, Zeger I, et al. A selected reaction monitoring (SRM)-based method for absolute quantification of Aβ38, Aβ40, and Aβ42 in cerebrospinal fluid of Alzheimer’s disease patients and healthy controls. J Alzheimer Dis. 2013;33:1021–32. doi: 10.3233/JAD-2012-121471. [DOI] [PubMed] [Google Scholar]
- 54.Blennow K, Hampel H. CSF markers for incipient Alzheimer’s disease. Lancet Neurol. 2003;2:605–13. doi: 10.1016/s1474-4422(03)00530-1. [DOI] [PubMed] [Google Scholar]
- 55.Craig-Schapiro R, Fagan AM, Holzman DM. Biomarkers of Alzheimer’s disease. Neurobiol Dis. 2009;35:128–40. doi: 10.1016/j.nbd.2008.10.003. [DOI] [PMC free article] [PubMed] [Google Scholar]
- 56.Bloudek LM, Spackman DE, Blankenburg M, Sullivan SD. Review and meta-analysis of biomarkers and diagnostic imaging in Alzheimer’s disease. J Alzheimers Dis. 2011;26:627–45. doi: 10.3233/JAD-2011-110458. [DOI] [PubMed] [Google Scholar]
- 57.Shaw LM, Vanderstichele H, Knapik-Czajka M, Clark CM, Aisen PS, Petersen RC, et al. Cerebrospinal fluid biomarker signature in Alzheimer’s disease neuroimaging initiative subjects. Ann Neurol. 2009;65:403–13. doi: 10.1002/ana.21610. [DOI] [PMC free article] [PubMed] [Google Scholar]
- 58.Mattsson N, Zetterberg H, Hansson O, Andreasen N, Parnetti L, Jonsson M, et al. CSF biomarkers and incipient Alzheimer disease in patients with mild cognitive impairment. JAMA. 2009;302:385–93. doi: 10.1001/jama.2009.1064. [DOI] [PubMed] [Google Scholar]
- 59.De Meyer G, Shapiro F, Vanderstichele H, Vanmechelen E, Engelborghs S, De Deyn PP, et al. Diagnosis-independent Alzheimer disease biomarker signature in cognitively normal elderly people. Arch Neurol. 2010;67:949–56. doi: 10.1001/archneurol.2010.179. [DOI] [PMC free article] [PubMed] [Google Scholar]
- 60.Schoonenboom NSM, Reesink FE, Verwey NA, Teunissen CE, van de Ven PM, Pijnenburg YAL, et al. Cerebrospinal fluid markers for differential dementia diagnosis in a large memory clinic cohort. Neurology. 2012;78:47–54. doi: 10.1212/WNL.0b013e31823ed0f0. [DOI] [PubMed] [Google Scholar]
- 61.Bian H, van Swieten JC, Leight S, Massimo L, Wood E, Forman M, et al. CSF biomarkers in frontotemporal lobar degeneration with known pathology. Neurology. 2008;70:1827–35. doi: 10.1212/01.wnl.0000311445.21321.fc. [DOI] [PMC free article] [PubMed] [Google Scholar]
- 62.Hansson O, Zetterberg H, Buchhave P, Londos E, Blennow K, Minthon L. Association between CSF biomarkers and incipient Alzheimer’s disease in patients with mild cognitive impairment: a follow-up study. Lancet Neurol. 2006;5:228–34. doi: 10.1016/S1474-4422(06)70355-6. [DOI] [PubMed] [Google Scholar]
- 63.Buchhave P, Minthon L, Zetterberg H, Wallin AK, Blennow K, Hansson O. Cerebrospinal fluid levels of β-amyloid 1–42, but not of tau, are fully changed already 5 to 10 years before the onset of Alzheimer disease. Arch Gen Psychiatry. 2012;69:98–106. doi: 10.1001/archgenpsychiatry.2011.155. [DOI] [PubMed] [Google Scholar]
- 64.Riemenschneider M, Lautenschlager N, Wagenpfeil S, Diehl J, Drzezga A, Kurz A. Cerebrospinal fluid tau and b-amyloid 42 proteins identify Alzheimer disease in subjects with mild cognitive impairment. Arch Neurol. 2002;59:1729–34. doi: 10.1001/archneur.59.11.1729. [DOI] [PubMed] [Google Scholar]
- 65.Visser PJ, Verhey F, Knol DL, Scheltens P, Wahlund LO, Freund-Levi Y, et al. Prevalence and prognostic value of CSF marker of Alzheimer’s disease pathology in patients with subjective cognitive impairment or mild cognitive impairment in the DESCRIPA study: a prospective cohort study. Lancet Neurol. 2009;8:619–27. doi: 10.1016/S1474-4422(09)70139-5. [DOI] [PubMed] [Google Scholar]
- 66.Hampel H, Teipel SJ, Fuchsberger T, Andreasen N, Wiltfang J, Otto M, et al. Value of CSF beta amyloid1–42 and tau as predictors of Alzheimer’s disease in patients with mild cognitive impairment. Mol Psychiatry. 2004;9:705–10. doi: 10.1038/sj.mp.4001473. [DOI] [PubMed] [Google Scholar]
- 67.Herukka SK, Hallikainen M, Soininen H, Pirttila T. CSF Ab42 and tau or phosphorylated tau and prediction of progressive mild cognitive impairment. Neurology. 2005;64:1294–7. doi: 10.1212/01.WNL.0000156914.16988.56. [DOI] [PubMed] [Google Scholar]
- 68.Fischer P, Jungwirth S, Zehetmayer S, Weissgram S, Hoenigschnabl S, Gelpi E, et al. Conversion from subtypes of mild cognitive impairment to Alzheimer dementia. Neurology. 2007;68:288–91. doi: 10.1212/01.wnl.0000252358.03285.9d. [DOI] [PubMed] [Google Scholar]
- 69.Mangialasche F, Solomon A, Winblad B, Mecocci P, Kivipelto M. Alzheimer’s disease: clinical trials and drug development. Lancet Neurol. 2010;9:702–16. doi: 10.1016/S1474-4422(10)70119-8. [DOI] [PubMed] [Google Scholar]
- 70.Samson K. Phase III Alzheimer trial halted: search for therapeutic biomarkers continues. Ann Neurol. 2010;68:A9–A12. doi: 10.1002/ana.22249. [DOI] [PubMed] [Google Scholar]
- 71.Bateman RJ, Xiong C, Benzinger TL, Fagan AM, Goate A, Fox NC, et al. Clinical and biomarker changes in dominantly inherited Alzheimer’s disease. N Engl J Med. 2012;367:795–804. doi: 10.1056/NEJMoa1202753. [DOI] [PMC free article] [PubMed] [Google Scholar]
- 72.Fagan AM, Roe CM, Xiong C, Mintun MA, Morris JC, Holtzman DM. Cerebrospinal fluid tau/β-amyloid42 ratio as a prediction of cognitive decline in nondemented older adults. Arch Neurol. 2007;64:343–9. doi: 10.1001/archneur.64.3.noc60123. [DOI] [PubMed] [Google Scholar]
- 73.Gold M, Alderton C, Zvartau-Hind M, Egginton S, Saunders AM, Irizarry M, et al. Rosiglitazone monotherapy in mild-to-moderate Alzheimer’s disease: results from a randomized, double-blind, placebo-controlled phase III study. Dement Geratr Cogn Disord. 2010;30:131–46. doi: 10.1159/000318845. [DOI] [PMC free article] [PubMed] [Google Scholar]
- 74.Blennow K, Zetterberg H, Rinne JO, Salloway S, Wei J, Black R, et al. Effect of immunotherapy with bapineuzumab on cerebrospinal fluid biomarker levels in patients with mild to moderate Alzheimer disease. Arch Neurol. 2012;69:1002–10. doi: 10.1001/archneurol.2012.90. [DOI] [PubMed] [Google Scholar]
- 75.van Rossum IA, Vos S, Handels R, Visser PJ. Biomarkers as predictors for conversion from mild cognitive impairment to Alzheimer-type dementia: implications for trial design. J Alzheimers Dis. 2010;20:881–91. doi: 10.3233/JAD-2010-091606. [DOI] [PubMed] [Google Scholar]
- 76.Holland D, McEvoy LK, Desikan RS, Dale AM. Alzheimer’s Disease Neuroimaging Initiative. Enrichment and stratification for predementia Alzheimer disease clinical trials. PLoS One. 2012;7:e47739.75. doi: 10.1371/journal.pone.0047739. [DOI] [PMC free article] [PubMed] [Google Scholar]
- 77.Greenberg BD, Carrillo MC, Ryan JM, Gold M, Gallagher K, Grundman M, et al. Improving Alzheimer’s disease phase II clinical trials. Alzheimer Dement. 2013;9:39–49. doi: 10.1016/j.jalz.2012.02.002. [DOI] [PubMed] [Google Scholar]
- 78.Lewczuk P, Kornhuber J, Vanderstichele H, Vanmechelen E, Esselmann H, Bibl M, et al. Multiplexed quantification of dementia biomarkers in the CSF of patients with early dementias and MCI: a multicenter study. Neurobiol Aging. 2008;29:812–8. doi: 10.1016/j.neurobiolaging.2006.12.010. [DOI] [PubMed] [Google Scholar]
Associated Data
This section collects any data citations, data availability statements, or supplementary materials included in this article.