Abstract
Time domain fluorescence molecular tomography (TD-FMT) provides a unique dataset for enhanced quantification and spatial resolution. The time-gate dataset can be divided into two temporal groups around the maximum counts gate, which are early gates and late gates. It is well established that early gates allow for improved spatial resolution and late gates are essential for fluorophore unmixing and concentration quantification. However, the inverse problem of FMT is ill-posed and typically underdetermined, which makes image reconstruction highly susceptible to data noise. More specifically, photon counts are inherently very low at early gates due to high absorption and scattering of tissue, resulting in a low signal-to-noise ratio and unstable reconstructions. In this work, an Lp regularization-based reconstruction algorithm was developed and tested with our wide-field mesh-based Monte Carlo simulation strategy. We compared the early time-gate reconstructions obtained with the different p (p ∈ {1/16, 1/8, 1/4, 1/3, 1/2, 1, 2}) from a synthetic murine model simulating the fluorophore uptake in the kidneys and preclinical data. The results from a 3D mouse atlas and a mouse experiment show that our L1/4 regularization methods give the best performance for early time gates reconstructions.
Fluorescence molecular tomography (FMT) is a promising optical imaging modality that enables 3D quantitative determination of fluorophore distributions in small animals [1,2]. The most common techniques for FMT are based on continuous wave (CW) excitation, frequency domain (FD) excitation, and time domain (TD) excitation [3]. CW systems, which represent the vast majority of systems employed in FMT, are easy to implement experimentally but do not allow sensing fluorescence lifetimes. Conversely, FD and TD measurements offer the potential of lifetime quantification and discrimination for multiplexed fluorescence reconstructions. However, FD measurements are restricted to the limited number of modulation frequencies that can be acquired. On the other hand, a single TD measurement provides all the modulation frequencies via the Fourier transform. It also brings the CW information by integrating all temporal information. TD measurements can directly quantify the intrinsic fluorophore lifetime by fitting acquired fluorescence time curves to an exponential decay model. As a result, TD measurements provide the most comprehensive information that allows separating multiple markers based on lifetime contrast and offers enhanced quantification and spatial resolution compared to CW/FD measurements [4–6].
For optical tomography, the time-gate (TG) data type derived from temporal point spread function (TPSF) has been used for image reconstruction in functional optical tomography [7] and FMT [8–10]. The TG dataset can be divided into two groups around the maximum counts TG, which are early TGs (the rising portion of TPSFs) and late TGs (the decaying portion of TPSFs) [6]. The photons collected at early TGs are less affected by the scattering effect compared to the bulk of diffused photons collected. As scattering is inevitably associated with blurring and loss of resolution, FMT based on early TGs has been proposed as an attractive strategy to improve spatial resolution [11,12]. However, photon counts are inherently very low at early gates since the measurement at early TGs rejects more than 90% of all the photons transmitted through the tissue. Hence, reconstruction strategies harnessing early TGs are highly susceptible to the unavoidable noise and numerical errors [13], which leads to reduced accuracy and sensitivity. Moreover, the inverse problem of FMT is ill-posed and typically underdetermined. These factors make reconstruction-based early time gates difficult and lead to unstable reconstructions with large image artifacts.
Regularization methods have been devised to mitigate ill-posed and underdetermined inverse problems. The most common regularization technique employed in optical tomography is the L2 regularization [14,15], which is easy to implement and provides robust reconstructions. However, the method over-smoothes the reconstructed images and artifacts surrounding the expected target when the inverse problem is highly ill-posed. Another class of approaches is to use compressive sensing regularization techniques based on sparsity constraint.
Sparsity regularizations, such as L1 and Lp regularizations, have been applied to diffuse optical tomography and demonstrated to provide better performance than L2 regularization in terms of resolution and contrast recovery [16–19]. However, these approaches have not yet been applied to the TG data type. As early TGs improve resolution, and hence increase sparsity in the image space, Lp regularization is an excellent choice for improved reconstructions. In this work, we apply Lp regularization, with p ∈ {1/16, 1/8, 1/4, 1/3, 1/2, 1, 2}, for early TGs FMT, and validate the reconstruction performance on a synthetic murine model and preclinical experimental data cross-validated with microCT.
We employed a wide-field mesh-based time-resolved Monte Carlo (mMC) light propagation model to compute early gate Jacobians for 3-D reconstruction of the fluorescence contrast [20]. The time-gated Jacobians were computed using the forward-adjoint MC method for computational efficiency [21]. A linear relationship between the measured fluorescence b at each detector position for each illumination source and the unknown effective quantum yield x of the fluorophore can be obtained as
| (1) |
where A is an m-by-n Jacobian matrix that establishes the relationship between the measurements and the unknowns. Compressive sensing based on the Lp (0 < p ≤ 1) norm is used to solve the following optimization problem:
| (2) |
and λ is a regularization parameter. In order to solve the optimization problem expressed in Eq. (2), we employ the reweighted Lp method expressed in [22] and reformulate it as (when 0 < p < 1)
| (3) |
where ε is a small positive number to avoid any components of x being zero. ε was set to 10−10. Therefore, we can convert the nonconvex minimization problem into an iterative convex minimization problem in Eq. (3). In our case, that is, at the kth iteration we solve
| (4) |
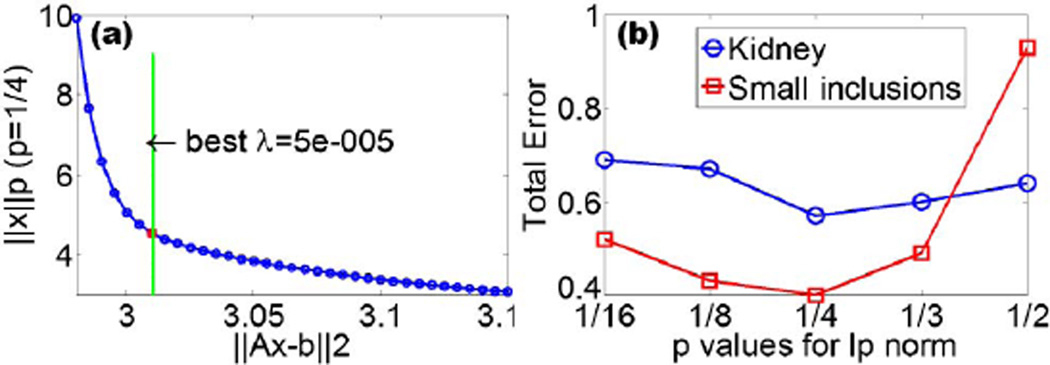
where λ(0) is chosen from L-curve analysis, which is a plot of the Lp norm of the regularized solution (‖x‖p) versus the Euclidean norm of the corresponding residual (‖Ax − b‖2) [Fig. 1(a)]. By applying the iterative shrinkage-thresholding algorithm (detailed discussion can be found in [23]) to the minimization problem of Eq. (4)), we can derive the analytical solution as follows:
| (5) |
where the function “shrink” is defined as shrink(z, α) = max{z − α, 0} · sgn(z), and μ is a sufficiently small step size. μ is set to 0.0001. This approach only involves matrix-vector multiplications and component-wise shrinkage operations at each iteration. Therefore, it is highly computationally efficient. For p = 1, the iterative shrinkage-thresholding algorithm [23] was directly applied to the optimization problem. For comparison, the Pseudoinverse Tikhonov regularization method (L2 norm) was also used in this work. The iteration number is 20,000 for L2 and all Lp (0 < p ≤ 1) norms in numerical simulation, and 1000 for mouse experiment.
Fig. 1.
(a) L-curve analysis (log–log) to select λ = μλi(0) for L1/4 regularization. (b) Total errors for reconstructed kidneys and small inclusions with different Lp regularizations, p ∈ {1/16, 1/8, 1/4, 1/3, 1/2}.
To mimic a preclinical tomographic scenario, the Digimouse mesh model was employed with 4198 nodes and 22,907 tetrahedron elements. The optical properties were set to μa = 0.3 cm−1, , g = 0.9, and n = 1.37. The time profiles were recorded with a 300 ps gate width and 20 ps time shift between the gates to replicate the typical dataset acquired by our wide-field time-domain fluorescence imaging system [24]. 64 sliding half-space illumination patterns with 64 point detectors were simulated within the abdomen section (x, 50–70 mm; y, 8.5–28.5 mm; 400 pixels for each pattern). The detectors were evenly spanned over the region of interest with a 2.857 mm separation. A 5% rising gate (early gate) was selected for reconstruction. Gaussian noise was added to the simulated measurement with a signal-to-noise ratio of SNR = 10 dB, which is more challenging than the one customarily employed in the field [12]. We simulated two typical scenarios in preclinical imaging: organ-level imaging (kidneys) and probe uptake in small regions (3 mm diameter inclusions located at the center of each kidney). The objects were labeled with fluorescent markers (effective quantum yield 1, τ = 0.8 ns). Both cases represent different levels of sparsity in image space and, hence, allow for assessing sparsity regularization over the typical imaging scale encountered in FMT. For this study, we investigated all p ∈ {1/16, 1/8, 1/4, 1/3, 1/2, 1} as well as L2 norm.
We employed four metrics to objectively assess the reconstructions quality, including root mean square error (RMSE), contrast-to-noise ratio (CNR), volume error (VE), and localization error (LE). First, the RMSE is a measure of the difference between reconstructed and expected values, defined as
| (6) |
where K denotes the total number of nodes. Xrecon(i) is the reconstruction value on the ith node and Xtrue-shift(i) is the shifted ground truth with the same 3-D centroid to Xrecon(i). Second, the CNR is a measure of image quality, indicating whether the reconstructed results can be distinguished from the background. To calculate CNR, two regions, which are the nodes of interest (NOI) and nodes of background (NOB), were derived from the reconstructed image. NOI is defined by the location and size of the shifted ground truth. NOB is defined by the remaining nodes of the shifted ground truth. The CNR can be calculated by
| (7) |
where and are the mean reconstructed values in NOI and NOB. WNOI and WNOB are the number of the nodes in NOI and NOB, respectively. σNOI and σNOB are the standard deviations in NOI and NOB.
Third, the VE is defined as the difference of expected and reconstructed volume divided by the volume of the ground truth, and LE is the Euclidean distance between the 3D centroid of the reconstructed object and the expected object. In general, a high-quality reconstructed image possesses RMSE, VE and LE values close to 0 and a large CNR value. To obtain a global metric, we computed a total error defined as
| (8) |
Table 1 summarizes all objective metrics derived from the in silico reconstructions and for all p considered. In all cases investigated, the two objects were successfully reconstructed.
Table 1.
Summary of All Objective Metrics Derived from Simulated Kidneys (Kd) and Small Inclusions (SI) with all Lp Considered
| CNR | RMSE | VE(%)a | LE(mm) | |||||
|---|---|---|---|---|---|---|---|---|
| Lpb | Kd | SI | Kd | SI | Kd | SI | Kd | SI |
| L2 | 5.8 | 10 | 0.7 | 0.9 | 107, 136 | 313, 428 | 0.8, 0.4 | 0.3, 0.5 |
| L1 | 6.3 | 15 | 0.7 | 0.8 | 26, 21 | 220, 318 | 1.8, 2.3 | 2.7, 4.0 |
| L1/2 | 6.5 | 17 | 0.8 | 0.7 | −10, 6 | 25, 46 | 0.6, 0.6 | 1.8, 1.5 |
| L1/3 | 6.5 | 17 | 0.8 | 0.7 | −12, −1 | 11, 12 | 0.5, 0.5 | 2.3, 0.3 |
| L1/4 | 6.5 | 20 | 0.8 | 0.7 | −11, 1 | 11, 12 | 0.5, 0.5 | 2.3, 0.3 |
| L1/8 | 6.4 | 18 | 0.8 | 0.7 | −13, −7 | 1, 12 | 0.5, 0.6 | 2.3, 0.2 |
| L1/16 | 6.3 | 19 | 0.8 | 0.8 | −14, −7 | −12, 12 | 0.6, 0.5 | 2.3, 0.5 |
(right object, left object).
Lp with 50% threshold.
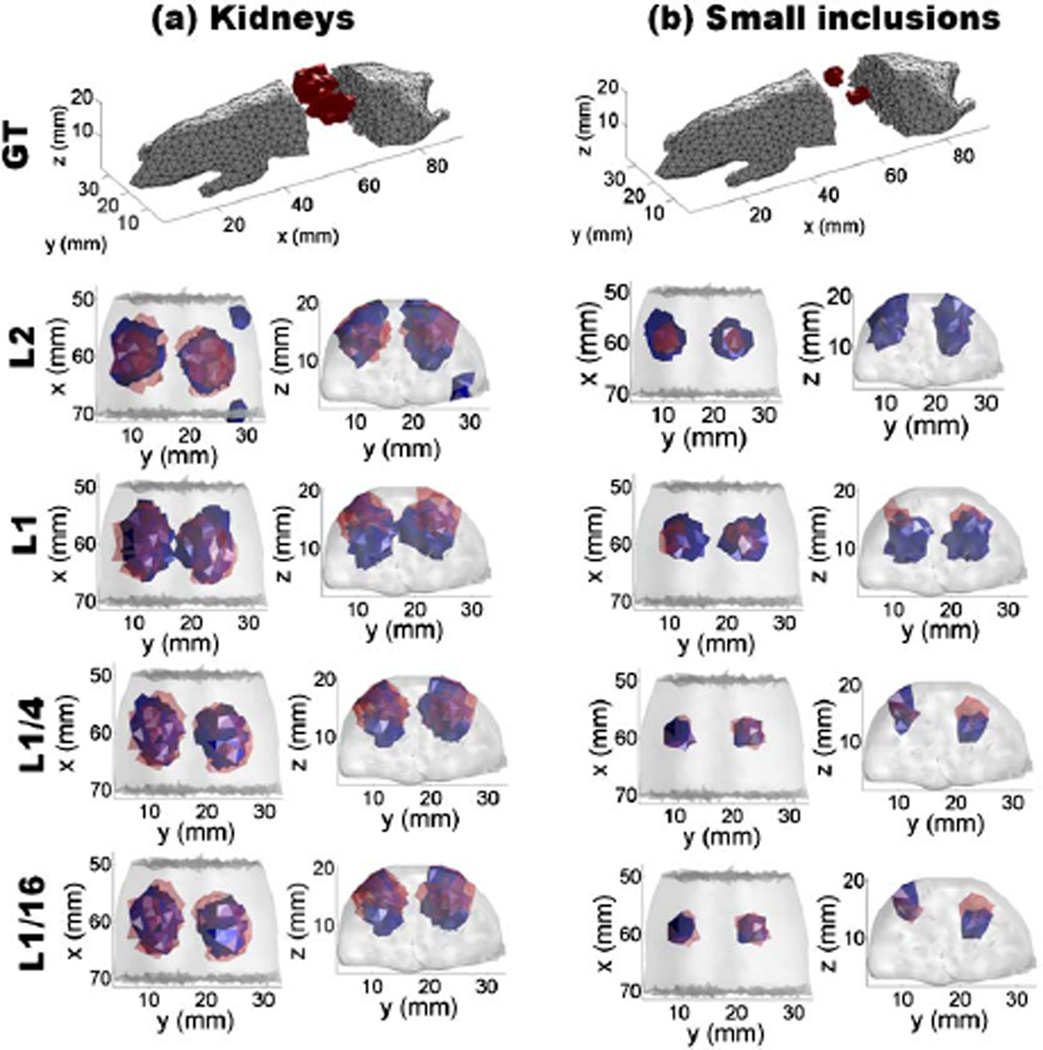
As shown in Table 1, L2 gives the worst CNR and VE, L1 gives worse CNR, VE and LE values than Lp regularization (0 < p < 1). Thus, Lp regularization (0 < p < 1) outperforms L2- and L1 based methods. As indicated in VE, smaller values of p lead to smaller reconstructed objects than the expected result, such as L1/8 and L1/16 in the case of kidneys and L1/16 in the case of small inclusions, due to overconstraining. For each p, the computed total errors are provided in Fig. 1(b). For both kidneys (organ level) and small inclusions, L1/4 regularization leads to the minimal total error. Figure 2 provides the 3-D visualization of the reconstructions for kidneys and small inclusions for p ∈ {1/16, 1/4, 1, 2}. The two reconstructed kidneys based on L1 and L2 regularization are larger than the ground truth. For both kidneys and small inclusions, L1/4-based reconstruction yields objects with similar size to the ground truth. Conversely, L1/16 provides smaller reconstructed objects, as shown in Table 1. Hence, the best reconstructions from organ level to small inclusions imaging were obtained using the L1/4-norm.
Fig. 2.
3D visualizations for in silico reconstructions. (a) The 3D reconstructions for kidneys using Lp regularization with p ∈ {1/16, 1/4, 1, 2}. (b) 3D reconstructions for small inclusions using Lp regularization with p ∈ {1/16, 1/4, 1, 2}. A 50% threshold was used for visualizing L2, L1, L1/4, and L1/16 regularization-based reconstructions. Here the red regions denote the ground truth, and the blue regions are the reconstructed results.
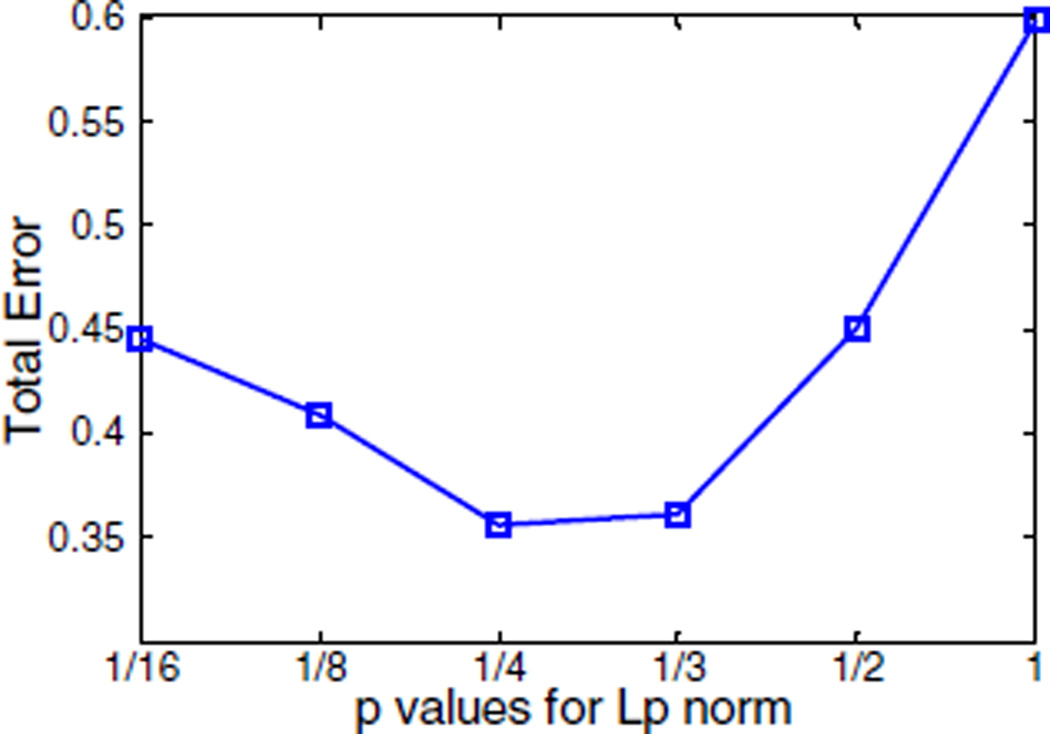
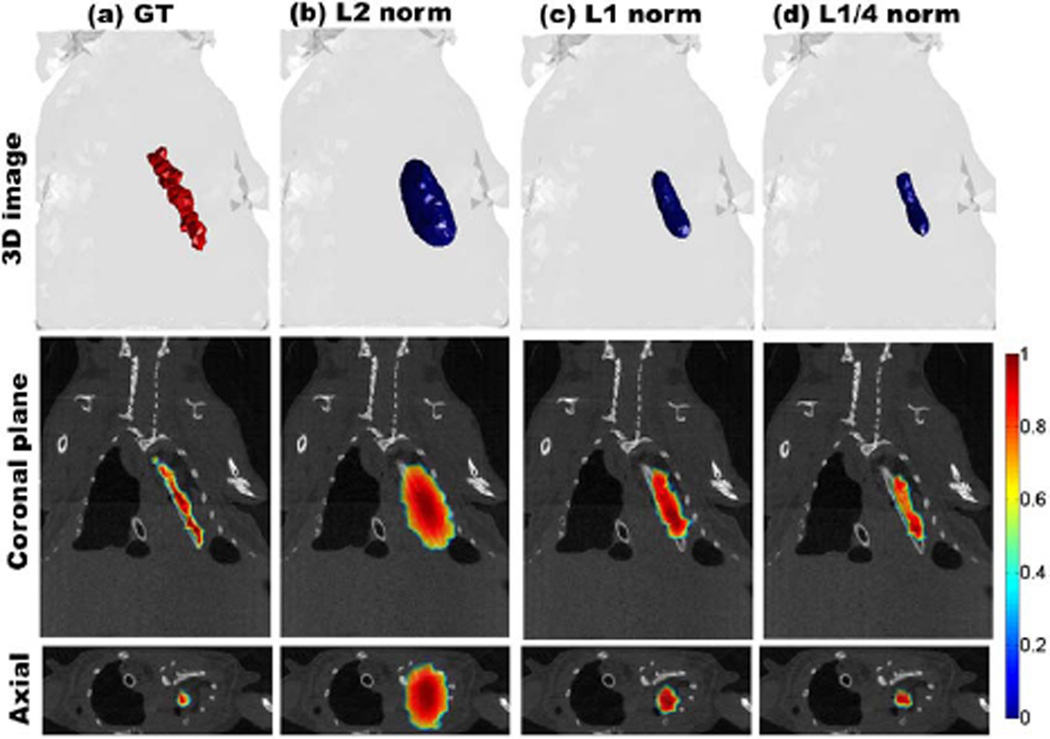
To validate these findings in an experimental setting, a mouse implanted with a 13-mm-long and 1-mm-diameter tube placed in the thoracic cavity was imaged under both wide-field FMT and microCT. The tube contained a solution of 14 pmol of IRDye 800CW in 1 µL ethanol. 64 sliding bar-shaped illumination patterns (each pattern was represented by 594 pixels) were projected onto a 33 mm × 18 mm area on the abdomen. 97 point detectors with a 0.5 mm2 area acquired both transmitted excitation and emission photons over a 4.6 ns time window at 40 ps resolution. microCT images of the mouse were nonconcurrently registered with the optical data to obtain a ground truth of the 3D location of the capillary. The geometric information about the surface of the region of interest (40 mm × 31 mm) was extracted to generate a homogeneous model with 92,713 elements and 15,581 nodes and was further utilized for the mesh-based weight matrix calculation. The entire model was assigned with the average background properties from spectroscopic fitting of the excitation measurements (μa = 0.3 cm−1 and ). The early gate at 5% of its maximum value was selected as the reconstruction data type. Similar to the in silico study, reconstructions using Lp regularization methods were performed and compared. As shown in Fig. 3, L1/4-norm provides the smallest total error (TE = 0.3560), closely followed by the L1/3-norm (TE = 0.3612). The L2 norm led to a TE = 577, which yields a much worse result than Lp (0 < p ≤ 1). Figure 4 shows the 50% isovolume 3D reconstructions for the fluorescent capillary using Lp regularization, p ∈ {1/4, 1, 2}. The L1/4 reconstruction renders a 3D fluorophore biodistribution that matches closely with the ground truth as obtained via microCT. For example, the diameter of the tube as estimated by FMT was 1.4 mm with L1/4, which is very close to the true capillary size of 1 mm. The L1 norm was overestimating the capillary diameter by 108% whereas the L2 overestimated it by 335%.
Fig. 3.
Total errors for the experimental data for Lp regularizations p ∈ {1/16, 1/8, 1/4, 1/3, 1/2, 1}. TE for L2 (TE = 577) is not shown in the curve.
Fig. 4.
50% isovolume of 3D reconstructions based on L2, L1, and L1/4 regularizations using experimental data. The coronal plane at y = 21.5 mm and the axial plane at z = 6.5 mm were used for cross-section validation.
In conclusion, we proposed a Lp (0 < p ≤ 1) regularization-based reconstruction algorithm for early gates FMT and validated this method via 3D mouse atlas in silico study and mouse experiment. The results show that the L1/4 regularization method leads to more accurate solutions than the L1 regularization method for early TGs and it can improve the spatial resolution dramatically over the commonly employed L2 norm. In the case of experimental data, L1/4 norm yields a very accurate reconstruction (8.8 mm in length, 1.4 mm in diameter) compared to the ground truth. This is even more significant considering that the acquisition protocol was limited to a few patterns in transmission without rotation of the subject [25]. These results lay the foundation for establishing quantitative 3D tomographic imaging for lifetime multiplex studies with high resolution. In fact, the combination of early TGs and late TGs in a hierarchical reconstruction scheme [26], in which early-TG reconstructions are employed as a spatial template for subsequent late-TG quantitative reconstructions, can enable high-resolution and a quantitatively accurate lifetime for in vivo tomographic performance. Therefore, this work, combining with wide-field FMT strategies [10,24] and NIR lifetime probes, is poised to facilitate in vivo whole-body lifetime-based tomographic imaging at a high acquisition speed (a few minutes), especially for in vivo FRET imaging [27].
Acknowledgments
This work was partly funded by the National Institutes of Health grant R21 CA161782, R21 EB013421 and National Science Foundation CAREER AWARD CBET-1149407.
References
- 1.Hielscher AH. Curr. Opin. Biotechnol. 2005;16:79. doi: 10.1016/j.copbio.2005.01.002. [DOI] [PubMed] [Google Scholar]
- 2.Leblond F, Davis SC, Valdes PA, Pogue BW. Photochem. Photobiol. B. 2010;98:77. doi: 10.1016/j.jphotobiol.2009.11.007. [DOI] [PMC free article] [PubMed] [Google Scholar]
- 3.Darne C, Lu Y, Sevick-Muraca EM. Phys. Med. Biol. 2014;59:R1. doi: 10.1088/0031-9155/59/1/R1. [DOI] [PubMed] [Google Scholar]
- 4.Berezin MY, Achilefu S. Chem. Rev. 2010;110:2641. doi: 10.1021/cr900343z. [DOI] [PMC free article] [PubMed] [Google Scholar]
- 5.Kumar AT, Raymond SB, Bacskai BJ, Boas DA. Opt. Lett. 2008;33:470. doi: 10.1364/ol.33.000470. [DOI] [PMC free article] [PubMed] [Google Scholar]
- 6.Chen J, Venugopal V, Intes X. Biomed. Opt. Express. 2011;2:871. doi: 10.1364/BOE.2.000871. [DOI] [PMC free article] [PubMed] [Google Scholar]
- 7.Chen J, Intes X. Opt. Express. 2009;17:19566. doi: 10.1364/OE.17.019566. [DOI] [PMC free article] [PubMed] [Google Scholar]
- 8.Soloviev VY, Tahir KB, McGinty J, Elson DS, Neil MA, French PM, Arridge SR. Appl. Opt. 2007;46:7384. doi: 10.1364/ao.46.007384. [DOI] [PubMed] [Google Scholar]
- 9.Mo W, Rohrbach D, Sunar U. J. Biomed. Opt. 2012;17:071306. doi: 10.1117/1.JBO.17.7.071306. [DOI] [PMC free article] [PubMed] [Google Scholar]
- 10.Venugopal V, Chen J, Lesage F, Intes X. Opt. Lett. 2010;35:3189. doi: 10.1364/OL.35.003189. [DOI] [PubMed] [Google Scholar]
- 11.Wu J, Perelman L, Dasari RR, Feld MS. Proc. Natl. Acad. Sci. USA. 1997;94:8783. doi: 10.1073/pnas.94.16.8783. [DOI] [PMC free article] [PubMed] [Google Scholar]
- 12.Niedre M, Ntziachristos V. Opt. Lett. 2010;35:369. doi: 10.1364/OL.35.000369. [DOI] [PubMed] [Google Scholar]
- 13.Venugopal V, Chen J, Intes X. Proc. SPIE. 2013;8578:857827. [Google Scholar]
- 14.Dehghani H, Srinivasan S, Pogue BW, Gibson A. Philos. Transact. Ser. A. Math. Phys. Eng. Sci. 2009;367:3073. doi: 10.1098/rsta.2009.0090. [DOI] [PMC free article] [PubMed] [Google Scholar]
- 15.Egger H, Schlottbom M. SIAM J. Math. Anal. 2010;42:1934. [Google Scholar]
- 16.Suzen M, Giannoula A, Durduran T. Opt. Express. 2010;18:23676. doi: 10.1364/OE.18.023676. [DOI] [PubMed] [Google Scholar]
- 17.Okawa S, Hoshi Y, Yamada Y. Biomed. Opt. Express. 2011;2:3334. doi: 10.1364/BOE.2.003334. [DOI] [PMC free article] [PubMed] [Google Scholar]
- 18.Kavuri VC, Lin ZJ, Tian F, Liu H. Biomed. Opt. Express. 2012;3:943. doi: 10.1364/BOE.3.000943. [DOI] [PMC free article] [PubMed] [Google Scholar]
- 19.Yi H, Chen D, Li W, Zhu S, Wang X, Liang J, Tian J. J. Biomed. Opt. 2013;18:56013. doi: 10.1117/1.JBO.18.5.056013. [DOI] [PubMed] [Google Scholar]
- 20.Chen J, Fang Q, Intes X. J. Biomed. Opt. 2012;17:106009. doi: 10.1117/1.JBO.17.10.106009. [DOI] [PMC free article] [PubMed] [Google Scholar]
- 21.Chen J, Intes X. Med. Phys. 2011;38:5788. doi: 10.1118/1.3641827. [DOI] [PMC free article] [PubMed] [Google Scholar]
- 22.Xu Z, Zhang H, Wang Y, Chang X, Liang Y. Sci. China Inf. Sci. 2010;53:1159. [Google Scholar]
- 23.Beck A, Teboulle M. SIAM J. Imaging Sci. 2009;2:183. [Google Scholar]
- 24.Venugopal V, Chen J, Intes X. Biomed. Opt. Express. 2010;1:143. doi: 10.1364/BOE.1.000143. [DOI] [PMC free article] [PubMed] [Google Scholar]
- 25.Pimpalkhare M, Chen J, Venugopal V, Intes X. Int. J. Biomed. Imag. 2012;2012:942326. doi: 10.1155/2012/942326. [DOI] [PMC free article] [PubMed] [Google Scholar]
- 26.Venugopal V, Chen J, Barroso M, Intes X. Biomed. Opt. Express. 2012;3:3161. doi: 10.1364/BOE.3.003161. [DOI] [PMC free article] [PubMed] [Google Scholar]
- 27.Abe K, Zhao L, Periasamy A, Intes X, Barroso M. PLoS One. 2013;8:e80269. doi: 10.1371/journal.pone.0080269. [DOI] [PMC free article] [PubMed] [Google Scholar]


