

Abstract
Objective
Patient satisfaction with the health care experience has become a top priority for Centers for Medicare and Medicaid Services. With resources and efforts directed at patient satisfaction, we evaluated whether high patient satisfaction measured by HCAHPS surveys correlates with favorable outcomes.
Methods
Medical centers were identified from the University HealthSystem Consortium database from 2011–2012. Variables included hospital characteristics, process measure compliance, and surgical outcomes. Chi-squared analysis was used to evaluate for variables associated with high patient satisfaction (defined as hospitals that scored above the 50th percentile of top box scores).
Results
We identified 171 hospitals with complete data. The following variables were significantly associated with high overall patient satisfaction: large hospitals, high surgical volume, and low mortality (p < 0.001). Compliance with process measures and patient safety indicators, as well as length of stay, did not correlate with overall satisfaction. The presence of complications (p = 0.491) or increased rate of readmission (p = 0.056) were not found to affect patient satisfaction. Low mortality index was consistently found to be associated with high satisfaction across 9 of 10 HCAHPS domains.
Conclusions
We found that hospital size, surgical volume and low mortality were associated with high overall patient satisfaction. However, with the exception of low mortality, favorable surgical outcomes were not consistently associated with high HCAHPS scores. With existing satisfaction surveys, we conclude that factors outside of surgical outcomes appear to influence patients' perceptions of their care.
Introduction
In 1998 the Institute of Medicine formed the Committee on Quality of Health Care in America to develop a strategy to improve the quality of health care in the United States by 2008. Its first task was to address the safety of health care delivery and their first report, To Err is Human: Building a Safer Health System1 was published in 2000. This landmark paper highlighted the deficiencies in the American system related to patient safety. The next task of this committee was to develop a framework for improving the quality of American healthcare. To that end, in 2001, this group published Crossing the Quality Chasm: A New Health System for the 21st Century.2 In this manuscript, the group laid out six goals of healthcare quality for health systems around the country to embrace. They proposed that health systems and health care overall should be safe, effective, patient centered, timely, efficient, and equitable.2 It is important to recognize that the committee did not prioritize one aim above another; each aim was considered independently important.
As surgeons we are often focused on delivering safe and effective care. The culture of surgery, however, where the surgeon is in charge and has the ultimate say in the care of a patient, is often not conducive to patient-centered care. With changes in the health care climate, patient centered care as measured by patient satisfaction surveys has become front and center in the minds of health care leaders. In fact, results of the patient satisfaction Hospital Consumer Assessment of Healthcare Providers and Systems (HCAHPS) survey comprise 30% of the total performance score of Hospital Value Based Purchasing, which will be tied to 2% of Medicare reimbursement by the year 2017.3, 4 This instrument was developed by the Centers for Medicare & Medicaid Services (CMS) and the Agency for Healthcare Research and Quality (AHRQ) to standardize reporting of patients' perceptions of care; the results of the survey have been made publicly available since 2008.5 The percentage of patients who provide “top-box”, or the most positive HCAHPS response, for each domain is used to calculate the total performance score in the Value Based Purchasing program. By linking value-based incentive payments to HCAHPS scores, CMS has emphasized that patient satisfaction is an important component of quality of care.
While it is clear that the delivery of patient-centered care should be a priority, it is not clear that patient satisfaction is directly related to patient safety or effectiveness of care. In fact, previous studies have demonstrated variable associations between patient satisfaction, patient safety, and patient outcomes. In this study, our goal was to determine if patient satisfaction as measured by HCAHPS scores could be used as a surrogate marker for higher performance on common measures of surgical outcomes. We began with the presumption that patient satisfaction is a reflection of patient centered care which by itself is an important component of care but does not necessarily reflect safe and effective care. Therefore, our aims were 1. To evaluate whether high overall patient satisfaction correlated with safety measures related to surgery and 2. To assess whether similar relationships between satisfaction and outcomes exist across all HCAHPS satisfaction domains. We hypothesized that high overall satisfaction does not correlate with these outcomes and that this relationship would be consistent across HCAHPS domains.
Methods
Data Source and Patients
The University HealthSystem Consortium (UHC) database collects clinical and operational data from 120 academic medical centers and 299 affiliated hospitals across the United States. We identified hospitals that participated in the UHC database from 2011 to 2012. Data on adult patients who were discharged by a general surgeon were extracted from the database in an effort to isolate surgical outcomes from the UHC. Patient satisfaction on the HCAHPS survey and Surgical Care Improvement Project (SCIP) process measure compliance was extracted from the Hospital Compare website from the same time period and combined with UHC data. Hospitals were excluded if data from either database were incomplete.
Explanatory Variables
The following hospital characteristics were extracted from the UHC database: hospital geographic region, hospital size defined as number of hospital beds, annual inpatient surgical volume, and percentage of cases that had an ICU stay at each institution. Hospitals were defined as large in size, volume and ICU utilization if they ranked above the median for this cohort of hospitals.
Markers of hospital level quality and safety included the following in-hospital outcomes length of stay, complications, and mortality. Length of stay was reported both as an observed average length of stay and as a risk-adjusted length of stay index. Complications included the following 14 UHC defined complications: Acute myocardial infarction (AMI), aspiration pneumonia, cardiac abnormalities (other than AMI), catheter associated urinary tract infection, complications related to anesthetic agents or central nervous system depressants, gastrointestinal hemorrhage, mechanical complications due to device implant or graft, nosocomial pneumonia, post or intraoperative shock due to anesthesia, postoperative coma or stupor, postoperative stroke, reopening of surgical site, sepsis, and wound infection. UHC complications are identified using ICD 9 codes. Complications were evaluated as percentage of patients who suffered an in-hospital complication at each hospital, and high complication rate was defined as above the 50th percentile for included hospitals. Mortality was recorded as early mortality, defined as death within 48 hours of hospital admission, in-hospital mortality, and risk-adjusted in-hospital mortality, referred to as the mortality index. Hospitals were defined as high performers for each mortality measure if their rate was below the median for included hospitals. Patient safety indicators (PSIs), adverse postoperative events, were also collected from the UHC database. The following PSIs were available from Hospital Compare and were evaluated in this study: death rate in low mortality DRG, pressure ulcer, death rate with serious treatable conditions, retained surgical item, iatrogenic pneumothorax, catheter related blood stream infection, postoperative hip fracture, postoperative hemorrhage, postoperative physiologic derangement, postoperative respiratory failure, postoperative PE or DVT, postoperative sepsis, postoperative wound dehiscence, accidental puncture laceration, and transfusion reaction. Hospitals were analyzed based on proportion of PSIs for which zero events were reported. High performing hospitals were defined as those ranking below the median for low PSIs, ie, had fewer PSI events.
Hospital readmission data within 30 days of hospital discharge was obtained from the UHC database. Readmission data included readmission for any reason within the 30-day time period. High performing hospitals had readmission rates below the 50th percentile of included hospitals.
Compliance with SCIP process measures was obtained from the Hospital Compare website. The following SCIP measures were available and evaluated: antibiotic timing, antibiotic selection, antibiotic end time, cardiac patients with blood glucose control, beta blocker therapy, venous thromboembolism prophylaxis, urinary catheter removal, and intra-operative temperature management. Similar to PSIs, SCIP compliance was evaluated as proportion of SCIP measures where hospitals scored 100%. High performing hospitals were defined as those found to score above the median as compared with hospitals in this study.
Outcomes Measures
Patient satisfaction on the HCAHPS survey was found on the Hospital Compare website. The primary outcome of interest was overall patient satisfaction. We utilized the HCAHPS question “Would you recommend this hospital to friends and family?” to assess overall satisfaction. Hospitals were defined as high performers if they scored above the median for the top-box response, “yes definitely”. To verify these results, we also evaluated the question “What number would you use to rank your hospital (range 0–10)?”. High performers were those who scored above the median for a response of 9 or 10.
Secondary outcomes of interest included the other HCAHPS domains: nursing communication, physician communication, receiving help, pain control, explanation of medications, cleanliness and quietness of room, and discharge information. Hospitals that scored above the median in top-box responses for each question were considered high performers.
Statistical Analysis
This investigation was approved as minimal risk by the University of Wisconsin Health Sciences Institutional Review Board. Descriptive statistics were performed to characterize hospitals based on hospital characteristics, patient outcomes, and process measure compliance. Chi-square analysis was used to evaluate for associations between explanatory variables and high performance on each satisfaction domain. A two-tailed Pearson correlation test was used to determine relationships between continuous outcome variables and patient satisfaction. All statistics were performed in SPSS version 21 and p values <0.05 were considered significant.
Results
We identified 216 hospitals that participated in the UHC database from 2011 to 2012. Of those, 21 hospitals had incomplete UHC data and 24 hospitals had incomplete data on the Hospital Compare website. Our final study sample consisted of 171 hospitals. By geographic regions, 15.8% of hospitals were in the West, 28.1% in the Midwest, 30.4% in the Northeast, and 25.7% in the South. A summary of hospital characteristics are listed in Table 1. The median hospital size was 421 beds with 6,341 annual inpatient operations. The median length of stay was 5.3 days, in-hospital complication rate was 4.2%, and in-hospital mortality rate was 1.2%. The median readmission rate 30 days from discharge was 10.7%. A summary of HCAHPS scores across hospitals is listed in Table 2. The range of top-box scores for patients definitely “recommending a hospital” was the widest of all domains from 46–90%. The highest median top-box score was found for “discharge information given” at 85%, while “quietness of room” had the lowest median top-box score at 55%.
Table 1. A Summary of Hospital Charteristics.
| Hospital Characteristic | Range | Median |
|---|---|---|
| Hospital size | 25–1,280 | 421 |
| Operative volume | 192–24,258 | 6,341 |
| ICU cases | 0 - 53% | 17% |
| SCIP* | 0–100% | 25% |
| Length of stay | 2.92–8.97 | 5.32 |
| Length of stay index | 0.67–1.44 | 0.98 |
| PSI** | 7–100% | 36% |
| Early mortality rate | 0–3.43% | 0.39% |
| Complication rate | 0–8.78% | 4.15% |
| Readmission rate | 3.37–23.25% | 10.72% |
| Mortality rate | 0–9.89% | 1.24% |
| Mortality index | 0–2.61 | 0.83 |
SCIP measures were grouped as percentage of all process measures for which hospital had 100% compliance.
PSIs were grouped as percentage of all PSIs for which the hospital had zero events.
Table 2. HCAHPS Scores Across Hospitals.
| HCAHPS Question | Range | Median |
|---|---|---|
| Patients definitely recommend hospital | 46–90% | 75% |
| Hospital rating 9 or 10 (10 point scale) | 46–86% | 71% |
| Nurses always communicated well | 58–86% | 77% |
| Doctors always communicated well | 64–88% | 79% |
| Patients always received help soon | 46–78% | 62% |
| Pain always well controlled | 51–80% | 69% |
| Staff always explained medications | 44–74% | 62% |
| Room was always clean | 53–84% | 62% |
| Room was always quiet at night | 36–72% | 55% |
| Patients were given discharge information | 70–91% | 85% |
Hospital characteristics associated with high overall patient satisfaction are demonstrated in Figure 1. Large hospitals with high operative volume were found to be significantly associated with high overall patient satisfaction as defined as a positive answer to the first question in the HCAHPS survey “would you recommend this hospital” (p < 0.001). Geographic region was not significantly associated with high overall satisfaction with the following high overall satisfaction scores: West 55.6%, Midwest 45.8%, Northeast 32.7%, and South 56.8% (p = 0.080). Compliance with SCIP process measures trended toward higher satisfaction but the relationship was not statistically significant.
Figure 1.

Hospital characteristics in association with high overall patient satisfaction. The x-axis is the percent of hospitals with top box scores above the median score for definitely recommend this hospital.
We attempted to better understand the relationship of patient satisfaction to measures of safe care. Figure 2a shows the relationship between morbidity and mortality and high overall patient satisfaction. The only measure found to be significantly associated with recommendation of a hospital was low mortality index (p < 0.001). It is interesting to note that while not reaching statistical significance, hospitals with higher rates of PSI (p = 0.11) and in-hospital complications (p = 0.49) tended to have higher patient satisfaction scores compared to hospitals with lower rates of these safety measures.
Figure 2.
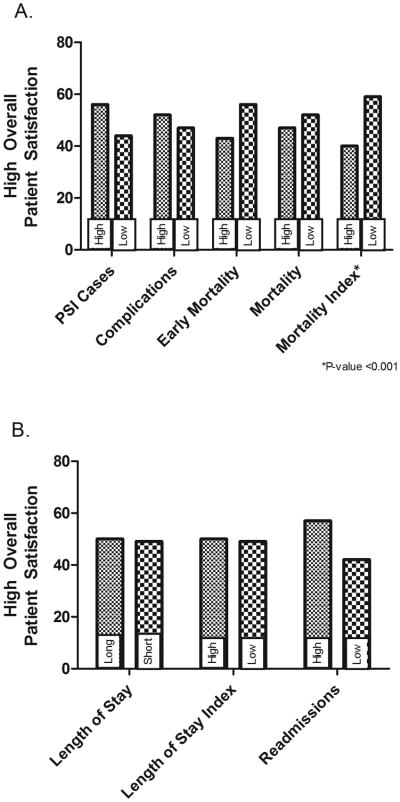
Graphically shown are measures of patient safety correlated with patient satisfaction. Significant differences are marked with a *. (A) Morbidity and mortality as it relates to high overall patient satisfaction. (B) Length of stay and readmissions in association with high overall patient satisfaction.
Given the positive correlation between mortality and patient satisfaction, we hypothesized that hospitals with low rates of readmission and shorter length of stay would also have higher patient satisfaction. However, we found no correlation between length of stay (both observed and risk adjusted) and patient satisfaction (Fig. 2B). High readmission rate tended to correlate with high patient satisfaction but this did not reach statistical significance (p = 0.056).
We repeated the same analyses using the measure of overall patient satisfaction, “What number would you rate the hospital” and obtained the same results (data not shown). In addition, we performed a Pearson correlation analysis using those variables in Figures 1 and 2 as continuous variables and found significant correlations with the question “What number would you rate the hospital.” This analysis confirmed our results, revealing significant positive correlations between operative volume and hospital size (Supplementary Table 1). In addition, significant negative correlations were found between early mortality rate, mortality rate, and mortality index. We found no correlation between patient safety indicators, complication rates, or length of stay and the patient satisfaction scores when analyzed as continuous variables.
In an attempt to better understand the relationship between safety measures and patient satisfaction, we wanted to determine if patients who were satisfied with their provider had good outcomes or if communication with the provider was unrelated to outcomes (Table 3). Interestingly, the relationships varied based on the provider domain examined. For example, high satisfaction on the physician domain but not in the nursing domain correlated with a low early mortality rate. Furthermore, patient satisfaction with nursing communication but not physician communication was found to be significantly associated with SCIP compliance (p = 0.039). We did find a correlation between high satisfaction in both the nursing (p = 0.012) and physician (p = 0.027) communication domains and low mortality index.
Table 3. Satisfaction with Provider Communication.
| HCAHPS Domain | Explanatory Variable | Top HCAHPS Scores N (%) | P Value |
|---|---|---|---|
| Doctor Communication | Early mortality rate | ||
| Low | 45 (52) | ||
| High | 30 (35) | 0.025 | |
|
| |||
| Doctor Communication | Mortality rate | ||
| Low | 48 (56) | ||
| High | 27 (32) | 0.002 | |
|
| |||
| Doctor Communication | Mortality index | ||
| Low | 44 (52) | ||
| High | 31 (36) | 0.027 | |
|
| |||
| Nurse Communication | SCIP compliance | ||
| High | 59 (53) | ||
| Low | 22 (37) | 0.039 | |
|
| |||
| Nurse Communication | Mortality index | ||
| Low | 48 (57) | ||
| High | 33 (38) | 0.012 | |
Others have found relationships between patient's perceptions of the hospital system and safety measures.6 Therefore, we explored whether the hospital experience could be a surrogate marker for measures of safety. High satisfaction on four hospital experience measures, “Always received help”, “medications explained”, “pain controlled”, and “discharge information”, were found to be associated with outcome measures of safety and are listed in Table 4. In fact, satisfaction on all 4 of these domains was found to be significantly associated with low mortality. Patient satisfaction with these experiential domains was found to be variably related to other safety measures (Table 4).
Table 4. Satisfaction with Hospital Experiences.
| HCAHPS Domain | Explanatory Variable | Top HCAHPS Scores N (%) | P Value |
|---|---|---|---|
| Always received help | Hospital size | ||
| Large | 34 (40) | ||
| Small | 51 (59) | 0.012 | |
|
| |||
| Always received help | PSI rate | ||
| Low | 52 (58) | ||
| High | 33 (40) | 0.018 | |
|
| |||
| Always received help | Mortality rate | ||
| Low | 51 (59) | ||
| High | 34 (40) | 0.012 | |
|
| |||
| Always received help | Mortality index | ||
| Low | 51 (61) | ||
| High | 34 (39) | 0.005 | |
|
| |||
| Always received help | Length of stay | ||
| Short | 52 (60) | ||
| Long | 33 (39) | 0.005 | |
|
| |||
| Always received help | Length of stay index | ||
| Low | 51 (60) | ||
| High | 34 (39) | 0.007 | |
|
| |||
| Medications explained | Geographic region | ||
| West | 9 (33) | ||
| Midwest | 23 (48) | ||
| North-east | 22 (42) | ||
| South | 28 (66) | 0.035 | |
|
| |||
| Medications explained | SCIP Compliance | ||
| High | 61 (55) | ||
| Low | 22 (37) | 0.022 | |
|
| |||
| Medications explained | Early mortality rate | ||
| Low | 50 (58) | ||
| High | 33 (39) | 0.012 | |
|
| |||
| Medications explained | Mortality rate | ||
| Low | 51 (59) | ||
| High | 32 (38) | 0.005 | |
|
| |||
| Medications explained | Mortality index | ||
| Low | 48 (57) | ||
| High | 35 (40) | 0.027 | |
|
| |||
| Pain controlled | ICU Cases | ||
| Low | 46 (54) | ||
| High | 31 (36) | 0.018 | |
|
| |||
| Pain controlled | SCIP compliance | ||
| High | 58 (52) | ||
| Low | 19 (32) | 0.010 | |
|
| |||
| Pain controlled | Length of Stay | ||
| Short | 47 (55) | ||
| Long | 30 (35) | 0.011 | |
|
| |||
| Pain controlled | PSI rate | ||
| Low | 47 (53) | ||
| High | 30 (37) | 0.033 | |
|
| |||
| Pain controlled | Early mortality rate | ||
| Low | 50 (58) | ||
| High | 27 (32) | 0.001 | |
|
| |||
| Pain controlled | Mortality rate | ||
| Low | 53 (62) | ||
| High | 24 (28) | <0.001 | |
|
| |||
| Pain controlled | Mortality index | ||
| Low | 49 (58) | ||
| High | 28 (32) | 0.001 | |
|
| |||
| Discharge information | Mortality index | ||
| Low | 48 (57) | ||
| High | 30 (34) | 0.003 | |
|
| |||
| Discharge information | Length of stay | ||
| Short | 47 (55) | ||
| Long | 31 (36) | 0.012 | |
Questions related to the hospital environment are also included on the HCAHPs survey and these domains have also been shown to correlate with safety outcomes by others.6 Therefore, we were interested in understanding if a patient's perception of the hospital environment could impact the outcomes on the safety measures of interest. These data are presented in Table 5 and we found that high satisfaction with room cleanliness correlated with a low PSI rate, low mortality rate, and a low rate of readmission (p < 0.05).
Table 5. Satisfaction with Hospital Environment.
| HCAHPS Domain | Explanatory Variable | Top HCAHPS Scores N (%) | P Value |
|---|---|---|---|
| Geographic Region | Geographic region | ||
| West | 9 (33) | ||
| Midwest | 25 (52) | ||
| North-east | 11 (21) | ||
| South | 32 (73) | <0.001 | |
| Quietness of room | Operative volume | ||
| High | 31 (36) | ||
| Low | 46 (53) | 0.025 | |
| Cleanliness of room | Hospital volume | ||
| High | 28 (33) | ||
| Low | 47 (55) | 0.004 | |
|
| |||
| Cleanliness of room | ICU cases | ||
| High | 30 (35) | ||
| Low | 45 (53) | 0.017 | |
|
| |||
| Cleanliness of room | PSI rate | ||
| Low | 51 (57) | ||
| High | 24 (29) | <0.001 | |
|
| |||
| Cleanliness of room | Mortality rate | ||
| Low | 48 (56) | ||
| High | 27 (32) | 0.002 | |
|
| |||
| Cleanliness of room | Mortality index | ||
| Low | 50 (60) | ||
| High | 25 (29) | <0.001 | |
|
| |||
| Cleanliness of room | Length of stay | ||
| Short | 49 (57) | ||
| Long | 26 (31) | 0.001 | |
|
| |||
| Cleanliness of room | Length of stay index | ||
| Low | 49 (58) | ||
| High | 26 (30) | <0.001 | |
|
| |||
| Cleanliness of room | Readmission rate | ||
| Low | 46 (53) | ||
| High | 29 (35) | 0.016 | |
Table 6 summarizes all outcome measures examined as they relate to the satisfaction domains. Low mortality index correlates with high performance on 90% of the satisfaction measures. No other outcome measure correlated with more than 50% of the satisfaction domains. It is interesting to note that a satisfaction domain that likely reflects the hospital system, cleanliness of the environment, correlates with high performance on 50% of the outcome measures.
Table 6.
Shown are the P-values for each outcome measure correlated with the respective HCAHPS survey domain. The domains are fully defined in Table 2. Explanatory and outcome measures are grouped according to an IOM quality aim.
| HCAHPS DOMAINS | |||||||||||
|---|---|---|---|---|---|---|---|---|---|---|---|
|
| |||||||||||
| Outcome/System Measures | Recommend hospital | Hospital rating | Nurses | Doctors | Help | Pain | Medications | Room Clean | Quiet | Discharge | |
|
| |||||||||||
| Health Care System | Geographic region Large hospital size | <0.001 | 0.039 | 0.035 | <0.001 | ||||||
| High Operative volume | <0.001 | 0.003 | |||||||||
| High Volume ICU cases | |||||||||||
|
| |||||||||||
| Effectiveness | 100% SCIP Compliance | 0.039 | 0.01 | 0.022 | |||||||
|
| |||||||||||
| Efficiency | Short Length of stay | 0.005 | 0.001 | ||||||||
| Short Length of stay index | 0.007 | 0.011 | <0.001 | 0.012 | |||||||
|
| |||||||||||
| Safety | Low Rate of PSI | 0.018 | 0.03 | <0.001 | |||||||
| Low Complication rate | |||||||||||
| Low Readmission rate | 0.016 | ||||||||||
| Low mortality rate | 0.002 | 0.012 | <0.001 | 0.005 | 0.002 | ||||||
| Low mortality index | <0.001 | 0.012 | 0.012 | 0.027 | 0.005 | 0.001 | 0.027 | <0.001 | 0.003 | ||
| Low early mortality rate | 0.025 | 0.001 | 0.012 | ||||||||
Discussion
We found that large hospitals with high surgical volume were associated with high overall patient satisfaction. However, with the exception of risk-adjusted mortality, we were surprised to find no other outcome to be associated with high overall satisfaction. The association between low mortality and improved satisfaction was consistent across HCAHPS domains. Interestingly, the volume satisfaction relationship was inconsistent across domains, with small, low volume hospitals receiving higher satisfaction scores on cleanliness, quietness, and receiving help measures. Similar discrepancies were identified with readmission rates where high readmission rates trended toward higher overall satisfaction, while low readmission rates were significantly associated with high scores on the cleanliness domain. We conclude that factors outside of the safety measures influence patients' perceptions of care and that associations between satisfaction and patient safety and effectiveness are inconsistent across domains.
Our results indicate that patient satisfaction is not a surrogate of patient safety and effectiveness. In fact, it is clear from these findings that factors outside of patient safety impact the patient experience reflected by the HCAHPs survey. While patient satisfaction is clearly a separate quality measure, we must be clear when expressing these results that this particular measure does not reflect the safety of care delivered by a hospital. In fact, it appears that patients can be satisfied with their care yet experience outcomes that we would classify as less than ideal such as in hospital complications or a readmission after discharge.
We did find that low mortality hospitals have higher patient satisfaction scores compared to high mortality hospitals. This finding contradicts the existing literature in that Elliott and colleagues7 found no differences in overall satisfaction or perceptions of physician communication in patients who died within one year of survey completion compared with patients alive at one year. In fact, in Elliot's study, patients with less than one year to live were more satisfied with timeliness of care (p<0.001), compared with the one-year survival group. However, Elliot evaluated data from Medicare Advantage patients which introduces significant bias as older age has repeatedly been found to be associated with higher HCAHPS satisfaction scores.8, 9 In addition, our study uses the short term mortality at the hospital level, while Elliott's study assessed patient specific mortality up to one year after survey completion. In this study, we used mortality as a reflection of patient safety in these hospitals. We recognize that a patient who has died cannot return a survey. However, we also propose that given the low mortality rate in this study (median=1.24%), we suspect that negative returns would not have significantly changed our results.
We found a non-significant relationship between high readmission rates and high patient satisfaction. This also contrasts with the previous literature as others have identified an association between low readmission rates and high patient satisfaction.10, 11 We did find that high levels of satisfaction with room cleanliness correlated with low readmission rates. These differences may be a reflection of differing patient populations. Most of the current literature on the topic of patient satisfaction and safety results has been published using data from medical patients with pneumonia, acute myocardial infarction, and congestive heart failure,10, 11 while in this study we identified patients who had been discharged from a surgical service. It is well known that most surgical readmissions are due to postoperative complications,12-16 while medical patients are most frequently readmitted for recurrence or exacerbation of the underlying medical condition treated during the index hospitalization.17-19 These differences highlight challenges in comparing patient outcomes between medical and surgical patients. Similar challenges likely exist in comparing patient satisfaction scores across specialties. Satisfaction with physician communication on the HCAHPS survey has been shown to be the strongest predictor of overall satisfaction on the composite and global measures of the survey.20-23 Despite well-documented construct validity between measures, we did not find a consistent relationship between hospital characteristics or patient safety outcomes across satisfaction measures. Low mortality was found to reliably correlate with all measures of patient satisfaction, while other variables had fluctuating associations across HCAHPS domains. This may be due to other unmeasured factors influencing patient satisfaction and highlights the need for further evaluation of the predictors of high patient satisfaction.
The findings of this study should be interpreted in the context of several limitations. Due to a small number of hospital data available in both the UHC database and the Hospital Compare website, high satisfaction scores were defined as above the median for participating hospitals. More granular data (separating hospitals into quartiles or deciles) may have allowed for a better understanding on the relationship between satisfaction and outcomes; however the study was not powered to evaluate smaller groups of hospitals. We attempted to overcome this limitation by analyzing the data as continuous variables using Pearson correlation test, which confirmed our results. Similarly, PSIs and SCIP measures were evaluated as perfect performance compared with less than perfect performance. As more hospitals participate in transparent reporting, more detailed studies can be performed. The complications evaluated in the study were those captured by the UHC database, while identification of complications based on billing data has limitations, it is necessary for studies evaluating de-identified groups of patients. We were also unable to perform a meaningful multivariate analysis given a high degree of collinearity between explanatory variables. In particular given the collinearity between academic medical centers, hospital size, and surgical volume, we were unable to determine if the effect of high surgical volume on patient satisfaction is a reflection of the system related to an academic medical center.
Data obtained from the UHC database and the Hospital Compare website was not patient specific and therefore it is unknown whether patients who suffered adverse outcomes also completed satisfaction surveys. In an effort to evaluate surgical outcomes in UHC, data were filtered by discharge provider and patients discharged by a general surgeon were included. While this group of patients likely underwent surgical procedures, patients who underwent surgical procedures and were discharged from medical services were not included in our analysis. The general lack of granularity also makes it impossible for us to determine if patients had an emergency or elective operation. We recognize that emergency patients may have a worse experience thereby limiting our results. Furthermore, HCAHPS data from the Hospital Compare website included medical, surgical, and obstetric patients while UHC data was limited to surgical outcomes. This poses a significant limitation in the interpretation of our data as the majority of patients submitting a satisfaction survey will not have had an operation during their stay. However, there are no large national databases currently available that have patient specific HCAHPs data available. Therefore, a major strength of this study is the evaluation of multiple patient outcomes and hospital characteristics in relation to HCAHPS scores across hospitals, assessment of surgery specific patient outcomes as they relate to satisfaction, and inclusion of all HCAHPS domains in the analysis.
The fact that patient safety and effectiveness outcomes do not necessarily correlate with patient satisfaction is not particularly surprising and should not lead one to believe that satisfaction is not a valid quality measure. In fact, patient centered care should be a goal of every physician, and this survey is designed to reflect the health care experience from the patient's perspective. There is no reason to believe a patient can reliably predict the safety or effectiveness of care delivered. In fact, a better measure of a patient's understanding of their care might be measures of patient engagement and their ability to participate in shared decision making.24, 25 Future studies should examine the effect of patient engagement on patient satisfaction and outcomes.
Another question to consider is if the HCAHPS survey should be utilized for all patients in the hospital or if other specialty Consumer Assessment of Healthcare Providers and Systems (CAHPS) surveys should be developed. In fact, the American College of Surgeons and Surgical Quality Alliance developed and submitted to the CAHPS consortium a surgical survey in 2009 and adopted it for use in 2010.26 This survey assesses patient's experiences of care before, during, and after surgery through a 42-item survey. As this survey becomes more broadly utilized it will be interesting to see if patient satisfaction scores better correlate with patient safety outcomes.
In summary, this study demonstrates that large, high surgical volume hospitals with low mortality rates are more likely to have high overall patient satisfaction scores. Hospitals with low mortality were found to have higher HCAHPS scores across all domains, whereas other relationships between outcome variables and satisfaction were inconsistent across domains. These results suggest that patient satisfaction is a complex measure that requires more study to truly understand how patients perceive the care they receive. More importantly, we must begin to consider how engaged patients are in their care to ensure we are truly delivering patient centered surgical care. Finally, future studies should examine results of CAHPS surgical survey and correlate these results with patient safety. As patients become more engaged in their care, they will likely better understand the outcomes, and their satisfaction will be a reflection of safety and effectiveness. The present tool is not a surrogate marker for safety but is an important measure of patient centered care.
Supplementary Material
Supplementary Table 1. Correlations between hospital variables and the HCAHPS question “What would you rate your hospital?”
Acknowledgments
We would like to thank Glen Leverson, who provided statistical advice for this project. Support for this study was provided by NIH T32 training grant (CA090217).
Footnotes
The authors have no conflicts of interest to declare.
References
- 1.Kohn LT, Corrigan J, Donaldson MS Institute of Medicine (U.S.). Committee on Quality of Health Care in America. To err is human : building a safer health system. Washington, D.C.: National Academy Press; 2000. [PubMed] [Google Scholar]
- 2.Institute of Medicine (U.S.). Committee on Quality of Health Care in America. Crossing the quality chasm : a new health system for the 21st century. Washington, D.C.: National Academy Press; 2001. [Google Scholar]
- 3.Petrullo K, Lamar S, Nwankwo-Otti O, Alexander-Mills K, Viola D. The Patient Satisfaction Survey: What does it mean to your bottom line? J Hosp Adm. 2012;2:1–8. [Google Scholar]
- 4.VanLare JM, Conway PH. Value-based purchasing—national programs to move from volume to value. N Engl J Med. 2012;367:292–295. doi: 10.1056/NEJMp1204939. [DOI] [PubMed] [Google Scholar]
- 5.Giordano LA, Elliott MN, Goldstein E, et al. Development, implementation, and public reporting of the HCAHPS survey. Med Care Res Rev. 2010;67:27–37. doi: 10.1177/1077558709341065. [DOI] [PubMed] [Google Scholar]
- 6.Isaac T, Zaslavsky AM, Cleary PD, et al. The relationship between patients' perception of care and measures of hospital quality and safety. Health Serv Res. 2010;45:1024–1040. doi: 10.1111/j.1475-6773.2010.01122.x. [DOI] [PMC free article] [PubMed] [Google Scholar]
- 7.Elliott MN, Haviland AM, Cleary PD, et al. Care experiences of managed care Medicare enrollees near the end of life. J Am Geriatr Soc. 2013;61:407–412. doi: 10.1111/jgs.12121. [DOI] [PubMed] [Google Scholar]
- 8.O'Malley AJ, Zaslavsky AM, Elliott MN, et al. Case-mix adjustment of the CAHPS Hospital Survey. Health Serv Res. 2005;40:2162–2181. doi: 10.1111/j.1475-6773.2005.00470.x. [DOI] [PMC free article] [PubMed] [Google Scholar]
- 9.Elliott MN, Swartz R, Adams J, Spritzer KL, Hays RD. Case-mix adjustment of the National CAHPS benchmarking data 1.0: a violation of model assumptions? Health Serv Res. 2001;36:555–573. [PMC free article] [PubMed] [Google Scholar]
- 10.Jha AK, Orav EJ, Epstein AM. Public reporting of discharge planning and rates of readmissions. N Engl J Med. 2009;361:2637–2645. doi: 10.1056/NEJMsa0904859. [DOI] [PubMed] [Google Scholar]
- 11.Boulding W, Glickman SW, Manary MP, et al. Relationship between patient satisfaction with inpatient care and hospital readmission within 30 days. Am J Manag Care. 2011;17:41–48. [PubMed] [Google Scholar]
- 12.Greenblatt DY, Weber SM, O'Connor ES, et al. Readmission after colectomy for cancer predicts one-year mortality. Ann Surg. 2010;251:659–669. doi: 10.1097/SLA.0b013e3181d3d27c. [DOI] [PMC free article] [PubMed] [Google Scholar]
- 13.Reddy DM, Townsend CM, Jr, Kuo YF, et al. Readmission after pancreatectomy for pancreatic cancer in Medicare patients. J Gastrointest Surg. 2009;13:1963–1974. doi: 10.1007/s11605-009-1006-4. discussion 74-75. [DOI] [PMC free article] [PubMed] [Google Scholar]
- 14.Greenblatt DY, Greenberg CC, Kind AJ, et al. Causes and implications of readmission after abdominal aortic aneurysm repair. Ann Surg. 2012;256:595–605. doi: 10.1097/SLA.0b013e31826b4bfe. [DOI] [PMC free article] [PubMed] [Google Scholar]
- 15.Tuggle CT, Park LS, Roman S, et al. Rehospitalization among elderly patients with thyroid cancer after thyroidectomy are prevalent and costly. Ann Surg Oncol. 2010;17:2816–2823. doi: 10.1245/s10434-010-1144-7. [DOI] [PubMed] [Google Scholar]
- 16.Kerwel TG, Leichtle SW, Asgeirsson T, et al. Risk factors for readmission after elective colectomy: postoperative complications are more important than patient and operative factors. Dis Colon Rectum. 2014;57:98–104. doi: 10.1097/DCR.0000000000000007. [DOI] [PubMed] [Google Scholar]
- 17.Brown JR, Conley SM, Niles NW., 2nd Predicting readmission or death after acute ST-elevation myocardial infarction. Clin Cardiol. 2013;36:570–575. doi: 10.1002/clc.22156. [DOI] [PMC free article] [PubMed] [Google Scholar]
- 18.Annema C, Luttik ML, Jaarsma T. Reasons for readmission in heart failure: Perspectives of patients, caregivers, cardiologists, and heart failure nurses. Heart Lung. 2009;38:427–34. doi: 10.1016/j.hrtlng.2008.12.002. [DOI] [PubMed] [Google Scholar]
- 19.Dharmarajan K, Hsieh AF, Lin Z, et al. Hospital readmission performance and patterns of readmission: retrospective cohort study of Medicare admissions. BMJ. 2013;347:f6571. doi: 10.1136/bmj.f6571. [DOI] [PMC free article] [PubMed] [Google Scholar]
- 20.Dyer N, Sorra JS, Smith SA, et al. Psychometric properties of the Consumer Assessment of Healthcare Providers and Systems (CAHPS(R)) Clinician and Group Adult Visit Survey. Med Care. 2012;50:S28–34. doi: 10.1097/MLR.0b013e31826cbc0d. [DOI] [PMC free article] [PubMed] [Google Scholar]
- 21.Solomon LS, Hays RD, Zaslavsky AM, et al. Psychometric properties of a group-level Consumer Assessment of Health Plans Study (CAHPS) instrument. Med Care. 2005;43:53–60. [PubMed] [Google Scholar]
- 22.Hargraves JL, Hays RD, Cleary PD. Psychometric properties of the Consumer Assessment of Health Plans Study (CAHPS) 2.0 adult core survey. Health Serv Res. 2003;38:1509–1527. doi: 10.1111/j.1475-6773.2003.00190.x. [DOI] [PMC free article] [PubMed] [Google Scholar]
- 23.Hays RD, Shaul JA, Williams VS, et al. Psychometric properties of the CAHPS 1.0 survey measures. Consumer Assessment of Health Plans Study. Med Care. 1999;37:MS22–31. doi: 10.1097/00005650-199903001-00003. [DOI] [PubMed] [Google Scholar]
- 24.Joe GW, Broome KM, Rowan-Szal GA, Simpson DD. Measuring patient attributes and engagement in treatment. J Subst Abuse Treat. 2002;22:183–196. doi: 10.1016/s0740-5472(02)00232-5. [DOI] [PubMed] [Google Scholar]
- 25.Bozic KJ, Belkora J, Chan V, et al. Shared decision making in patients with osteoarthritis of the hip and knee: results of a randomized controlled trial. J Bone Joint Surg Am. 2013;95:1633–1639. doi: 10.2106/JBJS.M.00004. [DOI] [PubMed] [Google Scholar]
- 26.Hoy EW. The surgical CAHPS survey. Bull Am Coll Surg. 2009;94:6–7. [PubMed] [Google Scholar]
Associated Data
This section collects any data citations, data availability statements, or supplementary materials included in this article.
Supplementary Materials
Supplementary Table 1. Correlations between hospital variables and the HCAHPS question “What would you rate your hospital?”