Abstract
Increasing evidence suggests that TRB3, a mammalian homolog of Drosophila tribbles, plays an important role in cell growth, differentiation, and metabolism. In the liver, TRB3 binds and inhibits Akt activity, whereas in adipocytes, TRB3 upregulates fatty acid oxidation. In cultured muscle cells, TRB3 has been identified as a potential regulator of insulin signaling. However, little is known about the function and regulation of TRB3 in skeletal muscle in vivo. In the current study, we found that 4 wk of voluntary wheel running (6.6 ± 0.4 km/day) increased TRB3 mRNA by 1.6-fold and protein by 2.5-fold in the triceps muscle. Consistent with this finding, muscle-specific transgenic mice that overexpress TRB3 (TG) had a pronounced increase in exercise capacity compared with wild-type (WT) littermates (TG: 1,535 ± 283; WT: 644 ± 67 joules). The increase in exercise capacity in TRB3 TG mice was not associated with changes in glucose uptake or glycogen levels; however, these mice displayed a dramatic shift toward a more oxidative/fatigue-resistant (type I/IIA) muscle fiber type, including threefold more type I fibers in soleus muscles. Skeletal muscle from TRB3 TG mice had significantly decreased PPARα expression, twofold higher levels of miR208b and miR499, and corresponding increases in the myosin heavy chain isoforms Myh7 and Myb7b, which encode these microRNAs. These findings suggest that TRB3 regulates muscle fiber type via a peroxisome proliferator-activated receptor-α (PPAR-α)-regulated miR499/miR208b pathway, revealing a novel function for TRB3 in the regulation of skeletal muscle fiber type and exercise capacity.
Keywords: TRB3, exercise capacity, muscle, microRNAs, PPAR-α
tribbles homolog 3 (TRB3), a mammalian homolog of Drosophila tribbles, is a pseudokinase that plays an important role in a variety of cellular processes, including growth and differentiation. In addition, there is increasing evidence that TRB3 plays a key role in regulating glucose and lipid homeostasis in metabolically active tissues (17). However, there is conflicting evidence as to whether TRB3 plays a positive or negative role in the regulation of metabolic processes. As examples, TRB3 expression is regulated by peroxisome proliferator-activated receptor-α (PPAR-α), a nuclear receptor that has been targeted for its insulin-sensitizing properties; and in adipocytes, TRB3 has been shown to upregulate fatty acid oxidation, thus exhibiting a positive effect on metabolism (17). However, TRB3 expression is also induced by endoplasmic reticulum stress (2, 6, 22), a process that is associated with negative metabolic consequences. In the liver, heart, and pancreatic β-cells, TRB3 binds to the insulin-activated kinase Akt, blocking its activation and impairing insulin action (2, 7, 15, 19). Therefore, it appears that TRB3 may play a positive or negative role in metabolism, depending on the specific tissue being studied and the physiological context.
Skeletal muscle plays a critical role in maintaining whole body metabolic health due to its large contribution to body mass (∼40%), and its high capacity to store and metabolize substrates such as glucose and fatty acids. Thus, considering the role for TRB3 to regulate metabolism in other tissues, it follows that TRB3 may also regulate metabolism in skeletal muscle. In fact, we have previously shown that TRB3 may act as a negative regulator of insulin action in cultured C2C12 muscle cells (15). However, the role of increased TRB3 expression in the regulation of skeletal muscle metabolism in vivo is currently unknown. Therefore, one goal of this study was to investigate the effects of muscle-specific TRB3 overexpression in a transgenic (TG) mouse model to elucidate the role of TRB3 on skeletal muscle metabolism.
Exercise training is one of the most effective treatments for the improvement of whole body metabolic health, and TRB3 expression has been shown to decrease in response to exercise training in the liver of high-fat fed, but not lean, mice (21). However, TRB3 expression in response to exercise training in skeletal muscle, a primary site for exercise-induced metabolic improvements, has not been determined. Therefore, another aim of this study was to determine the effect of exercise training on TRB3 expression in skeletal muscle.
We have performed the first investigation of chronic TRB3 overexpression on muscle phenotype and function in vivo. Our findings show that in contrast to other tissues and muscle cells in culture, chronic overexpression of TRB3 in skeletal muscle did not impair insulin action or glucose metabolism. Instead, we discovered a new role for TRB3 in the regulation of muscle fiber type and signaling via a PPARα-regulated miR499/miR208b pathway. Our investigation reveals a novel function of TRB3 in skeletal muscle, highlighting the complex and tissue-specific roles for TRB3 in the regulation of metabolic health.
MATERIALS AND METHODS
Animals.
TG mice overexpressing TRB3 in skeletal muscle were generated at the Salk Institute (San Diego, CA) using skeletal muscle actin (Smactin) promoter. All the mice were housed with a 12 h:12 h light-dark cycle and fed standard laboratory chow and water ad libitum. The mice were fasted from 7:00 to 12:00 before the study or as indicated. Protocols for animal use were reviewed and approved by the Institutional Animal Care and Use Committee of the Joslin Diabetes Center and were in accordance with National Institutes of Health guidelines. To determine the training effect on TRB3 in muscle, 10-wk-old male C57BL/6 mice (Charles River Laboratories) were housed in wheel cages for 4 wk, and sedentary mice were housed in separate cages without a wheel.
Body composition.
Fat and lean mass of wild-type (WT) and TG mice were determined by dual-energy X-ray absorptiometry (DEXA) scanning with a Lunar PIXImus2 mouse densitometer.
Maximal exercise capacity.
Maximal exercise capacity was determined as described previously (10). Briefly, WT and TG female mice at 8 wk of age were subjected to a graded ramp treadmill running protocol. The treadmill speed began at 0.2 miles/h and increased 0.2 miles/h every 3 min until the speed reached 0.8 miles/h. The incline was increased by 2.5% every 3 min, to a maximum of 20%. The speed and incline were then kept constant (0.8 miles/h and 20%) until the mice reached exhaustion.
In vivo insulin administration.
To elicit a maximal insulin response, mice received an intraperitoneal injection of 1 unit of recombinant human insulin (Humulin R, HI 210, Lilly) and controls received saline. After 15 min, mice were euthanized by cervical dislocation, and muscles were immediately dissected and snap-frozen in liquid nitrogen.
In vivo glucose uptake.
After a 5-h fast, mice were anesthetized with pentobarbital sodium (90 mg/kg of body wt). To measure insulin-stimulated glucose uptake, saline (control), or a 20% glucose bolus (1.0 g of glucose/kg of body wt), along with 2-[3H]deoxyglucose was administered via the retro-orbital sinus. Subsequently, the animals were euthanized, and tissue glucose uptake was measured in tibialis anterior (TA) and soleus muscles as previously described (18).
Fatty acid oxidation.
Soleus muscles were removed and placed in Krebs-Ringer bicarbonate (KRB) solution containing 4% fatty acid-free BSA, 500 μmol/l albumin-bound palmitate, and 5 μCi albumin-bound [1-14C]palmitate (PerkinElmer) for 60 min. For contraction, soleus muscles were electrically stimulated to contract for 10 min (Grass S88 stimulator settings: train rate = 1/min; train duration = 10 s; pulse rate = 100 pulses/s; duration = 0.1 ms; volts = 100 V). To liberate and collect 14CO2, KRB solution was added to a sealed flask containing an equal volume of 1 mol/l acetic acid. The released 14CO2 was trapped by an insert containing a strip of filter paper saturated with 500 μl hyamine and quantified using liquid scintillation counting.
Glucose and insulin tolerance tests.
For glucose tolerance tests (GTT), animals were fasted for 12 h from 22:00 to 10:00. WT and TRB3-TG mice were administered a bolus of glucose (2.0 g/kg body wt) by intraperitoneal injection. Blood samples were collected from the tail of fully conscious mice before glucose administration (0 min) and 20, 40, 60, and 120 min after injection. For insulin tolerance tests (ITT), mice were injected with intraperitoneal insulin (1 U/kg body wt, Humulin, Eli Lilly). Blood samples were collected from the tail of fully conscious mice before insulin injection and 20, 40, and 60 min after injection. Blood glucose was determined using a OneTouch Ultra-portable glucometer (LifeScan).
Myosin heavy chain separation.
Myosin heavy chain isoforms were separated as previously described (27). Briefly, lysates (1 μg) were separated on polyacrylamide gels. Gels were silver stained with the SilverSNAP Stain Kit II (Pierce, 24612). Myosin heavy chain bands were quantitated from images of scanned gels using the 1D-Multifunction of AlphaEase FC software.
Protein extraction, immunoprecipitation, and immunoblotting.
Frozen muscles were homogenized with a Polytron (Brinkman Instruments) in lysis buffer and centrifuged, and protein concentrations were determined. Lysates (40 μg protein) were separated by SDS-PAGE and probed for TRB3 (from Dr. Marc Montminy, San Diego, CA), PPAR-α (Abcam), p-IRS-T612 (CST), p-Akt-T308 (CST), fatty acid transport protein 1 (FATP1, Santa Cruz), glucose transporter type 4 (GLUT4, Millipore), and uncoupling protein 3 (UCP3, Abcam). For immunoprecipitation experiments, Flag-tagged TRB3 was isolated using anti-Flag beads (Sigma, St. Louis, MO). Bead-antibody-protein complexes were washed once with lysis buffer, twice with lysis buffer + 500 mmol/l NaCl, and once with lysis buffer. The supernatants were aspirated and pellets were incubated with 6 μl of 1 μg/μl BSA before elution. Proteins were eluted from anti-Flag beads by adding Laemmli buffer and heating for 5 min at 95°C.
Cell culture and cDNA transfection.
HEK293 cells were maintained in DMEM containing 20% fetal bovine serum. To overexpress TRB3 and PPAR-α, cells were transfected with 2 μg of TRB3 and PPAR-α cDNAs using Lipofectamine 2000. After 48 h, cells were harvested and mRNA or proteins were extracted. In some experiments, transfected cells were incubated with proteasome inhibitor MG132 (5 μM) overnight before harvesting.
RNA isolation and quantitative real-time PCR.
Total RNA was extracted from muscle by a kit from Zymo Research and RNA was converted to cDNA per manufacturer's instructions (Applied Biosystems). Primer sequences used for quantitative real-time PCR are listed in Table 1.
Table 1.
List of primers
| Gene Names | Primer Sequences |
|---|---|
| TRB3 | Fwd, CTGCGTCGCTTTGTCTTCAGCA |
| Rev, CTGAGTATCTCTGGTCCCACGT | |
| Myh7 | Fwd, GCTGGAAGATGAGTGCTCAGAG |
| Rev, TCCAAACCAGCCATCTCCTCTG | |
| Myh7b | Fwd, GGTGTTACACCAACTACGCTGC |
| Rev, TCTGCTGTCCACAAAGGTGTCG | |
| miR208b | ATAAGACGAACAAAAGGTTTGT |
| miR499 | TTAAGACTTGCAGTGATGTTT |
See text for definitions.
Citrate synthase activity.
Citrate synthase activity was determined in muscle lysates spectrophotometrically as previously described (25). Briefly, lysates were incubated with substrates and cofactors (80 mmol/l Tris·HCl, 0.1 mmol/l 5,5′-dithiobis-2-nitrobenzoate, 0.4 mmol/l acetyl-CoA, and 0.6 mmol/l oxaloacetate) at room temperature to detect the transfer of sulfhydryl groups to 5,5′-dithiobis-2-nitrobenzoate.
Glycogen measurements.
Muscle glycogen content was measured as described previously (18). Briefly, muscles were hydrolyzed in 2.0 N HCl at 95°C for 2 h. Samples were neutralized with 2.0 N NaOH and then centrifuged at 13,000 g. Muscle glucose levels were assessed using hexokinase reagent (Sigma).
Statistical analysis.
Data are expressed as the means ± SE. Means were compared by one-way analysis of variance (ANOVA) or two-way ANOVA. When analysis of variance revealed significant differences, Tukey's post hoc test for multiple comparisons was performed. P values <0.05 were considered statistically significant.
RESULTS
Exercise training increases TRB3 expression in muscle.
Physical exercise improves glucose homeostasis through multiple mechanisms, including increased insulin sensitivity in skeletal muscle. Recent studies suggest that overexpression of TRB3 in cultured skeletal muscle (C2C12) cells impaired insulin signal transduction (14, 15). Therefore, given the role for exercise to improve skeletal muscle insulin sensitivity and the potential for TRB3 to impair insulin sensitivity in cultured cells, we hypothesized that exercise training would decrease TRB3 expression in skeletal muscle. Contrary to this hypothesis, TRB3 mRNA was increased by 60% and TRB3 protein was increased by 150% in response to 4 wk of voluntary wheel running (average distance of 6.6 ± 0.4 km/day) in C57BL/6 mice (Fig. 1). This robust increase in TRB3 expression with exercise training indicates that TRB3 may play a role in the adaptation of skeletal muscle to exercise.
Fig. 1.
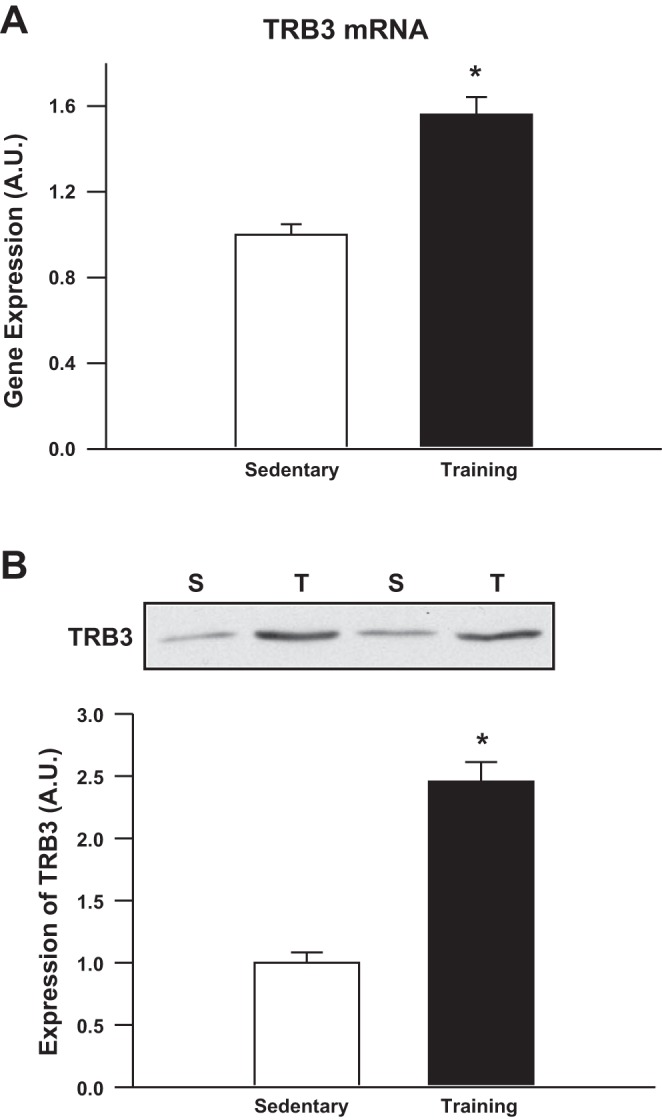
Exercise training increases tribbles homolog 3 (TRB3) mRNA and protein expression. C57BL/6 mice (Charles River Laboratories, 10 wk old) were housed in wheel cages for 4 wk (Training; T), and sedentary (S) mice were housed in separate cages without a wheel. Mice were euthanized and triceps muscles were snap frozen in liquid nitrogen. RNA and protein were extracted and TRB3 mRNA (A) and protein (B) were determined. Data are means ± SE, n = 9 mice/group. *P < 0.05 compared with sedentary mice.
Muscle-specific TRB3 TG mice.
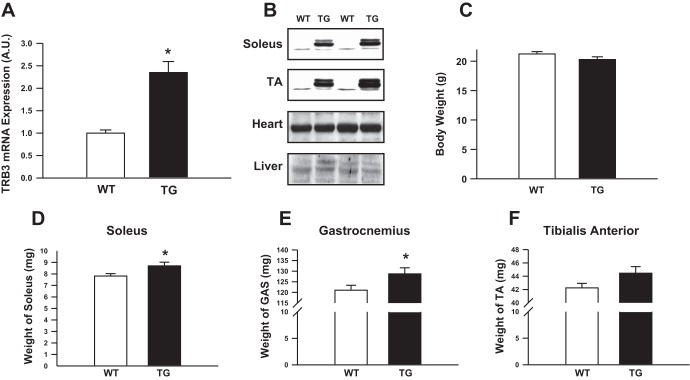
To determine the role of TRB3 in muscle function and metabolism, we studied muscle-specific TRB3 TG mice that were generated using the Smactin promoter. TRB3 mRNA expression was determined in TA muscles (Fig. 2A). We confirmed that TRB3 was overexpressed in the muscle but not in the heart or liver of TRB3 muscle TG mice (Fig. 2B). TRB3 TG mice had similar body weights compared with WT littermates (Fig. 2C). However, the weights of the soleus (Fig. 2D) and gastrocnemius (Fig. 2E) muscles were significantly higher in TRB3 TG animals and tended to be higher in TA muscle (Fig. 2F), demonstrating that TRB3 can regulate skeletal muscle mass.
Fig. 2.
Characterization of muscle-specific TRB3 transgenic (TG) mice. Wild-type (WT) and TRB3 TG mice (8 wk old) were euthanized and tissues were harvested. TRB3 mRNA expression was determined in tibialis anterior (TA) muscle (A) and TRB3 protein expression determined in the soleus and TA muscles, heart, and liver (B). TRB3 TG mice had similar body weights (C) compared with WT littermates. Muscle weights of the soleus (D) gastrocnemius (GAS) (E), and TA (F) were measured. Data are means ± SE, n = 8 mice/group. *P < 0.05 compared with WT mice.
Overexpression of TRB3 does not impair insulin signaling or glucose uptake in skeletal muscle.
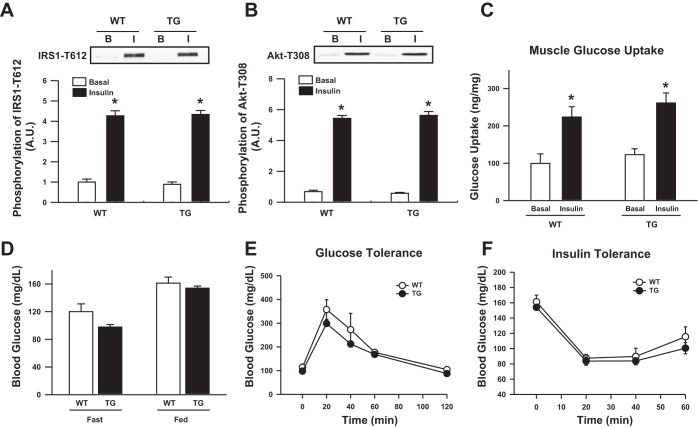
In the liver, TRB3 has been shown to bind to the insulin signaling molecule Akt, thus preventing Akt phosphorylation and contributing to insulin resistance and impaired glucose homeostasis (7). To determine the effect of TRB3 on insulin signaling in skeletal muscle, we measured insulin signal transduction in TRB3 TG mice following treatment with insulin, but found no impairment in insulin-stimulated IRS-1 or Akt activation in TRB3 TG mice (Fig. 3, A and B). Consistent with our observations of intact insulin signaling in TRB3 TG mice, we found that in vivo skeletal muscle glucose uptake in response to a glucose bolus was similar between TRB3 TG mice and WT littermates (Fig. 3C). We also observed no impairment in whole body glucose homeostasis in TRB3 TG mice, as measured by fasting blood glucose (Fig. 3D) and by GTT and ITT (Fig. 3, D and E). Thus, when considered collectively, our results demonstrate that overexpression of TRB3 in skeletal muscle does not impair insulin signal transduction or glucose homeostasis.
Fig. 3.
Effect of TRB3 overexpression on insulin signaling and glucose uptake in TA muscle. After treatment with insulin, basal (B) and insulin-stimulated (I) phosphorylation of IRS1-T612 (A) and Akt-T308 (B) were measured by Western blotting. In vivo skeletal muscle 2-[3H]deoxyglucose uptake in response to a glucose bolus was similar between TRB3 TG mice and WT littermates (C). Whole body glucose homeostasis was measured by fasting blood glucose (D) and by performing glucose- and insulin-tolerance tests (E and F). *P < 0.05 vs. basal conditions.
TRB3 TG mice have increased exercise capacity.
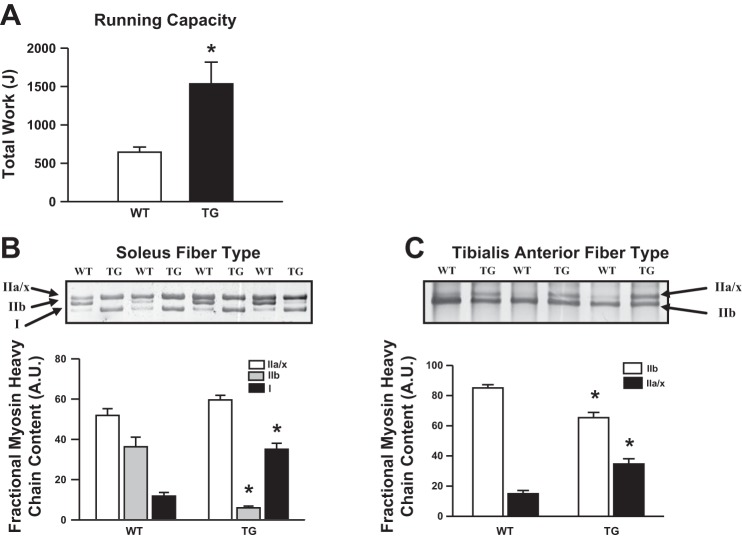
From our observation that TRB3 expression is increased by exercise training in skeletal muscle (Fig. 1), we determined if overexpression of TRB3 alters exercise capacity using an incremental treadmill running test. TRB3 TG mice had a dramatically higher exercise capacity compared with WT littermates (TG: 1,535 ± 283; WT: 644 ± 67 joules) (Fig. 4A). These data suggest that TRB3 mediates a positive change in muscle phenotype that contributes to enhanced endurance exercise capacity.
Fig. 4.
TRB3 TG mice have increased exercise capacity, and muscles from TRB3 TG mice exhibit a transformation toward oxidative fiber type. Maximal exercise capacity was determined by running female WT and TRB3 TG mice on a treadmill until the mice reached exhaustion (A). WT and TRB3 TG mice (8 wk old) were euthanized, and soleus and TA muscle were harvested. Protein lysates were prepared from muscles and myosin heavy chain isoforms were separated. Gels were silver-stained with the SilverSNAP Stain Kit II (Pierce, 24612) and myosin heavy chain bands from the soleus (B) and TA (C) muscles were quantified from images of scanned gels using the 1D Multifunction of AlphaEase FC software. Data are means ± SE, n = 8 mice/group. *P < 0.05 compared with WT mice.
TRB3 TG mice have increased oxidative muscle fibers.
One aspect of muscle phenotype that makes a significant contribution to exercise capacity is skeletal muscle fiber type. Endurance training, such as running, induces a transformation of glycolytic (type IIb) muscle fibers into more oxidative fibers (type IIa and type I) (9). Oxidative muscle fibers are more resistant to fatigue and therefore contribute to improved endurance exercise capacity. Furthermore, individuals with higher type I fiber content have a reduced risk for the development of metabolic syndrome and diabetes (13). Fiber typing by electrophoretic separation of myosin heavy chain isoforms showed a pronounced shift from type IIb to type I fibers in soleus muscle (Fig. 4B), and in the TA muscle, there was a pronounced shift from type IIb to type IIa/x fibers (Fig. 4C). As type I and type IIa/x are fatigue-resistant fiber types compared with type IIb, our data suggest that the muscle fiber-type switch observed in TRB3 TG mice contributes to improved exercise capacity. Interestingly, 4 wk of exercise training by wheel running of TRB3 TG mice did not further increase the oxidative phenotype of the fibers (data not shown).
Overexpression of TRB3 does not alter glycogen, glucose uptake and contraction-induced fatty acid oxidation, but decreases basal fatty acid oxidation.
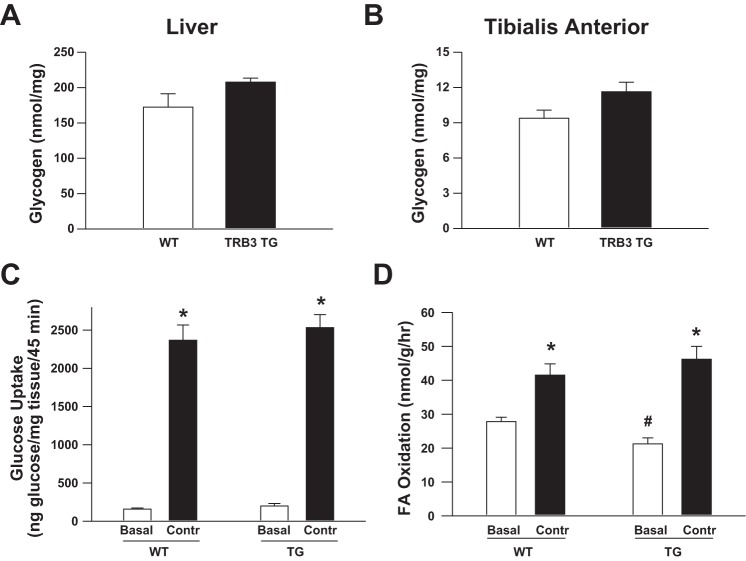
To explore the mechanism that mediates the effects of TRB3 overexpression to increase exercise capacity, we measured glycogen concentrations in the basal state and energy substrate utilization during exercise. There was a tendency for elevated liver and muscle glycogen concentrations in TRB3 TG mice; however, the differences were not statistically significant (Fig. 5, A and B). We next determined whether overexpression of TRB3 alters glucose and fatty acid utilization in muscle in another cohort of mice. Overexpression of TRB3 did not alter contraction-stimulated glucose transport in TA muscle (Fig. 5C) or fatty acid oxidation in soleus muscle (Fig. 5D), although TRB3 TG muscle had decreased basal rates of fatty acid oxidation.
Fig. 5.
Overexpression of TRB3 does not alter glycogen or contraction-stimulated substrate metabolism. Liver (A) and muscle (B) glycogen concentrations were slightly but not significantly elevated in TRB3 TG mice in the basal state. Overexpression of TRB3 did not alter contraction-stimulated glucose transport in vivo (C) or fatty acid oxidation in vitro (D), although TRB3 TG muscle had decreased basal rates of fatty acid oxidation. Data are means ± SE, n = 6–8 mice/group. *P < 0.05 compared with sedentary (Basal) group. #P < 0.05 compared with WT mice.
TRB3 increases the expression of Myh7 and Myh7b and their embedded microRNAs miR208b and miR499.
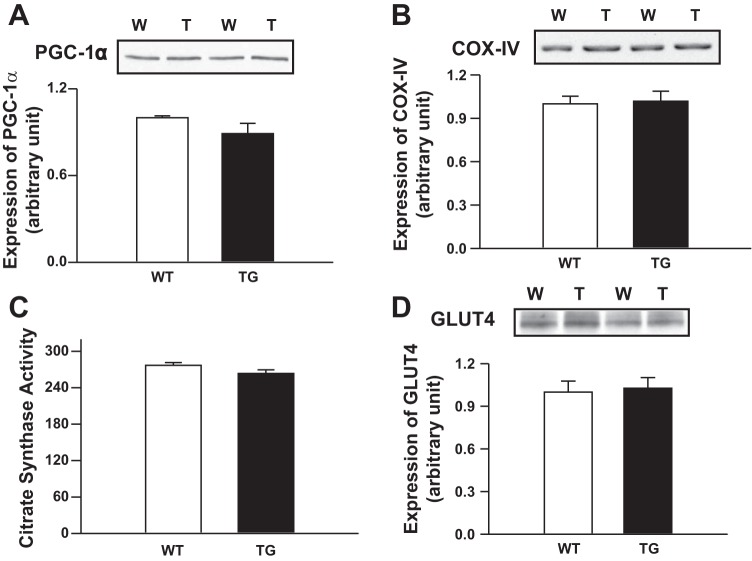
Previous studies suggest that PGC1α is a key, master regulator that controls muscle fiber type (12, 20). To determine the mechanism for the muscle fiber-type shift observed with TRB3 overexpression, we measured PGC1α expression in TRB3 TG animals. Surprisingly, the clear transformation in muscle fiber types was not associated with an increase in PGC1α expression or an increase in mitochondrial markers (e.g., citrate synthase, COX IV) and GLUT4 (Fig. 6, A–D). Thus our data suggest that a PGC1α-independent mechanism is responsible for fiber-type transformation in TRB3 TG mice. In that regard, a recent study demonstrated that two microRNAs, miR208b and miR499, which are encoded within the Myh7 and Myh7b genes, respectively, are sufficient to induce oxidative muscle fiber-type transformation while suppressing glycolytic myofiber gene programs (29). Importantly, we found that the more fatigue-resistant muscle fiber-type profile in TRB3 TG mice was associated with a twofold higher expression of miR208b and miR499 microRNAs in skeletal muscle (Fig. 7A). Moreover, expression of myosin heavy chain isoforms Myh7 and Myh7b, which encode miR208b and miR499, respectively, were also increased in TRB3 TG mice (Fig. 7B). Thus we identify increased expression of Myh7/miR208b and Myh7b/miR499 as a likely mechanism for the muscle fiber-type shift and improved exercise capacity in TRB3 TG mice.
Fig. 6.
Expression of PGC1α and COX IV, citrate synthase activity (e.g., mitochondrial markers), and glucose transporter type 4 (GLUT4) in muscle of TRB3 TG and WT animals. PGC1α expression (A), COX IV expression (B), citrate synthase activity (C), and GLUT4 (D) were determined in TA muscle of 8-wk-old female TRB3 TG and WT animals. TRB3 overexpression was not associated with an increase in PGC1α expression or an increase in COX IV and GLUT4 expression and citrate synthase activity. n = 8 mice/group.
Fig. 7.
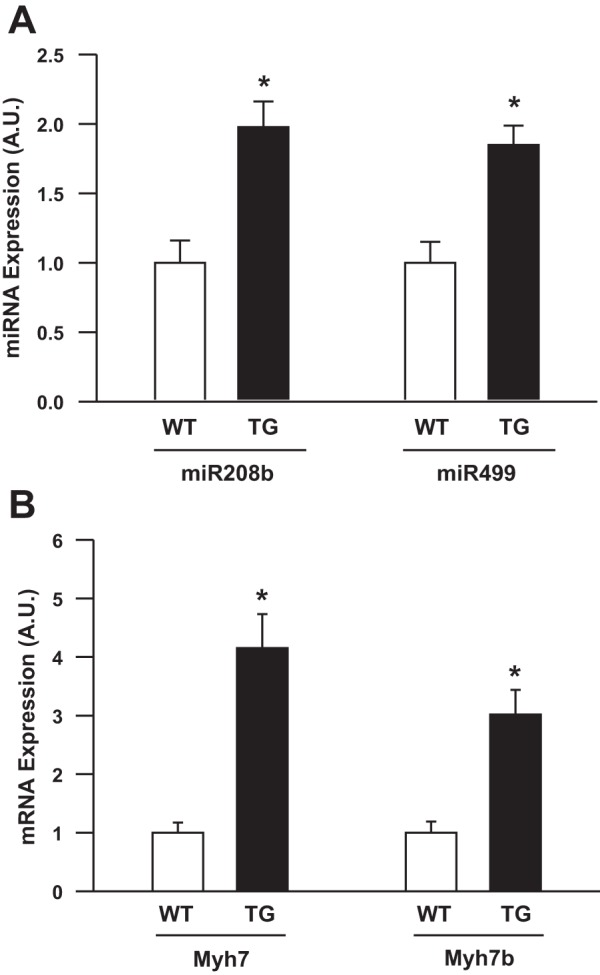
Muscles from TRB3 TG mice have increased expression of microRNAs miR208b and miR499 and their associated mRNAs Myh7 and Myh7b. RNA was isolated from gastrocnemius muscles from WT and TRB3 TG mice. cDNA was synthesized and expression of miR208b and miR499 (A) and their associated mRNAs Myh7 and Myh7b (B) were determined. Data are means ± SE, n = 6–8 mice/group. *P < 0.05 compared with WT mice.
TRB3 suppresses PPAR-α activity.
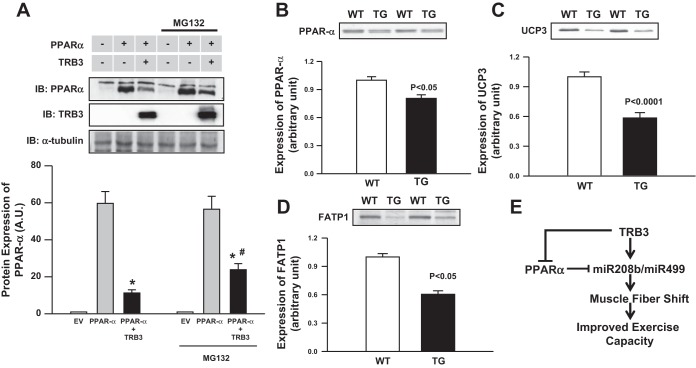
PPAR-α has recently been identified as an inhibitor of oxidative muscle fiber-type transformation via a regulatory circuit involving suppression of miR208b and miR499 expression (11). Therefore, we co-overexpressed PPAR-α and TRB3 in HEK293 cells to determine whether TRB3 can directly alter PPAR-α protein levels. Co-overexpression of TRB3 with PPAR-α decreased PPAR-α protein level by 82% compared with the expression of PPAR-α alone (Fig. 8A). TRB3-induced reduction in PPAR-α expression was partially reversed by treatment with the proteasome inhibitor MG132, suggesting TRB3 promotes PPAR-α degradation in the proteasome (Fig. 8A). To test the hypothesis that reduced PPAR-α activity is associated with elevated miR208b and miR499 and increased I/IIA fiber-type content in TRB3 TG mice, we measured the protein level of PPAR-α and its downstream targets. As hypothesized, we found that PPAR-α protein expression was 20% lower (Fig. 8B) without a change in mRNA levels (data not shown) in the skeletal muscle of TRB3 TG mice. Moreover, expression of UCP3 and FATP1 downstream targets regulated by PPAR-α were also decreased by over 40% in TRB3 TG mice (Fig. 8, C and D). Thus TRB3, through inhibiting PPAR-α, may relieve the inhibition of PPAR-α on miR208b and miR499, resulting in increased expression of these two microRNAs, and leading to fiber-type transformation and increased exercise capacity in TRB3 TG mice (Fig. 8E).
Fig. 8.
Overexpression of TRB3 decreases peroxisome proliferator-activated receptor-α (PPAR-α), fatty acid transport protein (FATP), and uncoupling protein 3 (UCP3). To determine whether TRB3 regulates PPAR-α, TRB3 and PPAR-α were overexpressed in HEK293 cells. In some experiments, transfected cells were incubated with proteasome inhibitor MG132 overnight before harvesting. A: expression of TRB3 and PPAR-α were determined by Western blotting. Protein was isolated from gastrocnemius muscles from WT and TRB3 TG mice and Western blots were performed to determine protein expression of PPA-α (B), UCP3 (C), and FATP1 (D). E: proposed mechanisms by which TRB3 regulates muscle fiber type and exercise capacity. Overexpression of TRB3 decreased PPAR-α activity and increased the expression of miR208b and miR499, inducing a transformation toward a more oxidative fiber type, which in turn, contributes to increased exercise capacity in TRB3 TG mice (E). Data are means ± SE, n = 8 mice/group for A and n = 3 separate experiments for A. *P < 0.05, PPAR-α compared with PPAR-α +TRB3, #P < 0.05 PPAR-α +TRB3 untreated compared with PPAR-α +TRB3 treated with MG132.
DISCUSSION
Although TRB3 has been extensively studied in other tissues, the role of TRB3 in the regulation of skeletal muscle metabolism and function is not fully understood. Therefore, we aimed to determine the function of TRB3 in muscle using TRB3 muscle-specific transgenic mice. Using this model, we have identified a novel role for TRB3 in the regulation of skeletal muscle fiber type and function.
Overexpression of TRB3 in skeletal muscle resulted in a dramatic shift toward a more oxidative fiber-type profile. A role for TRB3 in the regulation of muscle fiber type is supported by studies demonstrating that overexpression of TRB3 in the heart also results in increased cardiac slow β-myosin heavy chain (2). Given that oxidative muscle fibers are more resistant to fatigue, our data suggest that altered muscle fiber type is a key mechanism mediating the dramatic improvement in exercise capacity that we observed in TRB3 TG mice. An increased proportion of oxidative muscle fibers and enhanced exercise capacity are associated with a decreased risk for the development of metabolic disease (13, 24, 28). Therefore, it is possible that TRB3 overexpression in muscle has a positive effect on muscle phenotype. In support of this contention, we also found that TRB3 expression was increased by exercise training, an intervention that is well known for its positive effects on skeletal muscle and whole body metabolic health.
Previous studies suggest that PGC1α is a major regulator of muscle fiber type, with overexpression of PGC1α being sufficient to drive formation of slow twitch type I muscle fibers (20). In contrast, PGC1α depletion in skeletal muscle induced a shift from oxidative (type I and IIa) toward glycolytic (type IIb/x) muscle fibers and reduced exercise capacity (12). We observed no change in PGC1α content in TRB3 TG mice, suggesting that TRB3-induced muscle fiber-type transformations occurred through a PGC1α-independent mechanism. Instead, we identify a role for microRNAs miR208b and miR499 in the I/IIA fiber-type shift observed in TRB3 TG mice. miR208b and miR499 have been previously shown to inhibit the expression of fast/glycolytic fiber type genes, while concomitantly increasing the expression of slow fiber type genes, resulting in enhanced slow fiber gene expression (29). Indeed, miR208b−/− and miR499−/− double knockout mice display a substantial loss of type I myofibers in the soleus muscle and an increase in the expression of faster type IIx and type IIb myosin isoforms (29). Conversely, forced expression of miR499 was sufficient to induce fast-twitch muscle fibers to transform into type I fibers and improve exercise capacity (29). miR208b and miR499 are coexpressed with the slow myosin heavy chain isoforms mhc7 and mhc7b, respectively, which were also elevated in the muscle of TRB3 TG mice.
The mechanism by which TRB3 regulates miR208b and miR499 expression still remains unclear. However, recent data suggest that the expression of miR208b and miR499 are negatively regulated by PPAR-α (11). Overexpression of PPAR-α leads to decreased expression of miR208b and miR499, along with a decrease in oxidative muscle fibers and impaired exercise capacity (11). Consistent with a role for PPAR-α in the regulation of miR208b/499 expression and muscle fiber type, we found that the expression of PPAR-α and its target genes FATP1 and UCP3 were reduced in TRB3 TG mice. Furthermore, we determined that co-overexpression of TRB3 with PPAR-α in HEK293 cells decreased PPAR-α protein levels; an effect that was partially reversed by the proteasome inhibitor MG132. Thus it is possible that TRB3 promotes PPAR-α degradation via the ubiquitin proteasome system. Indeed, previous studies have demonstrated that TRB3 regulates acetyl-CoA carboxylase protein levels by promoting its ubiquitination through an association with the E3 ubiquitin ligase Constitutive Photomorphogenic Protein 1 (14). TRB3 is known to inhibit the transcriptional activity of PPAR-γ, presenting the possibility that TRB3 may also regulate the activity of PPAR-α (26). Future studies should determine the effect of TRB3 on PPAR-α ubiquitination and activity.
Previous studies have shown that oxygen consumption can be higher in muscles composed of primarily slow twitch muscle fibers; therefore, it is possible that TRB3 TG mice have higher maximal oxygen consumption and this would contribute to an increased exercise capacity. Another possible mechanism that may contribute to improved exercise capacity in the TRB3 TG mice is increased running economy. Running performance and economy are highly correlated even with comparable oxygen consumption (5). In line with this concept, we found that muscles from TRB3 TG mice had a greater than 40% reduction in UCP3 expression, likely due to decreased PPAR-α. In UCP3 knockout muscle, ATP production was increased by fourfold without a change in tricarboxylic acid cycle flux rate (4). Thus it is possible that overexpression of TRB3 lowers UCP3 in muscle through its inhibition of PPAR-α, resulting in more efficient ATP production without a change in total oxygen consumption.
Several previous studies have identified TRB3 as a negative regulator of metabolism. TRB3 can bind to Akt in liver, pancreatic β-cells, and cardiomyocytes, resulting in impaired insulin action (2, 7, 15, 19). Acute overexpression of TRB3 can impair insulin signaling in muscle (16) and liver cells (8), and TRB3 whole body knockout mice are resistant to at-diet-induced insulin resistance (16). Based on these data, we hypothesized that exercise training, which improves glucose homeostasis, would decrease TRB3 expression in skeletal muscle, whereas transgenic overexpression of TRB3 in skeletal muscle would have a negative impact on muscle metabolism. However, we found that exercise training significantly increases TRB3 protein expression. In addition, insulin signaling, muscle glucose uptake, and whole body glucose homeostasis were intact in the TRB3-overexpressing mice. The reason for this seemingly paradoxical role for TRB3 in skeletal muscle is not fully understood. Although transient overexpression of TRB3 in C2C12 myotubes can inhibit insulin signaling (14, 15), it is possible that chronic expression of TRB3 throughout development in TRB3 TG mice results in compensatory mechanisms to maintain insulin action. It is also possible that TRB3 is not a critical mediator of insulin action under nonstressed, chow-fed diet conditions. Interestingly, both TRB3 overexpressing TG mice and TRB3 knockout mice have normal metabolism when fed a chow diet (23). In future studies it will be important to determine the effects of TRB3 overexpression on metabolism under stressed conditions such as high-fat feeding. Nevertheless, the current study shows that TRB3 overexpression causes major changes in muscle fiber type phenotype, and in this regard is consistent with data showing that overexpression of TRB3 increases β-MHC in the heart (3). In addition, TRB3 was recently shown to play a key role in left-right axis patterning in the heart as a component of TGF-signaling during embryonic development (1). When considered collectively, the results from our study and previous investigations suggest that TRB3 has multiple, divergent functions in skeletal muscle.
Perspectives and Significance
Overexpression of TRB3 in skeletal muscle decreased PPAR-α activity and increased the expression of miR208b and miR499, inducing a transformation toward a more fatigue-resistant fiber type. Furthermore, we identify a role for TRB3 in the regulation of muscle phenotype in response to exercise, as exercise training induced a robust increase in TRB3 expression and TRB3 TG animals had greatly improved exercise capacity. Our study for the first time showed that TRB3 plays an important role in regulating skeletal muscle phenotype, revealing a novel role for this complex protein.
GRANTS
This work was supported by funding from the National Institutes of Health Grants R01 DK101043 and AR42238 (L. J. Goodyear) and Diabetes Research Center Grant P30 DK36836 (Joslin Diabetes Center). M.-Y. Lee was supported by an American Diabetes Association Mentor-Based Award (Grant 7-12-MN-22) to L. J. Goodyear. S. J. Lessard was supported by postdoctoral fellowships from the American Physiological Society (Physiological Genomics) and the Canadian Diabetes Association.
DISCLOSURES
No conflicts of interest, financial or otherwise, are declared by the author(s).
AUTHOR CONTRIBUTIONS
Author contributions: D.A., L.Q., M.F.H., and L.J.G. conceived and designed the studies; D.A., S.J.L., T.T., M.-Y.L., H.-J.K., L.Q., and M.F.H. performed experiments; D.A., S.J.L., T.T., M.-Y.L., and H.-J.K. analyzed data; D.A. and L.J.G. interpreted results of experiments; D.A. prepared figures; D.A., S.J.L., and L.J.G. drafted manuscript; D.A., S.J.L., M.F.H., and L.J.G. edited and revised manuscript; D.A., S.J.L., and L.J.G. approved final version of manuscript.
ACKNOWLEDGMENTS
We thank Dr. Marc Montminy (Salk Institute) for the donation of the TRB3 transgenic mice and TRB3 antibody. We thank Allen Clermont in the Animal Physiology Core at Joslin Diabetes Center for performing DEXA Scans.
Current address for L. Qi: Cornell University, Department of Human Ecology, Division of Nutritional Sciences, Ithaca, NY.
REFERENCES
- 1.Anuppalle M, Maddirevula S, Huh TL, Rhee M. Trb3 regulates LR axis formation in zebrafish embryos. Mol Cells 36: 542–547, 2013 [DOI] [PMC free article] [PubMed] [Google Scholar]
- 2.Avery J, Etzion S, DeBosch BJ, Jin X, Lupu TS, Beitinjaneh B, Grand J, Kovacs A, Sambandam N, Muslin AJ. TRB3 function in cardiac endoplasmic reticulum stress. Circ Res 106: 1516–1523, 2010 [DOI] [PMC free article] [PubMed] [Google Scholar]
- 3.Avery J, Etzion S, DeBosch BJ, Jin X, Lupu TS, Beitinjaneh B, Grand J, Kovacs A, Sambandam N, Muslin AJ. TRB3 function in cardiac endoplasmic reticulum stress. Circ Res 106: 1516–1523, 2010 [DOI] [PMC free article] [PubMed] [Google Scholar]
- 4.Cline GW, Vidal-Puig AJ, Dufour S, Cadman KS, Lowell BB, Shulman GI. In vivo effects of uncoupling protein-3 gene disruption on mitochondrial energy metabolism. J Biol Chem 276: 20240–20244, 2001 [DOI] [PubMed] [Google Scholar]
- 5.Conley DL, Krahenbuhl GS. Running economy and distance running performance of highly trained athletes. Med Sci Sports Exerc 12: 357–360, 1980 [PubMed] [Google Scholar]
- 6.Du K, Ding J. Insulin regulates TRB3 and other stress-responsive gene expression through induction of C/EBPbeta. Mol Endocrinol 23: 475–485, 2009 [DOI] [PMC free article] [PubMed] [Google Scholar]
- 7.Du K, Herzig S, Kulkarni RN, Montminy M. TRB3: a tribbles homolog that inhibits Akt/PKB activation by insulin in liver. Science 300: 1574–1577, 2003 [DOI] [PubMed] [Google Scholar]
- 8.Du K, Herzig S, Kulkarni RN, Montminy M. TRB3: a tribbles homolog that inhibits Akt/PKB activation by insulin in liver. Science 300: 1574–1577, 2003 [DOI] [PubMed] [Google Scholar]
- 9.Fitts RH, Widrick JJ. Muscle mechanics: adaptations with exercise-training. Exerc Sport Sci Rev 24: 427–73: 427–473, 1996 [PubMed] [Google Scholar]
- 10.Fujii N, Seifert MM, Kane EM, Peter LE, Ho RC, Winstead S, Hirshman MF, Goodyear LJ. Role of AMP-activated protein kinase in exercise capacity, whole body glucose homeostasis, and glucose transport in skeletal muscle: insight from analysis of a transgenic mouse model. Diabetes Res Clin Pract 77, Suppl 1: S92–S98, 2007 [DOI] [PubMed] [Google Scholar]
- 11.Gan Z, Rumsey J, Hazen BC, Lai L, Leone TC, Vega RB, Xie H, Conley KE, Auwerx J, Smith SR, Olson EN, Kralli A, Kelly DP. Nuclear receptor/microRNA circuitry links muscle fiber type to energy metabolism. J Clin Invest 123: 2564–2575, 2013 [DOI] [PMC free article] [PubMed] [Google Scholar]
- 12.Handschin C, Chin S, Li P, Liu F, Maratos-Flier E, LeBrasseur NK, Yan Z, Spiegelman BM. Skeletal muscle fiber-type switching, exercise intolerance, and myopathy in PGC-1alpha muscle-specific knock-out animals. J Biol Chem 282: 30014–30021, 2007 [DOI] [PubMed] [Google Scholar]
- 13.Hernandez N, Torres SH, Vera O, De Sanctis JB, Flores E. Muscle fiber composition and capillarization in relation to metabolic alterations in hypertensive men. J Med 32: 67–82, 2001 [PubMed] [Google Scholar]
- 14.Kato S, Du K. TRB3 modulates C2C12 differentiation by interfering with Akt activation. Biochem Biophys Res Commun 353: 933–938, 2007 [DOI] [PubMed] [Google Scholar]
- 15.Koh HJ, Arnolds DE, Fujii N, Tran TT, Rogers MJ, Jessen N, Li Y, Liew CW, Ho RC, Hirshman MF, Kulkarni RN, Kahn CR, Goodyear LJ. Skeletal muscle-selective knockout of LKB1 increases insulin sensitivity, improves glucose homeostasis, and decreases TRB3. Mol Cell Biol 26: 8217–8227, 2006 [DOI] [PMC free article] [PubMed] [Google Scholar]
- 16.Koh HJ, Toyoda T, Didesch MM, Lee MY, Sleeman MW, Kulkarni RN, Musi N, Hirshman MF, Goodyear LJ. Tribbles 3 mediates endoplasmic reticulum stress-induced insulin resistance in skeletal muscle (Abstract). Nat Commun 4: 1871, 2013 [DOI] [PMC free article] [PubMed] [Google Scholar]
- 17.Koo SH, Satoh H, Herzig S, Lee CH, Hedrick S, Kulkarni R, Evans RM, Olefsky J, Montminy M. PGC-1 promotes insulin resistance in liver through PPAR-alpha-dependent induction of TRB-3. Nat Med 10: 530–534, 2004 [DOI] [PubMed] [Google Scholar]
- 18.Kramer HF, Witczak CA, Taylor EB, Fujii N, Hirshman MF, Goodyear LJ. AS160 regulates insulin- and contraction-stimulated glucose uptake in mouse skeletal muscle. J Biol Chem 281: 31478–31485, 2006 [DOI] [PubMed] [Google Scholar]
- 19.Liew CW, Bochenski J, Kawamori D, Hu J, Leech CA, Wanic K, Malecki M, Warram JH, Qi L, Krolewski AS, Kulkarni RN. The pseudokinase tribbles homolog 3 interacts with ATF4 to negatively regulate insulin exocytosis in human and mouse beta cells. J Clin Invest 120: 2876–2888, 2010 [DOI] [PMC free article] [PubMed] [Google Scholar]
- 20.Lin J, Wu H, Tarr PT, Zhang CY, Wu Z, Boss O, Michael LF, Puigserver P, Isotani E, Olson EN, Lowell BB, Bassel-Duby R, Spiegelman BM. Transcriptional co-activator PGC-1 alpha drives the formation of slow-twitch muscle fibres. Nature 418: 797–801, 2002 [DOI] [PubMed] [Google Scholar]
- 21.Marinho R, Ropelle ER, Cintra DE, De Souza CT, Da Silva AS, Bertoli FC, Colantonio E, D'Almeida V, Pauli JR. Endurance exercise training increases APPL1 expression and improves insulin signaling in the hepatic tissue of diet-induced obese mice, independently of weight loss. J Cell Physiol 227: 2917–2926, 2012 [DOI] [PubMed] [Google Scholar]
- 22.Ohoka N, Yoshii S, Hattori T, Onozaki K, Hayashi H. TRB3, a novel ER stress-inducible gene, is induced via ATF4-CHOP pathway and is involved in cell death. EMBO J 24: 1243–1255, 2005 [DOI] [PMC free article] [PubMed] [Google Scholar]
- 23.Okamoto H, Latres E, Liu R, Thabet K, Murphy A, Valenzeula D, Yancopoulos GD, Stitt TN, Glass DJ, Sleeman MW. Genetic deletion of Trb3, the mammalian Drosophila tribbles homolog, displays normal hepatic insulin signaling and glucose homeostasis. Diabetes 56: 1350–1356, 2007 [DOI] [PubMed] [Google Scholar]
- 24.Spies C, Otte C, Kanaya A, Pipkin SS, Schiller NB, Whooley MA. Association of metabolic syndrome with exercise capacity and heart rate recovery in patients with coronary heart disease in the heart and soul study. Am J Cardiol 95: 1175–1179, 2005 [DOI] [PMC free article] [PubMed] [Google Scholar]
- 25.Srere PA. [1]Citrate synthase: [EC 41.3.7. Citrate oxaloacetate-lyase (CoA-acetylating)]. In: Methods in Enzymology. Citric Acid Cycle, edited by Lowenstein JM. San Diego, CA: Academic, vol. XIII, 1969, p. 3–11 [Google Scholar]
- 26.Takahashi Y, Ohoka N, Hayashi H, Sato R. TRB3 suppresses adipocyte differentiation by negatively regulating PPARgamma transcriptional activity. J Lipid Res 49: 880–892, 2008 [DOI] [PubMed] [Google Scholar]
- 27.Taylor EB, An D, Kramer HF, Yu H, Fujii NL, Roeckl KS, Bowles N, Hirshman MF, Xie J, Feener EP, Goodyear LJ. Discovery of TBC1D1 as an insulin-, AICAR-, and contraction-stimulated signaling nexus in mouse skeletal muscle. J Biol Chem 283: 9787–9796, 2008 [DOI] [PMC free article] [PubMed] [Google Scholar]
- 28.Tjonna AE, Lee SJ, Rognmo O, Stolen TO, Bye A, Haram PM, Loennechen JP, Al-Share QY, Skogvoll E, Slordahl SA, Kemi OJ, Najjar SM, Wisloff U. Aerobic interval training versus continuous moderate exercise as a treatment for the metabolic syndrome: a pilot study. Circulation 118: 346–354, 2008 [DOI] [PMC free article] [PubMed] [Google Scholar]
- 29.van Rooij E, Quiat D, Johnson BA, Sutherland LB, Qi X, Richardson JA, Kelm RJ, Jr, Olson EN. A family of microRNAs encoded by myosin genes governs myosin expression and muscle performance. Dev Cell 17: 662–673, 2009 [DOI] [PMC free article] [PubMed] [Google Scholar]


