Abstract
Loneliness is a common condition in elderly associated with severe health consequences including increased mortality, decreased cognitive function, and poor quality of life. Identifying and assisting lonely individuals is therefore increasingly important—especially in the home setting—as the very nature of loneliness often makes it difficult to detect by traditional methods. One critical component in assessing loneliness unobtrusively is to measure time spent out-of-home, as loneliness often presents with decreased physical activity, decreased motor functioning, and a decline in activities of daily living, all of which may cause decreases in the amount of time spent outside the home. Using passive and unobtrusive in-home sensing technologies, we have developed a methodology for detecting time spent out-of-home based on logistic regression. Our approach was both sensitive (0.939) and specific (0.975) in detecting time out-of-home across over 41,000 epochs of data collected from 4 subjects monitored for at least 30 days each in their own homes. In addition to linking time spent out-of-home to loneliness (r=−0.44, p=0.011) as measured by the UCLA Loneliness Index, we demonstrate its usefulness in other applications such as uncovering general behavioral patterns of elderly and exploring the link between time spent out-of-home and physical activity (r=0.415, p=0.031), as measured by the Berkman Social Disengagement Index.
Index Terms: Smart homes, loneliness, outings, logistic regression, physical activity
INTRODUCTION
Loneliness, or perceived social isolation, is a common condition that is particularly prevalent in elderly where retirement, the death of friends, and the subtle decline in health pose challenges to forming and maintaining friendships. Indeed, nearly 20% of seniors self report as occasionally lonely [1], while 5–15% of elders report frequent loneliness [2]. In this population, loneliness is particularly problematic since it predicts morbidity and mortality [3–5], causes decreased cognitive functioning [6], impairs sleep quality leading to daytime dysfunction [7, 8], decreases mobility which increases risk of falls [9, 10], and reduces quality of life. For these reasons, detection and mitigation of loneliness is critical, as the deleterious effects of loneliness can be reversed with an appropriate intervention [11]. However, physicians currently do not assess loneliness in the clinical setting and many of the aforementioned correlates of loneliness can cause lonely people to go unnoticed by people and programs attempting to reach out to them, making detection of lonely individuals difficult.
Smart homes, which have the ability to continuously and unobtrusively monitor inhabitants [12–14], present an ideal means to monitor and detect loneliness at the earliest phases. While multiple approaches to smart home technology exist [15–18], memory problems and privacy concerns in the elderly hamper the efficacy of devices worn on the body and cameras in the home. For this reason, our research focuses on unobtrusive and passive sensing of loneliness based on data from motion sensors, contact sensors, computer sensors, and phone sensors. Using this array of sensors, we are developing methods to monitor the covariates of loneliness—for example, sleep quality [19], frequency of visitor contact [20], total activity [21], and time out-of-home—with the goal of developing a robust model of loneliness that can be employed to continuously and unobtrusively detect loneliness in the home. Such a platform would allow lonely individuals to receive much needed help prior to experiencing a host of negative health effects.
The focus of this paper is on using passive sensors for objectively and unobtrusively detecting time spent out-of-home, a critical component of loneliness. This is in large part because loneliness often presents with a decline in physical activity [22], decreased motor function [9], and increased risk of depression [23], all of which are associated with more time spent in the home. Loneliness is also associated with sleep disruptions and daytime dysfunction [7]. Daytime dysfunction may not only increase time spent inside the home, but also reduce activity while in the home. For this reason, accurately detecting when an individual leaves the home will allow us to control for time out-of-home when estimating daytime dysfunction.
While our primary focus is on characterization of loneliness, measuring time out-of-home is also important for other applications. For example, fewer outings has been linked to decreased cognitive functioning, suggesting its importance for detecting cognitive decline [24]. More generally, measuring time spent out-of-home across a large number of individuals allows investigation into general behavioral patterns such as how elderly spend their time during the day, what the regularity of these patterns is over the course of the day, and what sort of changes exist between weekday and weekend out-of-home profiles. In fact, as we suggest below, larger variability in out-of-home profiles may allow detection of individuals at higher risk of loneliness.
Taken together, these applications support the need for an accurate, objective and unobtrusive method for detecting time out-of-home, especially in elderly populations. In the following we describe and validate a method for detecting time spent out-of-home using a logistic regression based classifier with inputs derived from passive senor data. After describing the sensor data collection and video ground truth, we discuss the rationale for incorporating different inputs into the classifier followed by a performance assessment. We follow by showing several applications of our methodology to loneliness and physical activity, and conclude with a summary of the contributions of this work.
METHODS
In this section, we describe the data collection, the model development and experimental validation.
A. Data Collection
The data used in this study were collected from the homes of the Intelligent Systems for Assessing Aging Changes (ISAAC) cohort [25] and the ORCATECH Living Lab. These two cohorts currently comprise around 150 seniors living independently in the Portland community who have been monitored for the past 3–5 years. A core set of technologies is continually maintained in all homes, including pyroelectric motion sensors (MS16A, x10.com) in each room and contact sensors (DA10A, x10.com) on the refrigerator and doors to the home.
To collect ground truth data, motion activated video cameras (Logitech C600) were installed over the door in the homes of four different subjects. This allowed us to capture when residents entered and exited the home while minimizing privacy issues by only recording video for 5 seconds when motion was detected. At installation, we verified that the field of view of the camera was appropriately positioned to detect when people passed through the door. Each individual video file was first labeled with a home identifier and time stamp and then automatically uploaded to our data server. Using these data, outings from the home were hand-annotated. An outing was defined as any period where the resident left the home and closed the door behind them, leaving nobody else in the house. Thirty days of valid video data were collected from each home.
While the cameras collected data, data from motion sensors in each room of the home as well as contact sensors on the doors of the home were simultaneously collected. The infrared motion sensors function by firing a signal each time movement is detected, with a refractory period after firing of about 6 seconds. The contact sensors are magnetic, and fire a different signal when the two magnets are together (the door is closed) than when they are apart (the door is open). These contact data also have heartbeats: if no event occurs within about an hour, the contact sensor emits a signal corresponding to whatever state it is in at present. To remove heartbeats, consecutive data points with the same signal were removed from the data stream.
B. Feature Selection
To derive the features used in the model development, the sensor data from each home was first divided into 5 minute epochs. Because most out-of-home events last at least 30 minutes, this window size was small enough to capture the outing events with high sensitivity, while remaining large enough facilitate data processing and analysis. For each epoch, thirteen features were calculated—five initial features and the forward and backward lags from four of them—and used in the model development.
The first feature included in the model corresponds to the number of sensor firings during each five minute interval. Because the motion sensors in the home are event driven, the number of sensor firings should be very low or zero when nobody is present in the home. On the other hand, the number of sensor firings should increase when someone is present in the home provided they are moving about. To account for periods where the subject is both home and not moving (e.g. during naps or overnight), our second feature corresponds to whether the subject was in or out of bed, as calculated using the heuristic approach developed by Hayes et al [19].
Our next two features correspond to the firing of door sensor events and are designed to capture entry and exit events from the home. Two key observations can be made regarding the door sensor and outings from the home. First, when the subject leaves the home, the last sensor firing in the home during the departure epoch should be a door sensor. Second, when the subject arrives back home, the first sensor firing in the home during the arrival epoch should be a door sensor. In between these two events, few, if any, sensor firings should occur. However, simply looking for these events to happen consecutively is not enough as door sensor firings are noisy and can be missed. For example, if a door opening event is not recorded, the corresponding door closing event will be treated as a heartbeat and removed from the sensor stream. To create the most robust model, we therefore incorporated two separate door sensor features into the model. The first, corresponding to a leaving event, operates on the intuition that periods of inactivity following a door sensor likely correspond to out-of-home events. For this feature, we looked for periods where the door sensor was the last sensor that fired during the epoch. All epochs between this event and the next movement event, where movement is defined as at least 3 consecutive sensor firings, were labeled as ‘1’, corresponding to epochs where the person was likely out of the home. Our second door sensor feature corresponds to an arrival event, and operates on the intuition that periods of inactivity preceding a door sensor firing likely also correspond to out-of-home events. For this feature, we looked for all epochs where the door sensor was the first sensor in the epoch and labeled all epochs between this event and the previous movement event as ‘1’.
The final feature included in the model simply indicates whether the last recorded sensor firing occurred in a room from which the subject could leave the house. This feature was calculated independent of the true home layout. Rather, rooms that were deemed unlikely to leave the home from without first tripping a different sensor (e.g. a bedroom) were labeled ‘0’ while those a resident may be able to directly leave the home from (e.g. the living room) were labeled ‘1’. Each epoch was then labeled according to the value of the last sensor firing. This feature was important to distinguish events where the resident arrived home and opened the door from those where the resident was in the home but not moving when someone else arrived and opened the door. Although using the home-specific layouts could provide better labeling for training purposes, this approach would not readily generalize to new homes.
In order to capture some of the time-series nature of outings from the home, forward and backward lags of one epoch for each feature except the bed feature were also used in the classifier.
C. Model Development
We treated the problem of detecting outings as a binary classification on each epoch. Multiple methods to classify binary data exist (support vector machines, neural networks, logistic regression, etc.), each with its own advantages and disadvantages. However, the focus of this paper is not to compare the different classification techniques, but rather to demonstrate that the features described can be used to separate out-of-home epochs from in-home epochs with high sensitivity and specificity. Because of the ease of interpretability of the results, we chose to use logistic regression, a well-known technique often used for binary classification [26], to classify the data. Logistic regression is based on the assumption that the “log-odds” of the outcome is linear in the parameters. From this assumption, the conditional probability follows a logistic distribution given by
| (1) |
where yi is a binary indicator variable corresponding to ‘1’ if nobody is in the home during epoch i (the participant is out-of-home) and ‘0’ otherwise, xi is the feature vector for epoch i, and, β represents the vector of model parameters which can be estimated using maximum likelihood.
To optimize model performance and applicability, we trained on the same number of out-of-home events as in-home events. This resulted in training on ¼ of the in-home epochs (7745 of 30,980 epochs), and ¾ of the out-of-home epochs (7678 of 10,198 epochs). We tested on all the remaining data. For all model fits, we used 1000 fold repeated random sub-sampling to determine mean out-of-sample performance, parameter estimates, and 95% confidence intervals for sensitivity and specificity with a decision threshold of 0.5 (that is, samples with a probability greater than 0.5 were classified as ‘out-of-home’, and those with a probability less than 0.5 were classified as ‘in-home’).
Initially, the logistic regression model was trained using all the data and all the features discussed above. Parameter estimates and 95% confidence intervals for each feature were calculated using these data. All features with parameter estimates whose 95% confidence intervals included zero were removed from the model, and the model was refit using the reduced feature set. This process was continued until all included features proved significant. Through this process, four features were removed: the forward and backward lags of the number of sensor firings, the backward lag of the first door sensor, and the forward lag of the last door sensor. All other features were significant. The results of the model with the final feature set are presented below.
RESULTS
The logistic regression based classifier performed well with a sensitivity of 0.939 (95% CI: 0.931, 0.947) and specificity of 0.975 (95% CI: 0.973, 0.977). This high performance can also be visualized in the ROC curve shown in fig. 1. The ideal threshold for classifying this data is likely 0.51. After this point, a small increase in sensitivity causes large drops in specificity, quickly resulting in dramatic overestimation of time out-of-home.
Fig. 1.
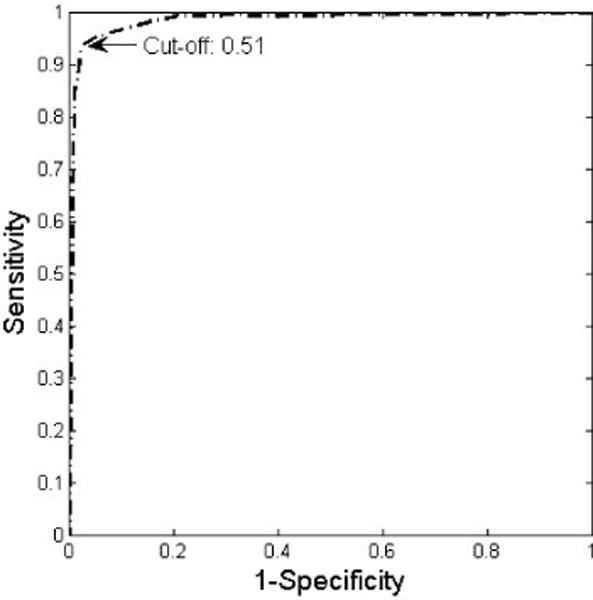
Receiver operating characteristic (ROC) curve of the model performance.
While reporting sensitivity and specificity is important, the true goal of this model is to estimate how much time an individual spends out of the home. For that reason, calculating the difference between the estimated time out-of-home and the true time out-of-home is important. This difference will vary as a function of the proportion of time spent out-of-home. That is, for individuals who go out frequently, the low sensitivity may cause underestimation of time out-of-home, while we may over-estimate the time out-of-home for those who seldom leave. To compute the expected bias in minutes we estimate the probability of false positive (1 − sp)(1 − p) and of false negative (1 − se)(p) and evaluate their difference multiplied by the number of minutes in a day:
| (2) |
Here, sp is the specificity of the model, se is the sensitivity of the model, and p is the proportion of time spent out-of-home. Using this estimate of the bias, fig. 2 shows the relationship between true daily time out-of-home and the estimate of time out-of home for a sensitivity of 0.939 and specificity of 0.975. In our population of four subjects, the lowest average daily time out-of-home was 3 hours per day. For this subject, the classifier will overestimate their time out-of-home by 19.8 minutes per day on average. On the other hand, the highest average time out-of-home was 8 hours per day, and the classifier will underestimate this subject’s time out-of-home by 5.1 minutes per day on average. Across subjects, the classifier will overestimate time out-of-home by 5.5 minutes per day on average. Within the range of probable average daily time out-of-home, this classifier performs very well at estimating the true time out-of-home.
Fig. 2.
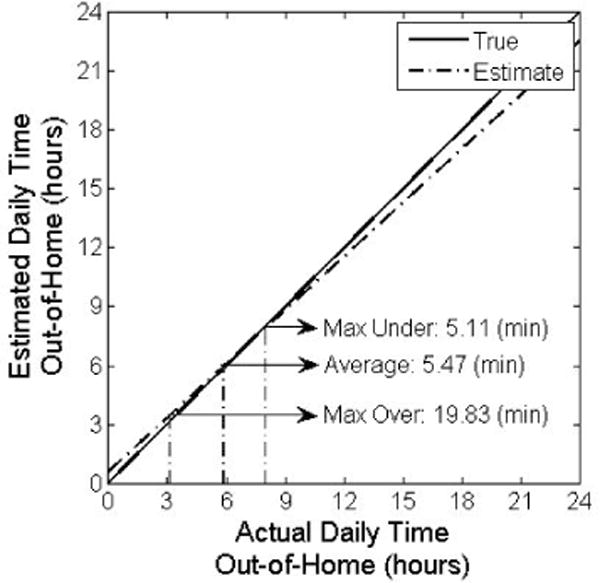
Estimated daily time out-of-home as a function of actual daily time out-of-home. For the individual from this population who leaves the most, the classifier underestimates their time out-of-home by 5.11 minutes. For the individual who leaves the least, the classifier overestimates their time out-of-home by 19.83 minutes. On average, the classifier will overestimate time out-of-home by 5.47 minutes.
This performance gives some indication of the noisiness of the sensor data. For example, many of the false negatives (periods classified as ‘in’ when nobody was actually in the home) occurred when sensors would fire in the home while the resident was out, likely due to sources of heat inside the apartment (e.g. space heaters, pets, or sun through the window). Indeed, in two separate homes, we discovered sensors that often fired while the resident was out of the home – one likely due to a computer turning on and causing a change in heat patterns in the room, and the other likely due to sun through the window. Because it is nearly impossible to detect and eliminate all mis-firings, we did not remove any of these events from the sensor stream. Instead, our performance gives an indication of how the model will perform under true conditions, which are typically noisy.
In general, we were able to handle these noise issues as well as noise associated with the door sensors themselves by accounting for both arrival and departure events. If the arrival door event was excluded from the model, the sensitivity dropped only slightly to 93.1% while the specificity dropped considerably to 82.6%. Exclusion of the departure door event dropped the sensitivity to 90.67% while the specificity remained largely unaffected at 96.6%. This difference between the arrival and departure door sensor events indicates more errors occur with door sensors when subjects are leaving the home than when they arrive back home.
MODEL APPLICATIONS
We have shown that our classifier can detect outings from the home with high accuracy. We now examine applications of this model.
D. Loneliness and Outings
In June of 2012, subjects from both the ISAAC cohort and the ORCATECH living lab were administered an online version of the UCLA loneliness scale [27], a well validated survey for assessing loneliness. This survey asks questions such as “I do not feel alone” and “There are people I feel close to”, where response options are: (1) Never, (2) Rarely, (3) Sometimes and (4) Often. Because this survey was administered online rather than in-person, we also added a response for ‘do not wish to answer’. After reversing the value of negative questions, the value of each answer was summed across the twenty questions to give a loneliness score ranging from 20 to 80, with 80 being the loneliest. The least lonely individual scored 21 on this survey, while the loneliest individual from our cohort scored 60. The mean value was 35 with a standard deviation of 7.87, which is consistent with values obtained by Russell et al in validating the UCLA Loneliness Scale for the elderly [28].
We chose to correlate loneliness score with the average time spent outside the home over the five days up to and including survey administration. This interval was chosen to provide the most robust summary of average outings while eliminating as much recall bias as possible. The current analysis included only those subjects with valid sensor data who answered all questions on the questionnaire (34 people) and who live alone. Of those 34 individuals, two were traveling away from home for at least three of the five days prior to filling out the survey and were therefore excluded from this aspect of the study. This left a total of 32 subjects who completed the loneliness survey and had valid sensor data. We used these subjects’ data to explore the correlation between outings and loneliness.
Figure 3 shows the correlation between the average time spent outside the home over the course of the four days up to and including survey administration and the corresponding loneliness score. As can be seen, average time outside the home is negatively correlated with the loneliness score, indicating those who spend more time at home tend to be lonelier. This is consistent with research showing a negative correlation between loneliness and physical exercise, social activity, and mobility. Still, the correlation is significant (p=0.011) but modest (r = −0.44). Obviously it is possible for some individuals to stay at home but not experience loneliness. Including other factors that influence loneliness such as social contact with others, sleep disturbances, and daytime dysfunction would assist in creating a more complete model of loneliness in the home.
Fig. 3.
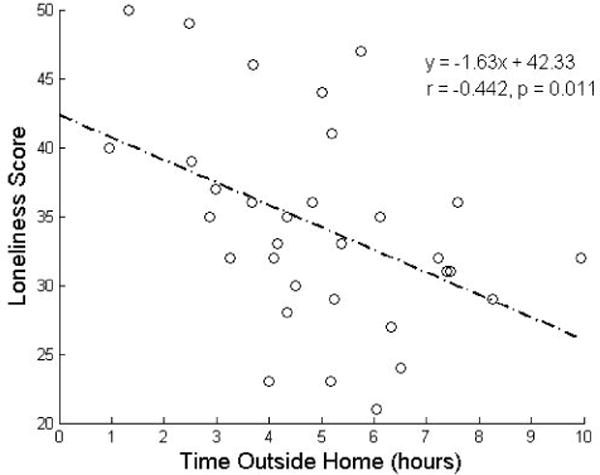
Loneliness score as a function of average time spent outside the home over the five days up to and including survey administration. Loneliness is negatively correlated with time out-of-home.
E. Outings by Time of Day
While the total time spent outside the home is important, various factors can influence the time spent outside the home. For example, in retirement communities people typically take meals in the central dining hall. Leaving simply to eat a meal may not influence loneliness the same way that leaving to play games with close friends would. For this reason, it is also important to view outings as a function of the time of day.
For this aspect of the study, we used our outing model to compute outings, y for every five minute interval over the thirty days prior to completing the loneliness survey where y=1 if the individual was out of the home, and y=0 if the individual was in the home. By averaging the corresponding y values for each subject and day, we were able to generate a picture of the probability of leaving the home as a function of the time of day. Figure 4 shows the probability of leaving over the entire population of 51 individuals living alone in the community who completed the survey and had any full days of sensor data during the 30 day period prior to survey completion. Clear peaks can be discerned at around noon and 6 p.m., corresponding to the lunch and dinner hours, respectively. The probability of being out of the home at these times was 0.5, indicating that at noon and 6 p.m., an average of 50% of our elderly population is outside the home on any given day. Further, these subjects are more likely to be out of the home in the early afternoon, perhaps when most errands are completed. Not surprisingly, fig. 4 also shows that our cohort is almost certainly at home during the night, consistent with sleep patterns.
Fig. 4.
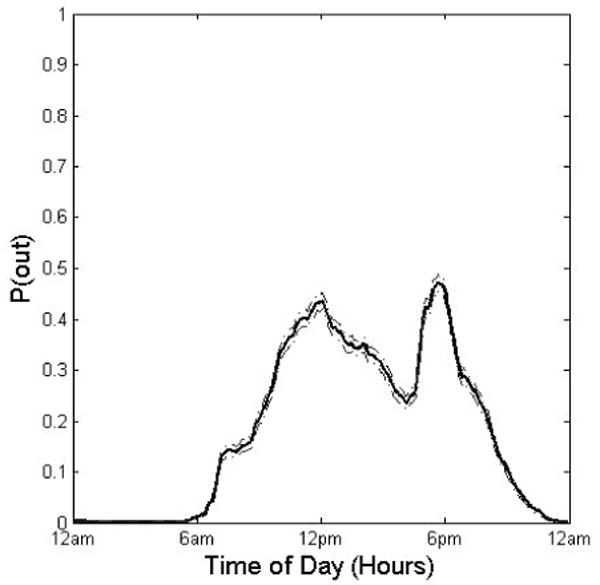
Mean and 95% CI of the probability of being out of the home as a function of the time of day for 51 elderly subjects over the course of 30 days. For this cohort of elderly, roughly half the population is out of the home at lunch and dinner times on any given day.
While trends across the population are important for summarizing how elderly spend their time, individual trends are also important. To illustrate the variability of outing patterns of lonely and non-lonely individuals, we chose to plot the probability of being out for a representative sample of five subjects with varying loneliness scores. Their loneliness scores and corresponding probability of being out of the home are shown in fig. 5(a–e). Clear meal times and an obvious regularity can be discerned in fig 5a–d, but this regularity is largely absent in fig 5e—the loneliest individual plotted.
Fig. 5.
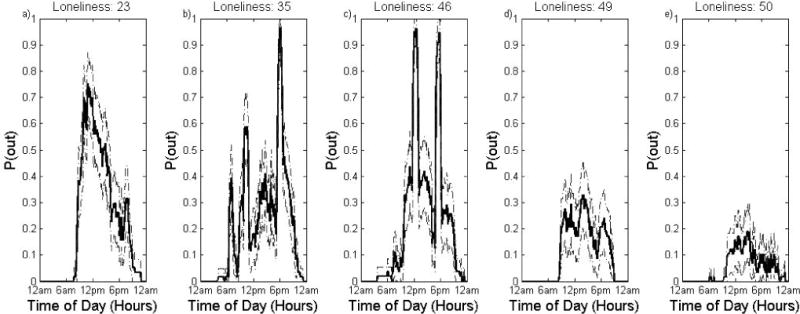
Average probability of being out of the home as a function of the time of day for five different individuals over 30 days with varying loneliness scores. 95% CI in this measure is plotted in grey. Meal time outings can be seen on plots (a–d) whereas subject (e), the loneliest of the group, is the most variable and the only one with no clear mealtime peaks.
It is worth noting that the individuals in fig 5a, c, and d live in retirement communities where they could take meals in the local dining hall. While the individual plotted fig 5a leaves the home regularly in the late afternoon, the main peaks in fig 5c surround the lunch and dinner mealtimes. This mealtime regularity is also seen in fig 5d, although this individual rarely leaves the home at all. This may suggest that outings other than simple mealtime outings are important in assessing loneliness for individuals living in a retirement community. On the other hand, mealtime outings for individuals living alone in the community may represent an important aspect of socialization, and contribute greatly to decreasing loneliness. This is seen in fig 5b. This individual lives alone in the community and, even though his most common outing times surround the mealtimes, he is not lonely. Likely he is getting a great deal of socialization when he leaves his home to get a meal with a friend, which helps ward off loneliness. Taking into account these different lifestyles may be important in unobtrusively modeling loneliness in the home.
F. Outings and Physical Activity
Many physical activities are done outside the home, so we tested how outings from the home correlate with self-report of physical exercise. Concurrent with the administration of the UCLA loneliness scale, subjects also completed a physical activity survey from Berkman’s Social Disengagement Index [29]. This fifteen item survey queries subjects regarding activities they do both in and outside the home. To get a composite score of outside activities, scores on three questions were reversed: (i) How often do you prepare your own meals, (ii) How often do you read books, magazines, or newspapers, and (iii) How often do you watch television, as these are activities likely done inside the home. After reversing these scores, the scores on all questions were summed to give a total outdoor activity index.
A plot of the correlation between the physical activity score and the average time spent outside the home over the four days up to and preceding survey administration is shown in Figure 6a. As can be seen, physical activity score is positively correlated with average time spent outside the home (r=0.415, p=0.031), indicating outings are also an important measure of physical activity. This correlation is also prone to recall bias. Figure 6b shows a plot of the correlation as a function of the window of observation. While looking at only the same day as the survey generates the worst correlation, the best correlation is seen when averaging around 3–7 days of outing activity. The correlation then drops considerably until it plateaus at around 18 days of outing data. This result is consistent with the salience effects seen by Eagle et al. in their correlation of self-report of proximity patterns of other individuals with Bluetooth phone logs [30], suggesting human recall favors the recent events.
Fig. 6.
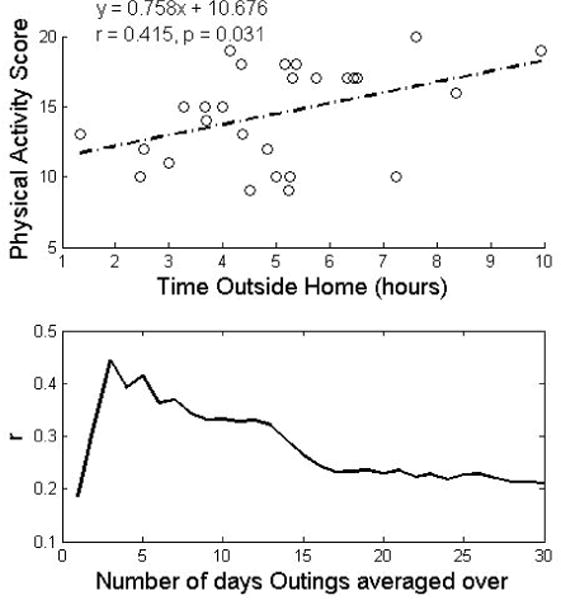
(a) Physical activity score as a function of average time spent outside the home over the four days up to and including survey administration. (b) Pearson’s correlation coefficient (r) between average time outside home and physical activity score. As more days further from the survey date are included in the window and averaged, the correlation drops off. This suggests recall bias.
CONCLUSIONS
We have presented and validated a logistic regression based classifier to detect outings from the home on longitudinal data from subjects currently monitored in their own homes. Our classifier performs very well with a sensitivity of 0.939 and specificity of 0.975, but it depends heavily on door sensors firing when they ought. Simple tests for door sensor functionality should be employed prior to using this model.
We also discussed several practical applications of our approach. Specifically, we have shown that time outside the house is negatively correlated with loneliness, indicating the utility of time out-of-home in any unobtrusive model of loneliness. We have also demonstrated a general pattern of out-of-home behavior in an elderly population consistent with prior research, and shown that outing patterns vary substantially on an individual level which may be useful in detecting individuals at increased risk of loneliness. We correlated time out-of-home with physical activity, and were able to demonstrate that an individual’s self report of physical activity may be subject to recall bias. In conclusion, we expect that being able to accurately detect out-of-home events will improve point-of-care in the home setting, particularly for loneliness and other adverse health outcomes whose symptoms present with an increased, decreased, or more variable pattern of out-of-home behaviors.
Acknowledgments
T. L. Hayes has a significant financial interest in Intel Corporation, a company that may have a commercial interest in the results of this research and technology. This potential conflict has been reviewed and managed by OHSU.
This work was supported in part by the National Institute of Health and the National Institute on Aging (P30 AG024978, P30AG008017, R01AG02059), and by Intel Corporation.
Contributor Information
Johanna Petersen, Email: peterjo@ohsu.edu, Department of Biomedical Engineering, OHSU, 3303 SW Bond Avenue, Portland, OR 97239 USA (phone: 208-301-1724; fax: 503-418-9311).
Daniel Austin, Email: austidan@ohsu.edu, BME Department and ORCATECH, OHSU, 3303 SW Bond Avenue, Portland, OR 97239 USA.
Jeffrey A. Kaye, Email: kaye@ohsu.edu, Dept. of Neurology and ORCATECH at OHSU, 3181 SW Sam Jackson Park Rd, Portland, OR 97239.
Misha Pavel, Email: mpavel@nsf.gov, BME Department and ORCATECH, OHSU, 3303 SW Bond Avenue, Portland, OR 97239 USA.
Tamara L. Hayes, Email: hayesta@ohsu.edu, BME Department and ORCATECH, OHSU, 3303 SW Bond Avenue, Portland, OR 97239 USA.
References
- 1.Theeke LA. Predictors of loneliness in U.S. adults over age sixty-five. Arch Psychiatr Nurs. 2009;23:387–96. doi: 10.1016/j.apnu.2008.11.002. [DOI] [PubMed] [Google Scholar]
- 2.Pinquart M, Sorensen S. Influences on Loneliness in Older Adults: A Meta-Analysis. Basic and Applied Social Psychology. 2001;23:245–266. [Google Scholar]
- 3.Luo Y, Hawkley LC, Waite LJ, Cacioppo JT. Loneliness, health, and mortality in old age: a national longitudinal study. Soc Sci Med. 2012;74:907–14. doi: 10.1016/j.socscimed.2011.11.028. [DOI] [PMC free article] [PubMed] [Google Scholar]
- 4.Perissinotto CM, Stijacic Cenzer I, Covinsky KE. Loneliness in older persons: a predictor of functional decline and death. Arch Intern Med. 2012;172:1078–83. doi: 10.1001/archinternmed.2012.1993. [DOI] [PMC free article] [PubMed] [Google Scholar]
- 5.Tilvis RS, Laitala V, Routasalo PE, Pitkala KH. Suffering from loneliness indicates significant mortality risk of older people. J Aging Res. 2011;2011:1–5. doi: 10.4061/2011/534781. [DOI] [PMC free article] [PubMed] [Google Scholar]
- 6.Wilson RS, Krueger KR, Arnold SE, Schneider JA, Kelly JF, Barnes LL, Tang Y, Bennett DA. Loneliness and risk of Alzheimer disease. Arch Gen Psychiatry. 2007;64:234–40. doi: 10.1001/archpsyc.64.2.234. [DOI] [PubMed] [Google Scholar]
- 7.Cacioppo JT, Hawkley LC, Berntson GG, Ernst JM, Gibbs AC, Stickgold R, Hobson JA. Do lonely days invade the nights? Potential social modulation of sleep efficiency. Psychol Sci. 2002;13:384–7. doi: 10.1111/1467-9280.00469. [DOI] [PubMed] [Google Scholar]
- 8.Hawkley LC, Preacher KJ, Cacioppo JT. Loneliness impairs daytime functioning but not sleep duration. Health Psychol. 29:124–9. doi: 10.1037/a0018646. [DOI] [PMC free article] [PubMed] [Google Scholar]
- 9.Buchman AS, Boyle PA, Wilson RS, James BD, Leurgans SE, Arnold SE, Bennett DA. Loneliness and the rate of motor decline in old age: the Rush Memory and Aging Project, a community-based cohort study. BMC Geriatr. 2010;10:77–84. doi: 10.1186/1471-2318-10-77. [DOI] [PMC free article] [PubMed] [Google Scholar]
- 10.Faulkner KA, Cauley JA, Zmuda JM, Griffin JM, Nevitt MC. Is social integration associated with the risk of falling in older community-dwelling women? J Gerontol A Biol Sci Med Sci. 2003;58:M954–9. doi: 10.1093/gerona/58.10.m954. [DOI] [PubMed] [Google Scholar]
- 11.Hawkley LC, Cacioppo JT. Loneliness matters: a theoretical and empirical review of consequences and mechanisms. Ann Behav Med. 2010;40:218–27. doi: 10.1007/s12160-010-9210-8. [DOI] [PMC free article] [PubMed] [Google Scholar]
- 12.Hayes TL, Pavel M, Kaye J. An Approach for Deriving Continuous Health Assessment Indicators From In-home Sensor Data. In: Mihailidis A, Boger J, Kautz H, Normie L, editors. Technology and Aging. Vol. 21. IOS Press; 2008. pp. 130–137. (Assistive Technology Research Series). [Google Scholar]
- 13.Demiris G, Hensel BK. Technologies for an aging society: a systematic review of “smart home” applications. Yearb Med Inform. 2008;47:33–40. [PubMed] [Google Scholar]
- 14.Skubic M, Alexander G, Popescu M, Rantz M, Keller J. A smart home application to eldercare: current status and lessons learned. Technol Health Care. 2009;17:183–201. doi: 10.3233/THC-2009-0551. [DOI] [PubMed] [Google Scholar]
- 15.Park S, Kautz H. Hierarchical recognition of activities of daily living using multi-scale, multi-perspective vision and RFID. Seattle, WA, United states: 2008. [Google Scholar]
- 16.Zouba N, Boulay B, Bremond F, Thonnat M. Monitoring activities of daily living (ADLs) of elderly based on 3D key human postures. Santorini, Greece: 2008. [Google Scholar]
- 17.Joshua RS, Kenneth PF, Bing J, Alexander M, Matthai P, Adam DR, Sumit R, Kishore S-R. RFID-based techniques for human-activity detection. Commun ACM. 2005;48:39–44. [Google Scholar]
- 18.Hayes TL, Hagler S, Austin D, Kaye J, Pavel M. Unobtrusive assessment of walking speed in the home using inexpensive PIR sensors; presented at 31st Annual International Conference of the IEEE Engineering in Medicine and Biology Society; Minneapolis, MN. 2009. [DOI] [PMC free article] [PubMed] [Google Scholar]
- 19.Hayes TL, Riley T, Pavel M, Kaye JA. Estimation of rest-activity patterns using motion sensors; presented at Engineering in Medicine and Biology Society (EMBC), 2010 Annual International Conference of the IEEE; 2010. [DOI] [PMC free article] [PubMed] [Google Scholar]
- 20.Petersen J, Larimer N, Kaye JA, Pavel M, Hayes TL. SVM to detect the presence of visitors in a smart home environment; presented at Engineering in Medicine and Biology Society (EMBC), 2012 Annual International Conference of the IEEE; [DOI] [PMC free article] [PubMed] [Google Scholar]
- 21.Hayes TL, Abendroth F, Adami A, Pavel M, Zitzelberger TA, Kaye JA. Unobtrusive assessment of activity patterns associated with mild cognitive impairment. Alzheimers Dement. 2008;4:395–405. doi: 10.1016/j.jalz.2008.07.004. [DOI] [PMC free article] [PubMed] [Google Scholar]
- 22.Hawkley LC, Thisted RA, Cacioppo JT. Loneliness predicts reduced physical activity: cross-sectional & longitudinal analyses. Health Psychol. 2009;28:354–63. doi: 10.1037/a0014400. [DOI] [PMC free article] [PubMed] [Google Scholar]
- 23.Aylaz R, Akturk U, Erci B, Ozturk H, Aslan H. Relationship between depression and loneliness in elderly and examination of influential factors. Arch Gerontol Geriatr. 55:548–54. doi: 10.1016/j.archger.2012.03.006. [DOI] [PubMed] [Google Scholar]
- 24.Suzuki T, Murase S. Influence of outdoor activity and indoor activity on cognition decline: use of an infrared sensor to measure activity. Telemed J E Health. 2010;16:686–90. doi: 10.1089/tmj.2009.0175. [DOI] [PubMed] [Google Scholar]
- 25.Kaye JA, Maxwell SA, Mattek N, Hayes TL, Dodge H, Pavel M, Jimison HB, Wild K, Boise L, Zitzelberger TA. Intelligent Systems for Assessing Aging Changes: Home-Based, Unobtrusive and Continuous Assessment of Aging. Journal of Gerontology Series B: Psychological Sciences and Social Sciences. 2011;66B:i180–i190. doi: 10.1093/geronb/gbq095. [DOI] [PMC free article] [PubMed] [Google Scholar]
- 26.Long JS. Regression Models for Categorical and Limited Dependent Variables. 1. Sage Publications, Inc; 1997. [Google Scholar]
- 27.Russell D, Peplau LA, Cutrona CE. The revised UCLA Loneliness Scale: concurrent and discriminant validity evidence. J Pers Soc Psychol. 1980;39:472–80. doi: 10.1037//0022-3514.39.3.472. [DOI] [PubMed] [Google Scholar]
- 28.Russell DW. UCLA Loneliness Scale (Version 3): reliability, validity, and factor structure. J Pers Assess. 1996;66:20–40. doi: 10.1207/s15327752jpa6601_2. [DOI] [PubMed] [Google Scholar]
- 29.Bassuk SS, Glass TA, Berkman LF. Social disengagement and incident cognitive decline in community-dwelling elderly persons. Ann Intern Med. 1999;131:165–73. doi: 10.7326/0003-4819-131-3-199908030-00002. [DOI] [PubMed] [Google Scholar]
- 30.Eagle N, Pentland AS, Lazer D. Inferring friendship network structure by using mobile phone data. Proc Natl Acad Sci U S A. 2009;106:15274–8. doi: 10.1073/pnas.0900282106. [DOI] [PMC free article] [PubMed] [Google Scholar]


