Abstract
Background:
Tilia amurensis consists of various compounds, such as flavonoids and terpenoids.
Objective:
A simple and reliable high performance liquid chromatography (HPLC) coupled with the diode array detector (DAD) method has been established for simultaneous determination of epicatechin, nudiposide, lyoniside, and scopoletin isolated from Tilia amurensis.
Materials and Methods:
Optimum separations were obtained with a SHISEIDO C18 column by gradient eluton, with 0.1% Trifluoroacetic acid (TFA) water-methanol as the mobile phase. The gradient elution system was completed within 40 minutes. The flow rate and detection wavelength were 1 mL/minute, 205 nm, 250 nm, and 280 nm, respectively.
Results:
Validation of the analytical method was evaluated by linearity, precision, and the accuracy test. The calibration curve was linear over the established range with R2 > 0.997. The limit of detection (LOD) and limit of quantification (LOQ) ranged from 0.01-15.20 μg/mL and 0.03-46.06 μg/mL. The method exhibited an intraday and interday precision range of 96.25-105.66% and 93.52-109.92%, respectively (RSD <2.80%). The recoveries and relative standard deviation (RSD) of the four compounds in Tilia amurensis were in the range of 90.42-104.84% and 0.2-2.58%.
Conclusion:
This developed method was accurate and reliable for the quality evaluation of the four compounds isolated from Tilia amurensis.
Keywords: High performance liquid chromatography/diode array detector, quality control, simultaneous determination, Tilia amurensis
INTRODUCTION
In many countries, herbal medicines have been generally medicines used for thousands of years. Increased side effects, lack of healing treatment for several chronic diseases, expenses of new drugs, microbial resistance, and emerging diseases are some of the reasons for renewed public interest in complementary and alternative medicines.[1] At present, there are many studies that have been performed to explain the bioactive compounds of herbs and demonstrated their mechanism of remedy and prevention of various disease containing neurodegenerative disorders.[2,3,4,5,6] The trees of the Tilia species are used around the world for their medicinal properties. Tilia amurensis is commonly known as a bee tree and widely distributed in various countries, including Korea, China, and Japan. In Korea, the flowers of this tree have been applied as a therapeutic agent for alleviating a fever and its leaves have also been traditionally used to treat cancer. Previous chemical studies of this species have demonstrated the presence of coumarin, flavonoid, lignin, and triterpene. In recent times, the anti-tumor, anti-inflammatory, and topoisomerase I and II inhibitory activities of this plant have been reported.[2,7]
Herbal medicines consist of numerous compounds, which showed pharmacological activities, such as phenols, flavonoids, alkaloids, and terpenoids.[8,9,10] These various compounds indicate diverse therapeutic effects and the quality control of each compound is difficult. With the expanding resources and for controlling the quality of herbs from different areas, it is very essential to develop a simple and effective HPLC-DAD method. In the past decades, a large number of analytical strategies have been designed to evaluate the quality of medicinal herbs or herbal preparations. These include quantification of a single compound or multiple compounds, as well as fingerprint analysis. Single marker compound quantification is simple and convenient, but it does not provide sufficient quantitative information for the other active compounds in complex natural products. In the process, techniques such as HPLC, (gas chromatography) GC, gas chromatography-mass spectrometry (GC-MS), and liquid chromatography-mass spectrometry (LC-MS) are often used. However, HPLC is simple, reliable, and inexpensive, and has been widely used for quantitative analysis of herbal medicine.[11,12,13,14,15]
There are no reported simultaneous analyses for the quality control of T. amurensis. In this study, we aim to develop a method of simultaneous determination by HPLC-DAD for qualitative and quantitative analysis of four active compounds, (-)-epicatechin, nudiposide, lyoniside, and scopoletin in T. amurensis. These compounds have been isolated from T. amurensis recently.
MATERIALS AND METHODS
Plants material and materials
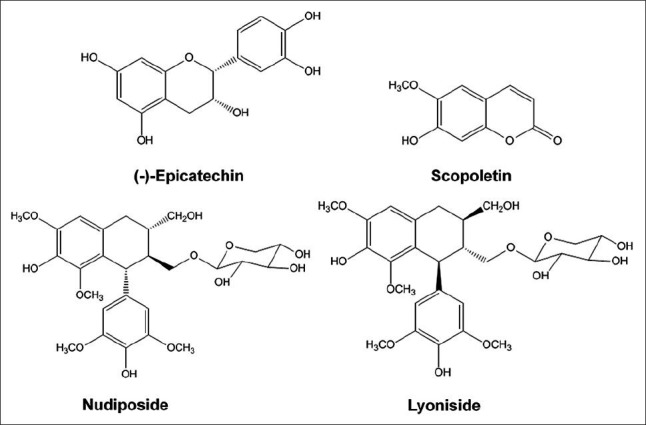
The woods of Tilia amurnesis (Tiliacea) were collected in the Kyungdong traditional herbal market (Seoul). The origin of T. amurnesis was identified by Dr. Young Bae Seo, a professor of the College of Oriental Medicine, Daejeon University, Korea. The voucher specimen (CJ022M) was deposited at the Kangwon National University in Chuncheon, Korea. Four standard compounds, (-)-epicatechin, nudiposide, lyoniside, and scopoletin were isolated from the woods of T. amurnesis by various chromatographic techniques. Their chemical structures were confirmed based on 1H- NMR and 13C- NMR data and compared with the reported data [Figure 1]. The HPLC solvent for the gradient elution system, water, and methanol were purchased from J.T. Baker (USA). Trifluoroacetic acid (TFA) was of analytical grade, from Dae-jung, in Korea.
Figure 1.

Chemical structures of (-)-epicatechin, nudiposide, lyoniside, and scopoletin
Conditions for high-performance liquid chromatography and instrument
The HPLC (Dionex Ultimate 3000 system, Germany) instrument was equipped with a model series LPG 3X00 pump, ACC-3000 auto sampler, TCC-3000SD column oven, and DAD-3000(RS) diode array UV/VIS detector. Separation of Tilia amurensis was done on an SHISEIDO C18 column (S-5 μm, 4.6 mm I.D. ×250 mm). The separation was carried out using the gradient elution procedure with mobile phase A (water containing 0.1% TFA) and B (methanol). The linear gradients changed as follows: 0-5 minutes, isocratic 5% B; 5-20 minutes, linear gradient 5-30% B; 20-25 minutes, isocratic 30% B; 25-40 minutes, linear gradient 30-80% B. The total run time was 40 minutes at a flow rate of 1 mL/minute. The peaks of the compounds were monitored by a diode array detector, and the detection wavelength was set at 205 nm. The sample injection volume was 20 μL, and the column temperature was 35°C.
Preparation of standard solutions
Standard stock solutions of four compounds were prepared in methanol and stored below 4°C. Working standard solutions were prepared by serial dilution of stock solutions with methanol and water. The stock solutions were prepared with a concentration of 100 μg/mL for (-)-epicatechin, 433 μg/mL for nudiposide, 100 μg/mL for lyoniside, and 100 μg/mL for scopoletin, respectively. The solutions were filtered through a 0.45 μm filter.
Preparation of sample solution
The wood of Tilia amurensis was extracted by ultrasonication extraction, in 80% methanol. The extracted methanol solution was evaporated till the residue was obtained. To obtain the powder, freeze-drying was conducted. The powder was accurately weighed (131 mg) was dissolved in 5 mL of methanol. The sample solution was filtered through 0.45 μm membrane filters before injection into the HPLC-DAD.
RESULTS AND DISCUSSION
Optimization of high-performance liquid chromatography conditions
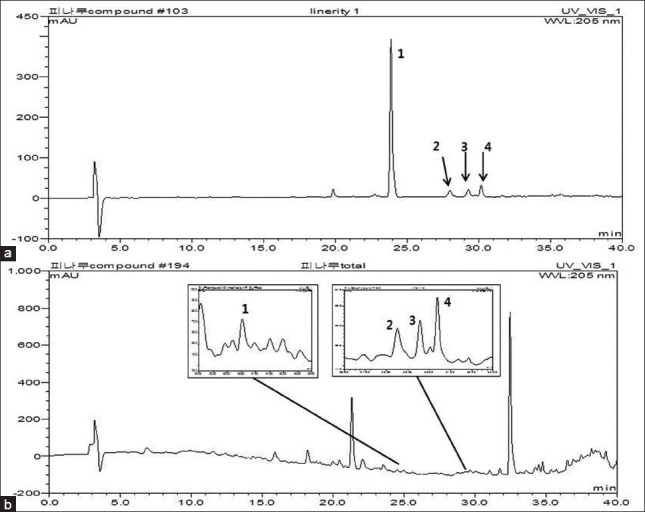
We tested various mobile phase compositions (water-acetonitrile, water-methanol, water containing 0.1% acetonitrile, and water containing 0.1% methanol) to optimize a suitable mobile phase. Various gradient elution proportions of water containing 0.1% methanol were also tested, to achieve the desired separation. Trifluoroacetic acid (0.1%) was added to the water to improve the peak shape and inhibit peak tailing. Based on the maximum UV absorption wavelength of each of the four compounds, the UV wavelength of the DAD detector was selected. The four compounds were identified at 205 nm. A HPLC chromatogram of the four standards is shown in Figure 2a. The peak of each compound was confirmed by comparing the retention time in the HPLC chromatogram and the ultraviolet (UV) spectrum of each marker constituent.
Figure 2.

The HPLC chromatogram of a standard mixture (a) and the methanolic extract of Tilia amurensis (b) (-)-epicatechin (1), nudiposide (2), lyoniside (3), and scopoletin (4)
Validation of high-performance liquid chromatography analytical method
Validation of the HPLC method was performed according to the International Conference on Harmonization (ICH) guidelines by determination of the linearity, precision, and recovery test.
Linearity, limit of detection, and limit of quantification
Stock solutions of the four compounds were diluted with methanol to provide six concentrations. To establish the calibration graph, mixed standard solutions of six different concentrations were analyzed thrice. The calibration graph was plotted by using the value of the peak area versus the concentration of each compound. The linear regression equation between the concentration of the standards analyzed and the peak area could be given as Y = Ax + B, where A was the slope of the calibration curve, B was the intercept of the calibration curve, x was the concentration of the marker compounds, and Y was the peak area. Correlation coefficient (R2) values indicated linearity. The limit of detection (LOD) and limit of quantification (LOQ) were determined for each compound at a signal-to-noise ratio (s/n) of 3:1 and 10:1, respectively. All the standard compounds showed good linearity (R2 > 0.997) in a relatively side concentration range. The LOD and LOQ were measured by the calibration curve. LOD was in the range of 0.01-15.20 μg/mL, LOQ was in the range of 0.03-46.06 μg/mL [Table 1]. This result exhibited a high sensitivity of this established method.
Table 1.
Analytical results of calibration curves, limit of detection, and limit of quantification

Precision and accuracy
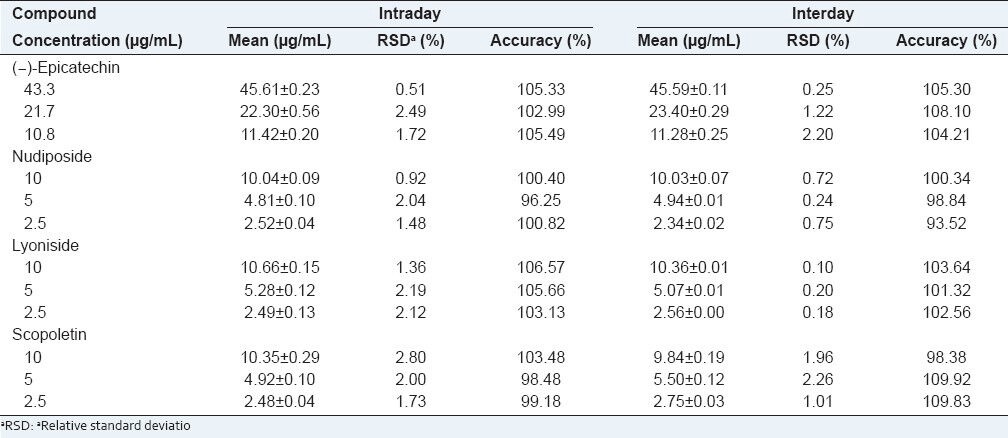
Intra- and interday variations were chosen to determine the precision of the developed method. For the intraday variability test, calibration sample solutions were analyzed for five replicates within one day, while for the interday variability tests, the solutions were examined in duplicates for three consecutive days. The relative standard deviation (RSD) was taken as a measure of precision and repeatability. The RSD values of the intraday and interday tests were found to be within the ranges of 0.51-2.80% and 0.10-2.26%, respectively, with accuracy ranges of 96.25-105.66% for the intraday test and 93.52-109.92% for the interday test [Table 2]. This result demonstrated good reproducibility of this analytical method.
Table 2.
Analytical results of intra. and interday tests

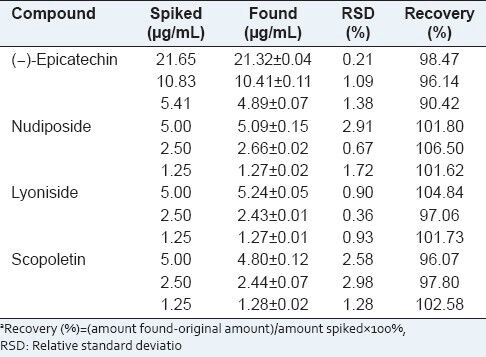
The recovery test was used to evaluate the accuracy of this method. Three different concentration levels of the marker compounds were added to the Tilia amurensis sample solution. The solutions were injected thrice. The contents of the marker compounds were calibrated from the corresponding calibration graph. Recovery (%) was calculated by the equation (amount found - original amount)/amount spiked × 100%. The recovery of the selected marker compounds was 90.42-104.84% with an RSD less than 2.58% [Table 3].
Table 3.
Recovery test of four compounds from Tilia amurensis

The results of the recovery test showed that the established method was reliable and accurate.
Analysis of Tilia amurensis
The HPLC-DAD method established was applied for the analysis of four compounds in the Tilia amurensis sample. The peaks of each compound in Tilia amurensis were identified by comparison of the retention time and UV spectra with those of the standards. Figure 2b showed that the peaks of each compound were separated successfully within 40 minutes. The contents of the four compounds in T. amurensis were calculated from the calibration curves of each standard. Table 4 exhibits the results of the sample analysis. Of the four compounds, nudiposide had the highest content (3.21 μg/mg) in T. amurensis and lyoniside had the lowest content (0.07 μg/mg). These results indicated that this HPLC-DAD method might be used to evaluate the quality of T. amurensis.
Table 4.
Contents of active compounds in Tilia amurensis

CONCLUSION
We established a simple and accurate HPLC-DAD method for simultaneous determination of four marker compounds, epicatechin, nudiposide, lyoniside, and scopoletin, isolated from Tilia amurensis. Validation for evaluation of this method was accomplished by using the linearity, precision, and accuracy test. Results of the validation exhibited that the developed method was sensitive, rapid, and reliable. The proposed method could be used to improve the quality control of Tilia amurensis. This method could also be useful in controlling the quality of other related pharmaceutical preparations.
ACKNOWLEDGMENT
This research was supported by the Basic Science Research Program through the National Research Foundation of Korea (NRF) funded by the Ministry of Education, Science and Technology (2010-0005149).
Footnotes
Source of Support: Basic Science Research Program through the National Research Foundation of Korea (NRF) funded by the Ministry of Education, Science and Technology
Conflict of Interest: None declared.
REFERENCES
- 1.Humber JM. The role of complementary and alternative medicine: Accommodating pluralism. J Am Med Assoc. 2002;288:1655–6. [Google Scholar]
- 2.Kim KH, Moon EJ, Kim SY, Choi SU, Lee KR. Lignan constituents of Tilia amurensis and their biological evaluation on antitumor and anti-inflammatory activities. Food Chem Toxicol. 2012;50:3680–6. doi: 10.1016/j.fct.2012.07.014. [DOI] [PubMed] [Google Scholar]
- 3.Hwang SL, Yen GC. Neuroprotective effects of the citrus flavanones against H2O2-induced cytotoxicity in PC12 cells. J Agric Food Chem. 2008;56:859–64. doi: 10.1021/jf072826r. [DOI] [PubMed] [Google Scholar]
- 4.Pukalskas A, Venskutonis PR, Salido S, Waard PD, Van Beek TA. Isolation, identification and activity of natural antioxidants from horehound (Marrubium vulgare L.) cultivated in Lithuania. Food Chem. 2012;130:695–701. [Google Scholar]
- 5.Donzelli A, Braida D, Finardi A, Capurro V, Valsecchi AE, Colleoni M, et al. Neuroprotective effects of genistein in Mongolian Gerbils: Estrogen receptor-β involvement. J Pharmacol Sci. 2010;114:158–67. doi: 10.1254/jphs.10164fp. [DOI] [PubMed] [Google Scholar]
- 6.Li H, Min BS, Zheng C, Lee J, Oh SR, Ahn KS, et al. Neuroprotective and free radical scavenging activities of phenolic compounds from Hovenia dulcis. Arch Pharm Res. 2005;28:904–9. doi: 10.1007/BF02977346. [DOI] [PubMed] [Google Scholar]
- 7.Choi JY, Seo CS, Zheng NS, Lee CS, Son JL. Topoisomerase I and II inhibitory constituents from the bark of Tilia amurensis. Arch Pharm Res. 2008;31:1413–8. doi: 10.1007/s12272-001-2125-y. [DOI] [PubMed] [Google Scholar]
- 8.Tyler VE. Phytomedicines: Back to the future. J Nat Prod. 1999;62:1589–92. doi: 10.1021/np9904049. [DOI] [PubMed] [Google Scholar]
- 9.Normile D. The new face of traditional chineses medicine: Science. Science. 2003;299:188–90. doi: 10.1126/science.299.5604.188. [DOI] [PubMed] [Google Scholar]
- 10.Jiang WY. Therapeutic wisdom in traditional Chinese medicine: A perspective from modern science. Trands Pharmacol Sci. 2002;26:558–63. doi: 10.1016/j.tips.2005.09.006. [DOI] [PubMed] [Google Scholar]
- 11.Gherman C, Culea M, Cozar O. Comparative analysis of some active principles of herb plants by GC/MS. Talanta. 2000;53:253–62. doi: 10.1016/s0039-9140(00)00458-6. [DOI] [PubMed] [Google Scholar]
- 12.Oprean R, Tamas M, Sandulescu R, Roman L. Essential oils analysis. I. Evaluation of essential oils composition using both GC and MS fingerprints. J Pharm Biomed Anal. 1998;18:651–7. doi: 10.1016/s0731-7085(98)00283-0. [DOI] [PubMed] [Google Scholar]
- 13.Peng JB, Jia HM, Liu YT, Zhang HW, Dong S, Zou ZM. Qualitative and quantitative characterization of chemical constituents in Xin-Ke-Shu preparations by liquid chromatography coupled with a LTQ Orbitrap mass spectrometer. J Pharm Biomed Anal. 2011;55:984–95. doi: 10.1016/j.jpba.2011.03.045. [DOI] [PubMed] [Google Scholar]
- 14.Wei H, Sun L, Tai Z, Gao S, Xu W, Chen W. A simple and sensitive HPLC method for the simultaneous determination of eight bioactive components and fingerprint analysis of Schisandra sphenanthera. Anal Chim Acta. 2010;662:97–104. doi: 10.1016/j.aca.2009.12.039. [DOI] [PubMed] [Google Scholar]
- 15.Cao XY, Wang ZZ. Simultaneous determination of four iridoid glycosides and comparative analysis of Radic Hentianae Macrophyllae and their related substitutes by HPLC. Phytochem Anal. 2010;21:348–54. doi: 10.1002/pca.1206. [DOI] [PubMed] [Google Scholar]


