

Abstract
Cortical–subcortical circuits have been implicated in the pathophysiology of mood disorders. Structural and biochemical abnormalities have been identified in patients diagnosed with mood disorders using magnetic resonance imaging-related approaches. In this study, we used magnetization transfer (MT), an innovative magnetic resonance approach, to study biophysical changes in both gray and white matter regions in cortical–subcortical circuits implicated in emotional regulation and behavior. Our study samples comprised 28 patients clinically diagnosed with major depressive disorder (MDD) and 31 non-depressed subjects of comparable age and gender. MT ratio (MTR), representing the biophysical integrity of macromolecular proteins within key components of cortical–subcortical circuits—the caudate, thalamic, striatal, orbitofrontal, anterior cingulate and dorsolateral regions—was the primary outcome measure. In our study, the MTR in the head of the right caudate nucleus was significantly lower in the MDD group when compared with the comparison group. MTR values showed an inverse relationship with age in both groups, with more widespread relationships observed in the MDD group. These data indicate that focal biophysical abnormalities in the caudate nucleus may be central to the pathophysiology of depression and critical to the cortical–subcortical abnormalities that underlie mood disorders. Depression may also accentuate age-related changes in the biophysical properties of cortical and subcortical regions. These observations have broad implications for the neuronal circuitry underlying mood disorders across the lifespan.
Keywords: caudate nucleus, depression, imaging, magnetization transfer, mood disorders
Introduction
Major depressive disorder (MDD) is a common mental disorder that is associated with substantial economic and psychosocial impairment.1,2 MDD is a heterogeneous disorder clinically, with a variable clinical course and outcome.3–5 Both biological and environmental factors have been implicated in the pathophysiology of MDD, and while several neurobiological correlates have been described, no central mechanism has been recognized as critical in the etiopathogenesis of the illness.4,6–8
Cortical–subcortical circuits have been implicated in the pathophysiology of mood disorders. Evidence from both clinical and experimental sources indicates that specific frontal– subcortical circuits and neocortical–subcortical–cortical loops have important roles in maintaining and mediating emotional and cognitive states.9–11 In vivo neuroimaging approaches provide an opportunity to identify and characterize neurobiological abnormalities in specific circuits in patients diagnosed with clinical brain disorders.12–15 Microstructural and biophysical abnormalities that form the basis of the aberrations in connectivity are frequently observed in patients with mood disorders.15,16
Magnetization transfer (MT) is an innovative magnetic resonance imaging (MRI)-related approach that helps identify biophysical abnormalities in both gray and white matter regions.17–20 In MT imaging, an ‘off resonance’ sequence is used to saturate selectively the macromolecular proteins attached to the bound water compartment in the brain, thereby providing an image that primarily reflects free water contributions.17–19 The extent to which this saturation occurs is a reflection of the macromolecular protein composition in specific brain regions and the underlying tissue pathology. The primary outcome measure of MT imaging in vivo is the MT ratio (MTR), which reflects the underlying compromise to the protein compartment. Reductions in MTR in the white matter are associated with axonal and myelin loss in post-mortem imaging studies using brain tissue from patients diagnosed with multiple sclerosis.21,22 The neurobiological substrates of lower MTR in gray matter regions are less precisely characterized and are believed to reflect microscopic injury to cell membrane proteins and phospholipids from several underlying mechanisms.23–25
MT imaging has been used to examine the neurobiological basis of mood and related behavioral disorders.26–30 For example, lower MTR has been reported in patients with late-life unipolar depression, with abnormalities identified in neocortical regions and subcortical nuclei and includes gray and white matter structures.31,32 A recent report described lower MTR in treatment refractory patients with depression in several gray and white matter regions.33 In patients diagnosed with bipolar disorder, lower MTR has been identified in the right subgenual anterior cingulate and adjacent white matter when compared with controls.26 However, there have been no studies of MT investigating the biophysical properties of neuronal circuits in untreated patients diagnosed with unipolar depression across the age spectrum.
The purpose of this study was to examine the biophysical integrity of specific cortical–subcortical circuits in patients diagnosed with unipolar MDD and non-depressed subjects of comparable age and gender. These include the dorsolateral prefrontal, the lateral orbitofrontal and the anterior cingulate circuits—circuits that have been identified as having a role in the regulation and modulation of affect, behavior and cognition.34,35 Cortical and subcortical structures that form components of these circuits were examined for their biophysical integrity. These include gray matter in the dorsolateral prefrontal, lateral orbitofrontal and anterior cingulate regions, the frontal white matter, head of the caudate nucleus, the putamen, the globus pallidus and the thalamus bilaterally. Where group differences are observed, we were interested in exploring the relationship of MTR to salient clinical variables. Based on earlier studies, including reports from our laboratory, we hypothesized that patients with MDD would demonstrate lower MTR in both neocortical and subcortical regions. We additionally hypothesized that the biophysical aberrations would involve both gray and white matter regions. Given the wide age range in our sample, we also hypothesized that age would be negatively correlated with MTR in both groups and throughout the examined circuits.
Materials and Methods
Clinical
Our study samples comprised 28 patients diagnosed with MDD and 31 non-depressed controls seen in Table 1. Patients and controls were recruited from the community through advertisements in newsletters and local newspapers. Inclusion criteria for subjects with MDD included: (1) a diagnosis of MDD using the DSM IV criteria;36 (2) Hamilton Depression Rating Scale scores of 15 or greater on the 17-item scale;37 (3) no evidence of dementia/cognitive impairment based on history and mental status examination; and (4) a score of 24 or greater on the Mini Mental State Exam.38 Exclusion criteria included: (1) presence of any concurrent axis 1 disorder; (2) history and mental status consistent with dementia and/or MMSE score of 24 or less; (3) presence of psychosis or history of psychosis; (4) prior history of substance abuse disorder; (5) significant head trauma; and (6) on active psychotropic medications.
Table 1. Demographic and clinical measures across subject groups.
| HC (N=31) | MDD (N=28) | Statistics | |||||
|---|---|---|---|---|---|---|---|
|
|
|
|
|||||
| Measures | Mean | s.d. | Mean | s.d. | F | d.f. | P-value |
| Age (years) | 59.13 | 15.71 | 57.89 | 13.27 | 0.11 | d.f.1,57 | 0.75 |
| Sex | 10 M/21 F | 9 M/19 F | χ2=0 | 1 | 0.99 | ||
| Highest education (years) | 15.26 | 2.61 | 14.71 | 2.88 | 0.58 | 1,57 | 0.45 |
| WTAR | 107.24 | 11.59 | 103.61 | 14.28 | 1.117 | 1,55 | 0.30 |
| MMSE | 29.03 | 0.95 | 28.75 | 1.48 | 0.78 | 1,57 | 0.38 |
| FSRP | 7.87 | 5.13 | 7.11 | 4.22 | 0.37 | 1,56 | 0.54 |
| HAM-D | 1.19 | 1.49 | 19.96 | 2.20 | 1493.73 | 1,57 | <0.001 |
| CES-D | 5.03 | 4.70 | 34.15 | 9.35 | 233.47 | 1,56 | <0.001 |
Abbreviations: CES-D, Center for Epidemiologic Studies of Depression; FSRP, Framingham Stroke Risk Profile; HAM-D, Hamilton Depression Rating Scale; HC, healthy controls; MDD, patients with major depression; MMSE, Mini-Mental Status Exam; WTAR, Wechsler Test of Adult Reading. Bold values indicate statistically significant results.
All patients received structured clinical interviews and comprehensive neuropsychological exams. All participants were age 30 years and older and the study was approved by the University of Illinois at Chicago Institutional Review Board and written informed consent was obtained from all participants. All participants were also evaluated by a board-certified or board-eligible psychiatrist (AK or OA).
All participants with MDD were free of antidepressant medication at least 2 weeks before the study. Healthy control subjects denied a history of depressed mood, required a score of 8 or lower on the Hamilton Depression Rating Scale and were free of unstable medical conditions. All participants were also administered the Center for Epidemiologic Studies of Depression (CES-D) Scale as an independent measure of depression severity.39 Participants received an assessment of vascular risk using the Framingham Stroke Risk Profile score.40
Image data acquisition
The MRI was performed on a Philips Achieva 3 T scanner (Philips Medical Systems, Best, The Netherlands) with a Philips' SENSE-Head-8 coil. The MT images were acquired using a three-dimensional (3D) spoiled gradient-echo sequence with multishot echo-planar imaging (EPI) readout: repetition time (TR)/echo time (TE) = 64/15 ms, flip angle = 9°, field of view (FOV) = 24 cm, 67 axial slices, slice thickness/gap = 2.2 mm/no gap, EPI factor = 7, reconstructed voxel size = 0.83 × 0.83 × 2.2 mm3, P reduction factor = 2, with a nonselective five-lobed Sinc-Gauss off-resonance MT prepulse (B1/Δf/dur = 10.5 μT/1.1 kHz/24.5 ms).41 The image slices were parallel to the anterior commissure–posterior commissure line. Before the MT scan, high-resolution 3D T1-weighted magnetization prepared rapid acquisition gradient-echo (MPRAGE) images were acquired: TR/TE = 8.4/3.9 ms, flip angle = 8°, FOV = 24 cm, 134 axial slices/no gap, reconstructed voxel size = 0.83 × 0.83 × 1.1 mm3, for image registration and placement of the regions of interest (ROI) for MTR analysis. In addition, T2-weighted fluid-attenuated inversion recovery (FLAIR) images were acquired using a turbo spin echo sequence: TR/inversion time (TI)/TE = 11000/2800/68 ms, FOV = 24 cm, 67 axial slices without gap, and reconstructed voxel size = 0.83 × 0.83 × 2.2 mm3, for delineation of white matter hyperintensity (WMH) areas.
Image processing
The MPRAGE images, FLAIR images and the MT images without the off-resonance MT prepulse (M0) were coregistered first and the images with the off-resonance MT prepulse (Ms) were then registered to the coregistered M0. The MTR values were calculated on a voxel-by-voxel basis using coregistered M0 and Ms with the formula MTR = (M0 − Ms)/M0. The ROIs were placed in periventricular frontal white matter, head of the caudate nucleus, putamen, thalamus and globus pallidus, as well as three cortical regions, i.e., anterior cingulate cortex (ACC), lateral orbitofrontal cortex (LOFC) and dorsolateral prefrontal cortex (DLPFC), in both hemispheres (see Figure 1).
Figure 1.
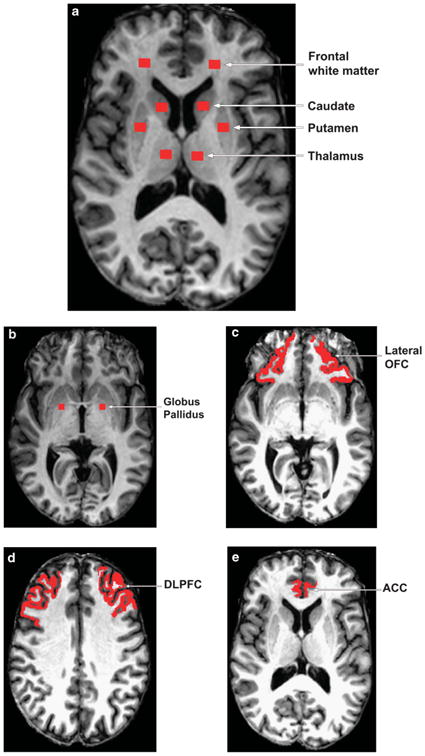
Regions of interest ((a) frontal white matter, caudate, putamen, thalamus; (b) globus pallidus; (c) lateral orbitofrontal cortex (LOFC); (d) dorsolateral prefrontal cortex (DLPFC); and (e) anterior cingulate cortex (ACC)) for magnetization transfer ratio analysis.
Care was taken to ensure consistent placement of ROIs for the MTR analysis. The slice displaying the most anterior margin of genu of the corpus callosum (Montreal Neurological Institute (MNI) coordinates [1, 32, 6]) was chosen as the reference slice for placing the following ROIs: periventricular frontal white matter, head of the caudate nucleus, putamen and thalamus, because this landmark could be easily and consistently identified across subjects and these structures are visible at this slice level42,43 (see Figure 1a). In the case that the putamen was not completely visualized on this slice, the next inferior slice was used instead.42,43 For the ROI of globus pallidus, the slice clearly displaying the anterior commissure (MNI: [0, 2, −4]) was chosen as the reference slice (see Figure 1b).
For the three cortical ROIs (see Figures 1c-e), we first used FreeSurfer to segment out the whole structures and then defined the ROIs within the segmented structures using the following landmarks: the same slice used for the subcortical ROIs (MNI: [z] = 6), the first slice superior to the orbits (MNI: [z] = − 16) and the first slice superior to the corpus callosum (MNI: [z] = 31) were used as the reference slices for the ROIs of ACC, LOFC and DLPFC. During the placement of the ROIs, the coregistered FLAIR images were closely examined to ensure the ROIs were not placed in the WMH areas. Moreover, we used constant volumes of ROIs in all of the defined regions except for the three cortical ROIs, i.e., the volume was 73.3 mm3 for the ROIs shown in Figure 1a and was relatively smaller 55 mm3 for globus pallidus (see Figure 1b). These volumes were chosen so that the MTR calculation in each subcortical ROI could be devoid of partial volume effects from adjoining region tissues on all the involved subjects. In addition, the volumes of three cortical ROIs were 142.9±47.1, 682.6±168.1 and 786.9±172.7 mm3 for ACC, LOFC and DLPFC, respectively (see Figures 1c–e). The generation of ROIs in the images and the calculation of MTR were performed using in-house developed programs.
Statistical analysis
Clinical and demographic measures were analyzed using univariate analysis of variance for continuous variables and χ2-tests for categorical variables. Group differences in MTR were assessed using univariate analysis of covariance controlling for age and sex. Significance level was set at P<0.05. Correlations between the MTRs and CES-D scores and duration of current depressive symptoms were analyzed using partial Pearson's product-moment correlations, as were correlations between the MTR and age. All statistical analyses were carried out using SPSS version 18. We used the false discovery rate44,45 approach to control for type I error rate for multiple comparisons.
Results
MTR values were compared between patients diagnosed with MDD and non-depressed controls of comparable age (Table 2). MTR in the head of the caudate nucleus on the right side was significantly lower in the MDD group when compared with controls (P = 0.007) (Figure 2). The only other region where the MTR differences between our patient and control groups approached statistical significance was in the left thalamus (P = 0.061) (see Table 2). Using the false discovery approach, for q values up to 0.30 (for false discovery rate bounds), the only significant difference between MDD and healthy control groups is in the hCaud_R, which is consistent with the P-value-based inference without adjusting for multiple comparisons.
Table 2. Magnetization transfer ratios across regions of interest and subject groups.
| HC (N= 31) | MDD (N=28) | Statistics | |||||
|---|---|---|---|---|---|---|---|
|
|
|
|
|||||
| Region | Mean | s.d. | Mean | s.d. | F1,55 | P-value | Cohen's d |
| hCaud R | 0.468 | 0.020 | 0.454 | 0.022 | 7.746 | 0.007 | 0.687 |
| hCaud_L | 0.469 | 0.021 | 0.464 | 0.018 | 1.220 | 0.274 | 0.265 |
| Thalamus_R | 0.526 | 0.047 | 0.512 | 0.037 | 1.852 | 0.179 | 0.320 |
| Thalamus L | 0.537 | 0.038 | 0.520 | 0.033 | 3.671 | 0.061 | 0.457 |
| LOFC_R | 0.463 | 0.020 | 0.455 | 0.024 | 1.927 | 0.171 | 0.357 |
| LOFC_L | 0.458 | 0.020 | 0.454 | 0.024 | 0.583 | 0.448 | 0.176 |
| AC_R | 0.450 | 0.021 | 0.450 | 0.026 | 0.031 | 0.860 | 0.030 |
| AC_L | 0.459 | 0.023 | 0.459 | 0.028 | 0.013 | 0.911 | −0.007 |
| FWM_R | 0.536 | 0.018 | 0.532 | 0.025 | 0.771 | 0.384 | 0.184 |
| FWM_L | 0.533 | 0.019 | 0.532 | 0.023 | 0.159 | 0.692 | 0.049 |
| Putamen_R | 0.464 | 0.033 | 0.461 | 0.030 | 0.326 | 0.570 | 0.085 |
| Putamen_L | 0.468 | 0.019 | 0.467 | 0.033 | 0.069 | 0.794 | 0.022 |
| GP_R | 0.499 | 0.042 | 0.489 | 0.041 | 1.243 | 0.270 | 0.254 |
| GP_L | 0.496 | 0.035 | 0.484 | 0.055 | 1.046 | 0.311 | 0.257 |
| DLPFC_R | 0.422 | 0.021 | 0.430 | 0.031 | 1.344 | 0.251 | −0.373 |
| DLPFC_L | 0.425 | 0.034 | 0.433 | 0.041 | 0.425 | 0.517 | −0.193 |
Abbreviations: AC, anterior cingulate; DLPFC, dorsal lateral prefrontal cortex; FWM, periventricular frontal white matter; GP, globus pallidus; HC, healthy controls; hCaud, head of caudate nucleus; L, left; LOFC, lateral orbitofrontal cortex; MDD, patients with major depression; R, right. Bold values indicate statistically significant results.
Figure 2.
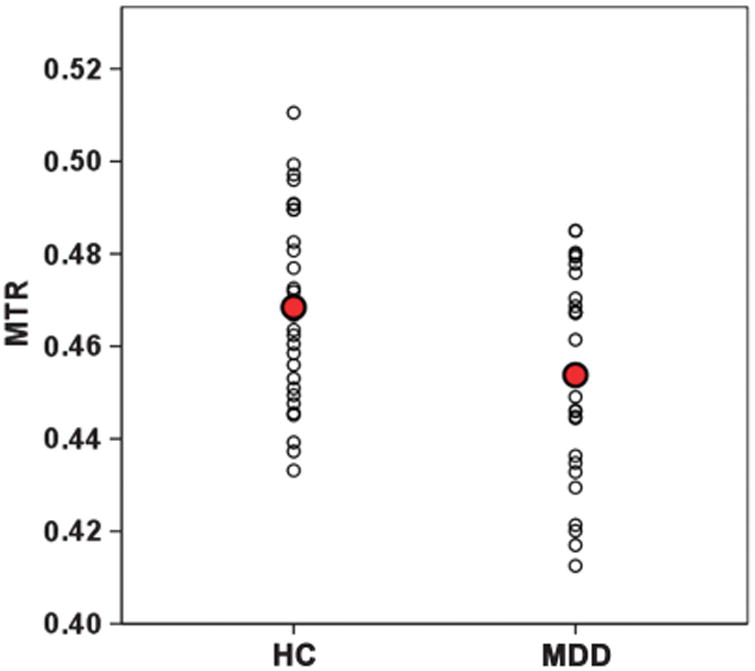
Scatterplot of magnetization transfer ratios (MTRs) in the head of the right caudate nucleus. HC, healthy controls; MDD, patients with major depression.
As MTR in the caudate was the only biophysical measure that differed significantly between the two groups, we examined the relationship of this measure to important clinical variables. MTR in the right caudate nucleus showed an inverse correlation with scores on the CES-D, a measure of depression severity, in the entire sample (r= −0.28, P = 0.034).39 MTR in the right caudate also correlated inversely with the duration of the current depressive episode (r= − 0.30, P = 0.02). No correlation was observed between MTR values in the right caudate and the overall Framingham cerebrovascular risk factor score after controlling for age.40
Age was negatively correlated with MTR values in both groups. In the non-depressed control group, the putamen bilaterally, the frontal white matter and the LOFC on the left side and the DLPFC on the right side showed statistically significant negative MTR correlations with age (Table 3). In the MDD group, most of the regions examined show a statistically significant decrease in MT ratios with age (see Table 3) (P<0.05).
Table 3. Correlation of magnetization transfer ratios across regions of interest with age.
| Region | HC (N = 31) | MDD (N = 28) | ||
|---|---|---|---|---|
|
|
|
|||
| r | P-value | r | P-value | |
| hCaud_R | 0.024 | 0.896 | −0.592 | 0.001 |
| hCaud_L | −0.105 | 0.573 | −0.456 | 0.015 |
| Thalamus_R | −0.285 | 0.120 | −0.323 | 0.093 |
| Thalamus_L | −0.276 | 0.133 | −0.220 | 0.261 |
| LOFC_R | −0.044 | 0.813 | −0.053 | 0.791 |
| LOFC_L | −0.461 | 0.009 | 0.005 | 0.980 |
| AC_R | −0.183 | 0.326 | −0.224 | 0.252 |
| AC_L | −0.227 | 0.220 | −0.465 | 0.013 |
| FWM_R | −0.279 | 0.129 | −0.493 | 0.008 |
| FWM_L | −0.511 | 0.003 | −0.534 | 0.003 |
| Putamen_R | −0.509 | 0.003 | −0.557 | 0.002 |
| Putamen_L | −0.416 | 0.020 | −0.586 | 0.001 |
| GP_R | −0.203 | 0.272 | −0.491 | 0.008 |
| GP_L | −0.114 | 0.543 | −0.202 | 0.302 |
| DLPFC_R | −0.470 | 0.008 | −0.431 | 0.022 |
| DLPFC_L | −0.276 | 0.132 | −0.441 | 0.019 |
Abbreviations: AC, anterior cingulate; DLPFC, dorsal lateral prefrontal cortex; FWM, periventricular frontal white matter; GP, globus pallidus; HC, healthy controls; hCaud, head of caudate nucleus; L, left; LOFC, lateral orbitofrontal cortex; MDD, patients with major depression; R, right. Bold values indicate statistically significant results.
Discussion
Our primary finding is that the macromolecular protein pool in the head of the caudate nucleus on the right side is compromised in patients with unipolar depression when compared with control subjects. Although lower macromolecular protein pools were identified in a few other brain regions germane to cortical– subcortical circuits, the effect sizes were much smaller and did not reach statistical significance. MTR values showed significant decline with increasing age in both depressed and control groups, with the depressed group demonstrating more widespread age-associated damage than the control group.
The caudate nucleus is a critical part of prefrontal–striatal– pallidal-thalamic–prefrontal circuits that have been consistently implicated in behavior.9–11,46 The head of the caudate nucleus has extensive connections with both cortical and subcortical nuclei.34,35 Of the five primary cortical–subcortical circuits, the dorsolateral prefrontal, the lateral oribitofrontal and the anterior cingulate circuits have been consistently implicated in behavioral abnormalities. The dorsolateral circuit originates in the principal sulcus and projects to the dorsolateral head of the caudate nucleus and from where it extends to the tail of the caudate. Projections from the rostral caudate extend to the globus pallidus/substantia nigra and from these sites to the thalamus. From the thalamus, projections extend to the principal sulcus of the prefrontal cortex, thereby completing the anatomic loop. The lateral orbitofrontal circuit originates in the orbitofrontal region around Brodmann area 10 and projects to the venteromedial section of the caudate nucleus from where additional projections extend to the globus pallidus interna, the substantial nigra, the thalamus and then back to the orbitofrontal region.34 The ventral striatum receives cortical input from multiple cortical and limbic regions including the anterior cingulate, hippocampus, the amygdala and the entorhinal cortex.34,35 The ventral striatum in turn projects to the globus pallidus and substantia nigra and the anterior cingulate circuit is completed by projections to the cingulate from the mediodorsal nucleus.34 Changes to the macromolecular pool in the head of the caudate could have ‘downstream’ molecular and cellular effects in other parts of the prefrontal–subcortical circuitry. These include other subcortical nuclei, relevant neocortical regions and the white matter tracts that connect these regions.
Our finding is consistent with several in vivo neuroimaging observations that implicate the caudate nucleus in the regulation of mood and the pathophysiology of mood disorders using a number of different methods.14,47,48 In an earlier report, our laboratory demonstrated smaller MT ratios in the caudate nucleus bilaterally in patients with type 2 diabetes and depression when compared with both healthy and diabetic controls.46 In a magnetic resonance spectroscopy study, Ajilore et al.47 reported lower Glx, a glutamate/glutamine composite measure, in the subcortical regions bilaterally, in a voxel that included the head of the caudate, in patients with diabetes and depression when compared with controls. Other investigators using magnetic resonance spectroscopy have demonstrated lower N-acetyl aspartate/creatine amplitude in the right caudate and higher choline concentrations when compared with controls.48 Structural and functional studies in patients diagnosed with clinical depression demonstrate abnormalities in the caudate including smaller volumes and blunted physiological response to reward outcomes.49–52 Collectively, these findings provide strong evidence that the head of the caudate nucleus and other subcortical and neocortical regions that are connected to it form integrated neuronal circuits that contribute to and are germane to the pathophysiology of mood disorders.
The caudate nucleus is involved in multimodal sensory, motor and emotional integration.53 Injury to the caudate therefore results in a broad array of sensorimotor and behavioral deficits, including changes in mood and cognitive functions.54 Abulia, apathy and neglect syndromes have all been described in patients after acute vascular injury to the caudate.54 Clinical depression has been reported in patients after vascular injury to the basal ganglia and frontal–subcortical circuits.55 Preclinical and human studies indicate that the caudate may have an important role in the control of approach–attachment behavior and affect regulation.56 A recent study identified lower neuronal density in the caudate nucleus in post-mortem studies of brain tissue from patients previously diagnosed with late-life depression.57 Thus, a combination of preclinical studies and clinical observations highlight an important, albeit complex, role for the caudate nucleus in the regulation and modulation of affect and mood.
Aging is associated with a decline in gray matter structure and physiology and white matter ultrastructure.58–62 Our findings indicate that, in the MDD group, MT ratios decline with age in multiple brain regions, whereas in the non-depressed control group, statistically significant MT changes with age occur more selectively. Almost all regions in both groups show a decline, albeit in some cases statistically insignificant, with increasing age. These findings suggest that the combination of a mood disorder and increasing age results in more striking age-related MTR changes than aging alone. This phenomenon may explain why patients diagnosed with late-life depression show more widespread reductions in MT ratios when compared with controls as opposed to the younger patient group utilized in this study.31,32
MT has been used to characterize the underlying neurobiology of a broad array of psychiatric and neurologic disorders.27–32,63 These include diseases in the neurodegenerative spectrum, disorders of myelination and inflammation and mood and psychotic disorders.26,28,29,31–33,63 In these disorders, lower MTR has been demonstrated in neocortical, subcortical and limbic regions, and include gray and white matter architecture.28,29,31–33,63 Lower MTR occurs in several brain regions across a broad spectrum of behavioral disorders as it more accurately reflects underlying neurobiological processes than any specific combination of clinical signs and symptoms. However, while there may not be any diagnostic specificity to MTR changes, the regional involvement may vary across disease states and provide patterns of impairment that helps clarify the circuits involved in the pathophysiology of clinical disorders.
Post-mortem MT and histopathology studies reveal that in the white matter lower MTR is associated with axonal loss and myelin compromise.21,22 The origin of the MTR signal in the gray matter is more complex and heterogeneous and may reflect multiple neurobiological aberrations.23–25,64 In the gray matter, cell membrane proteins and phospholipids contribute to the macromolecular density that contributes to the signal.23 Injury to cell membranes, reductions in dendritic density and in neuronal size and numbers may alone or in combination be responsible for the decrease in MTR in the gray matter.23 Wallerian degeneration, both anterograde and retrograde, secondary to proximal and/or distal axonal damage has also been implicated as a mechanism contributing to lower MTR in the gray matter.24,64 The strong afferent and efferent connectivity of the caudate makes this another credible neurobiological explanation for our finding. The relative contributions of these mechanisms to the MTR may vary across disease states. At a molecular level, stress-related changes in trophic hormones, altered immune functions and vascular mechanisms could plausibly contribute to the biophysical aberrations detected in our MDD sample.7,65–68 It is important to note that lower MTR in the gray matter is not a mere neuroimaging marker of atrophy and neuronal degeneration.64 Lower MTR has been identified in cortical and subcortical brain regions that are not atrophic.64
A few limitations of our approach need to be discussed. Although our data indicate that the head of the caudate nucleus on the right side is biophysically compromised in our patients diagnosed with depression, the current state of the technology does not permit us to be more anatomically precise regarding the subregion of the caudate where the abnormalities may be localized. Consequently, we are unable to extrapolate as to which of the three cortical-subcortical circuits may be selectively compromised in our sample. Also, the analysis of variance approach used in our statistical analysis assumes that measurements (observations) nested within the same brain are independent of one another. To incorporate correlations of observations obtained from different regions of a brain, a mixed-effects model would provide a more conservative approach to our data. However, our relatively small sample size precludes such an approach to our statistical analysis. Finally, while the lower patient-control MTR differences were far greater in the head of the caudate nucleus in this study, a few other regions, notably the thalamus on the left side, also showed lower MTR values that did not reach statistical significance. The relatively small sample sizes may have precluded some of these smaller effects from reaching statistical significance.
In summary, our findings are the first to demonstrate that the head of the caudate nucleus on the right side is biophysically abnormal in patients with unipolar MDD when compared with controls. The magnitude of the patient – control differences in this region far exceeded the smaller MTR changes that we identified in a few other regions of the brain germane to cortical–subcortical circuits. Given the heterogeneous nature of MDD and the diverse biological abnormalities that have been reported in these groups of disorders, other brain regions and tracts may also play important roles in the pathophysiology of clinical depression. Nonetheless, our finding strongly suggests that abnormalities in the head of the caudate may be a critical component to frontal–subcortical dysfunction that is often invoked in the pathophysiology of mood and related behavioral disorders.
Acknowledgments
This work was supported by National Institute of Mental Health Grants 5R01MH063764-09, 5R01MH073989-05, 5K23MH081175-04 and 1 K01AG0401 92-01A1. We thank Emma Rhodes, MA, Luan Phan, MD, Dulal Bhaumik PhD for their helpful comments and manuscript preparation. We also thank Peter van Zijl, PhD and Joseph S Gillen for the MT sequence, which was developed by the support of the NCRR resource Grant P41 RR015241.
Footnotes
Conflict of Interest: The authors declare no conflict of interest.
References
- 1.Kessler RC, Berglund P, Demler O, Jin R, Koretz D, Merikangas KR, et al. The epidemiology of major depressive disorder results from the National Comorbidity Survey Replication (NCS-R) JAMA. 2003;289:3095–3105. doi: 10.1001/jama.289.23.3095. [DOI] [PubMed] [Google Scholar]
- 2.Wittchen HU. The burden of mood disorders. Science. 2012;338:15. doi: 10.1126/science.1230817. [DOI] [PubMed] [Google Scholar]
- 3.Saveanu RV, Nemeroff CB. Etiology of depression: genetic and environmental factors. Psychiatr Clin N Am. 2012;35:51–71. doi: 10.1016/j.psc.2011.12.001. [DOI] [PubMed] [Google Scholar]
- 4.Belmaker RH, Agam G. Major depressive disorder. N Engl J Med. 2008;358:55–68. doi: 10.1056/NEJMra073096. [DOI] [PubMed] [Google Scholar]
- 5.Hasler G, Northoff G. Discovering imaging endophenotypes for major depression. Mol Psychiatry. 2011;16:604–619. doi: 10.1038/mp.2011.23. [DOI] [PubMed] [Google Scholar]
- 6.Nestler EJ. Epigenetics: stress makes its molecular mark. Nature. 2012;490:171–172. doi: 10.1038/490171a. [DOI] [PMC free article] [PubMed] [Google Scholar]
- 7.Duman RS, Aghajanian GK. Synaptic dysfunction in depression: potential therapeutic targets. Science. 2012;338:68–72. doi: 10.1126/science.1222939. [DOI] [PMC free article] [PubMed] [Google Scholar]
- 8.Berton O, Hahn CG, Thase ME. Are we getting closer to valid translational models for major depression? Science. 2012;338:75–79. doi: 10.1126/science.1222940. [DOI] [PubMed] [Google Scholar]
- 9.Cummings JL. The neuroanatomy of depression. J Clin Psychiatry. 1993;54(Suppl):14–20. [PubMed] [Google Scholar]
- 10.Alexopoulos GS. Frontostriatal and limbic dysfunction in late-life depression. Am J Geriatr Psychiatry. 2002;10:687–695. [PubMed] [Google Scholar]
- 11.Chow TW, Cummings JL. Frontal–subcortical circuits Miller BL. In: C J, editor. The Human Frontal Lobes. The Guilford Press; New York, NY, USA: 1999. pp. 3–26. [Google Scholar]
- 12.Kumar A, Newberg A, Alavi A, Berlin J, Smith R, Reivich M. Regional cerebral glucose metabolism in late-life depression and Alzheimer disease: a preliminary positron emission tomography study. Proc Natl Acad Sci USA. 1993;90:7019–7023. doi: 10.1073/pnas.90.15.7019. [DOI] [PMC free article] [PubMed] [Google Scholar]
- 13.Kumar A, Jin Z, Bilker W, Udupa J, Gottlieb G. Late-onset minor and major depression: early evidence for common neuroanatomical substrates detected by using MRI. Proc Natl Acad Sci USA. 1998;95:7654–7658. doi: 10.1073/pnas.95.13.7654. [DOI] [PMC free article] [PubMed] [Google Scholar]
- 14.Vythilingam M, Charles HC, Tupler LA, Blitchington T, Kelly L, Krishnan KR. Focal and lateralized subcortical abnormalities in unipolar major depressive disorder: an automated multivoxel proton magnetic resonance spectroscopy study. Biol Psychiatry. 2003;54:744–750. doi: 10.1016/s0006-3223(02)01908-x. [DOI] [PubMed] [Google Scholar]
- 15.Sheline YI, Price JL, Yan Z, Mintun MA. Resting-state functional MRI in depression unmasks increased connectivity between networks via the dorsal nexus. Proc Natl Acad Sci USA. 2010;107:11020–11025. doi: 10.1073/pnas.1000446107. [DOI] [PMC free article] [PubMed] [Google Scholar]
- 16.Alexopoulos GS, Murphy CF, Gunning-Dixon FM, Glatt CE, Latoussakis V, Kelly RE, Jr, et al. Serotonin transporter polymorphisms, microstructural white matter abnormalities and remission of geriatric depression. J Affect Disord. 2009;119:132–141. doi: 10.1016/j.jad.2009.03.004. [DOI] [PMC free article] [PubMed] [Google Scholar]
- 17.Eng J, Ceckler TL, Balaban RS. Quantitative 1H magnetization transfer imaging in vivo. Magn Reson Med. 1991;17:304–314. doi: 10.1002/mrm.1910170203. [DOI] [PubMed] [Google Scholar]
- 18.Balaban RS, Ceckler TL. Magnetization transfer contrast in magnetic resonance imaging. Magn Reson Q. 1992;8:116–137. [PubMed] [Google Scholar]
- 19.Grossman RI. Magnetization transfer in multiple sclerosis. Ann Neurol. 1994;36(Suppl 1):S97–S99. doi: 10.1002/ana.410360722. [DOI] [PubMed] [Google Scholar]
- 20.Henkelman RM, Stanisz GJ, Graham SJ. Magnetization transfer in MRI: a review. NMR Biomed. 2001;14:57–64. doi: 10.1002/nbm.683. [DOI] [PubMed] [Google Scholar]
- 21.Van Waesberghe JHTM, Kamphorst W, De Groot CJ, van Walderveen MA, Castelijns JA, Ravid R, et al. Axonal loss in multiple sclerosis lesions: magnetic resonance imaging insights into substrates of disability. Ann Neurol. 1999;46:747–754. doi: 10.1002/1531-8249(199911)46:5<747::aid-ana10>3.3.co;2-w. [DOI] [PubMed] [Google Scholar]
- 22.Schmierer K, Tozer DJ, Scaravilli F, Altmann DR, Barker GJ, Tofts PS, et al. Quantitative magnetization transfer imaging in postmortem multiple sclerosis brain. J Magn Reson Imag. 2007;26:41–51. doi: 10.1002/jmri.20984. [DOI] [PMC free article] [PubMed] [Google Scholar]
- 23.Bagary MS, Symms MR, Barker GJ, Mutsatsa SH, Joyce EM, Ron MA, et al. Gray and white matter brain abnormalities in first-episode schizophrenia inferred from magnetization transfer imaging. Arch Gen Psychiatry. 2003;60:779–788. doi: 10.1001/archpsyc.60.8.779. [DOI] [PubMed] [Google Scholar]
- 24.Khaleeli Z, Altmann DR, Cercignani M, Ciccarelli O, Miller DH, Thompson AJ. Magnetization transfer ratio in gray matter: a potential surrogate marker for progression in early primary progressive multiple sclerosis. Arch Neurol. 2008;65:1454–1459. doi: 10.1001/archneur.65.11.1454. [DOI] [PubMed] [Google Scholar]
- 25.Steens SC, Bosma GP, Steup-Beekman GM, le Cessie S, Huizinga TW, van Buchem MA. Association between microscopic brain damage as indicated by magnetization transfer imaging and anticardiolipin antibodies in neuropsychiatric lupus. Arthritis Res Ther. 2006;8:R38. doi: 10.1186/ar1892. [DOI] [PMC free article] [PubMed] [Google Scholar]
- 26.Bruno SD, Barker GJ, Cercignani M, Symms M, Ron MA. A study of bipolar disorder using magnetization transfer imaging and voxel-based morphometry. Brain. 2004;127:2433–2440. doi: 10.1093/brain/awh274. [DOI] [PubMed] [Google Scholar]
- 27.Hanyu H, Asano T, Sakurai H, Takasaki M, Shindo H, Abe K. Magnetisation transfer measurements of the subcortical grey and white matter in Parkinson's disease with and without dementia and in progressive supranuclear palsy. Neuroradiology. 2001;43:542–546. doi: 10.1007/s002340100558. [DOI] [PubMed] [Google Scholar]
- 28.Hanyu H, Asano T, Sakurai H, Takasaki M, Shindo H, Abe K. Magnetization transfer measurements of the hippocampus in the early diagnosis of Alzheimer's disease. J Neurol Sci. 2001;188:79–84. doi: 10.1016/s0022-510x(01)00553-6. [DOI] [PubMed] [Google Scholar]
- 29.Hanyu H, Shimizu S, Tanaka Y, Kanetaka H, Iwamoto T, Abe K. Differences in magnetization transfer ratios of the hippocampus between dementia with Lewy bodies and Alzheimer's disease. Neurosci Lett. 2005;380:166–169. doi: 10.1016/j.neulet.2005.01.088. [DOI] [PubMed] [Google Scholar]
- 30.Hickman SJ, Toosy AT, Jones SJ, Altmann DR, Miszkiel KA, MacManus DG, et al. Serial magnetization transfer imaging in acute optic neuritis. Brain. 127:692–700. doi: 10.1093/brain/awh076. [DOI] [PubMed] [Google Scholar]
- 31.Gunning-Dixon FM, Hoptman MJ, Lim KO, Murphy CF, Klimstra S, Latoussakis V, et al. Macromolecular white matter abnormalities in geriatric depression: a magnetization transfer imaging study. Am J Geriatr Psychiatry. 2008;16:255–262. doi: 10.1097/JGP.0b013e3181602a66. [DOI] [PubMed] [Google Scholar]
- 32.Kumar A, Gupta RC, Albert Thomas M, Alger J, Wyckoff N, Hwang S. Biophysical changes in normal-appearing white matter and subcortical nuclei in late-life major depression detected using magnetization transfer. Psychiatry Res. 2004;130:131–140. doi: 10.1016/j.pscychresns.2003.12.002. [DOI] [PubMed] [Google Scholar]
- 33.Zhang TJ, Wu QZ, Huang XQ, Sun XL, Zou K, Lui S, et al. Magnetization transfer imaging reveals the brain deficit in patients with treatment-refractory depression. J Affect Disord. 2009;117:157–161. doi: 10.1016/j.jad.2009.01.003. [DOI] [PubMed] [Google Scholar]
- 34.Alexander GE, DeLong MR, Strick PL. Parallel organization of functionally segregated circuits linking basal ganglia and cortex. Annu Rev Neurosci. 1986;9:357–381. doi: 10.1146/annurev.ne.09.030186.002041. [DOI] [PubMed] [Google Scholar]
- 35.Selemon LD, Goldman-Rakic PS. Longitudinal topography and interdigitation of corticostriatal projections in the rhesus monkey. J Neurosci. 1985;5:776–794. doi: 10.1523/JNEUROSCI.05-03-00776.1985. [DOI] [PMC free article] [PubMed] [Google Scholar]
- 36.American Psychiatric Association. Diagnostic and Statistical Manual of Mental Disorders. 4th. APA; Washington, DC, USA: 1994. [Google Scholar]
- 37.Hamilton M. A rating scale for depression. J Neurol Neurosurg Psychiatry. 1960;23:56–62. doi: 10.1136/jnnp.23.1.56. [DOI] [PMC free article] [PubMed] [Google Scholar]
- 38.Folstein MF, Folstein SE, McHugh PR. ‘Mini-mental state’. A practical method for grading the cognitive state of patients for the clinician. J Psychiatr Res. 1975;12:18–198. doi: 10.1016/0022-3956(75)90026-6. [DOI] [PubMed] [Google Scholar]
- 39.Radloff LS. The CES-D scale. Appl Psychol Meas. 1977;1:385–401. [Google Scholar]
- 40.Wolf PA, D'Agostino RB, Belanger AJ, Kannel WB. Probability of stroke: a risk profile from the Framingham Study. Stroke. 1991;22:312–318. doi: 10.1161/01.str.22.3.312. [DOI] [PubMed] [Google Scholar]
- 41.Smith SA, Farrell JA, Jones CK, Reich DS, Calabresi PA, van Zijl PC. Pulsed magnetization transfer imaging with body coil transmission at 3 Tesla: feasibility and application. Magn Reson Med. 2006;56:866–875. doi: 10.1002/mrm.21035. [DOI] [PubMed] [Google Scholar]
- 42.Chau W, McIntosh AR. The Talairach coordinate of a point in the MNI space: how to interpret it. NeuroImage. 2005;25:408–416. doi: 10.1016/j.neuroimage.2004.12.007. [DOI] [PubMed] [Google Scholar]
- 43.Jenkinson M, Beckmann CF, Behrens TE, Woolrich MW, Smith SM. FSL. NeuroImage. 2012;62:782–790. doi: 10.1016/j.neuroimage.2011.09.015. [DOI] [PubMed] [Google Scholar]
- 44.Benjamini Y, Hochberg Y. Controlling the FDR: a practical and powerful approach to multiple testing. J R Stat Soc Ser B. 1995;57:289–300. [Google Scholar]
- 45.Bhaumik DK, Roy A, Lazar NA, Kapur K, Aryal S, Sweeney JA, et al. Hypothesis testing, power and sample size determination for between group comparisons in fMRI experiments. Statist Methodol. 2009;6:133–149. doi: 10.1016/j.stamet.2008.05.003. [DOI] [PMC free article] [PubMed] [Google Scholar]
- 46.Kumar A, Gupta R, Thomas A, Ajilore O, Hellemann G. Focal subcortical biophysical abnormalities in patients diagnosed with type 2 diabetes and depression. Arch Gen Psychiatry. 2009;66:324–330. doi: 10.1001/archgenpsychiatry.2008.548. [DOI] [PubMed] [Google Scholar]
- 47.Ajilore O, Haroon E, Kumaran S, Darwin C, Binesh N, Mintz J, et al. Measurement of brain metabolites in patients with type 2 diabetes and major depression using proton magnetic resonance spectroscopy. Neuropsychopharmacology. 2007;32:1224–1231. doi: 10.1038/sj.npp.1301248. [DOI] [PubMed] [Google Scholar]
- 48.Gabbay V, Hess DA, Liu S, Babb JS, Klein RG, Gonen O, et al. Lateralized caudate metabolic abnormalities in adolescent major depressive disorder: a proton MR spectroscopy study. Am J Psychiatry. 2007;164:1881–1889. doi: 10.1176/appi.ajp.2007.06122032. [DOI] [PMC free article] [PubMed] [Google Scholar]
- 49.Butters MA, Aizenstein HJ, Hayashi KM, Meltzer CC, Seaman J, Reynolds CF, III, et al. Three-dimensional surface mapping of the caudate nucleus in late-life depression. Am J Geriatr Psychiatry. 2009;17:4–12. doi: 10.1097/JGP.0b013e31816ff72b. [DOI] [PMC free article] [PubMed] [Google Scholar]
- 50.Pizzagalli DA, Holmes AJ, Dillon DG, Goetz EL, Birk JL, Bogdan R, et al. Reduced caudate and nucleus accumbens response to rewards in unmedicated individuals with major depressive disorder. Am J Psychiatry. 2009;166:702–710. doi: 10.1176/appi.ajp.2008.08081201. [DOI] [PMC free article] [PubMed] [Google Scholar]
- 51.Kim MJ, Hamilton JP, Gotlib IH. Reduced caudate gray matter volume in women with major depressive disorder. Psychiatry Res. 2008;164:114–122. doi: 10.1016/j.pscychresns.2007.12.020. [DOI] [PMC free article] [PubMed] [Google Scholar]
- 52.Krishnan KR, McDonald WM, Escalona PR, Doraiswamy PM, Na C, Husain MM, et al. Magnetic resonance imaging of the caudate nuclei in depression. Preliminary observations. Arch Gen Psychiatry. 1992;49:553–557. doi: 10.1001/archpsyc.1992.01820070047007. [DOI] [PubMed] [Google Scholar]
- 53.Joseph R. Caudate Nucleus Neuropsychiatry, Neuropsychology, Clinical Neuroscience. Academic Press; New York, NY, USA: 2000. [Google Scholar]
- 54.Kumral E, Evyapan D, Balkir K. Acute caudate vascular lesions. Stroke. 1999;30:100–108. doi: 10.1161/01.str.30.1.100. [DOI] [PubMed] [Google Scholar]
- 55.Starkstein SE, Robinson RG, Berthier ML, Parikh RM, Price TR. Differential mood changes following basal ganglia vs thalamic lesions. Arch Neurol. 1988;45:725–730. doi: 10.1001/archneur.1988.00520310031013. [DOI] [PubMed] [Google Scholar]
- 56.Villablanca JR. Why do we have a caudate nucleus? Acta Neurobiol Exp (Wars) 2010;70:95–105. doi: 10.55782/ane-2010-1778. [DOI] [PubMed] [Google Scholar]
- 57.Khundakar A, Morris C, Oakley A, Thomas AJ. Morphometric analysis of neuronal and glial cell pathology in the caudate nucleus in late-life depression. Am J Geriatr Psychiatry. 2011;19:132–141. doi: 10.1097/JGP.0b013e3181df4642. [DOI] [PubMed] [Google Scholar]
- 58.Westlye LT, Walhovd KB, Dale AM, Bjørnerud A, Due-Tønnessen P, Engvig A, et al. Life-span changes of the human brain white matter: diffusion tensor imaging (DTI) and volumetry. Cereb Cortex. 2010;20:2055–2068. doi: 10.1093/cercor/bhp280. [DOI] [PubMed] [Google Scholar]
- 59.Moseley M. Diffusion tensor imaging and aging—a review. NMR Biomed. 2002;15:553–560. doi: 10.1002/nbm.785. [DOI] [PubMed] [Google Scholar]
- 60.Rovaris M, Iannucci G, Cercignani M, Sormani MP, De Stefano N, Gerevini S, et al. Age-related changes in conventional, magnetization transfer, and diffusion-tensor MR imaging findings: study with whole-brain tissue histogram analysis. Radiology. 2003;227:731–738. doi: 10.1148/radiol.2273020721. [DOI] [PubMed] [Google Scholar]
- 61.Silver NC, Barker GJ, MacManus DG, Tofts PS, Miller DH. Magnetisation transfer ratio of normal brain white matter: a normative database spanning four decades of life. J Neurol Neurosurg Psychiatry. 1997;62:223–228. doi: 10.1136/jnnp.62.3.223. [DOI] [PMC free article] [PubMed] [Google Scholar]
- 62.Charlton RA, Schiavone F, Barrick TR, Morris RG, Markus HS. Diffusion tensor imaging detects age related white matter change over a 2 year follow-up which is associated with working memory decline. J Neurol Neurosurg Psychiatry. 2010;81:13–19. doi: 10.1136/jnnp.2008.167288. [DOI] [PubMed] [Google Scholar]
- 63.Foong J, Symms MR, Barker GJ, Maier M, Woermann FG, Miller DH, et al. Neuro-pathological abnormalities in schizophrenia: evidence from magnetization transfer imaging. Brain. 2001;124:882–892. doi: 10.1093/brain/124.5.882. [DOI] [PubMed] [Google Scholar]
- 64.Audoin B, Davies G, Rashid W, Fisniku L, Thompson AJ, Miller DH. Voxel-based analysis of grey matter magnetization transfer ratio maps in early relapsing remitting multiple sclerosis. Multiple Sclerosis. 2007;13:483–489. doi: 10.1177/1352458506070450. [DOI] [PubMed] [Google Scholar]
- 65.Haroon E, Raison CL, Miller AH. Psychoneuroimmunology meets neuropsycho-pharmacology: translational implications of the impact of inflammation on behavior. Neuropsychopharmacology. 2012;37:137–162. doi: 10.1038/npp.2011.205. [DOI] [PMC free article] [PubMed] [Google Scholar]
- 66.Raison CL, Capuron L, Miller AH. Cytokines sing the blues: inflammation and the pathogenesis of depression. Trends Immunol. 2006;27:24–31. doi: 10.1016/j.it.2005.11.006. [DOI] [PMC free article] [PubMed] [Google Scholar]
- 67.Alexopoulos GS, Meyers BS, Young RC, Campbell S, Silbersweig D, Charlson M. ‘Vascular depression’ hypothesis. Arch Gen Psychiatry. 1997;54:915–922. doi: 10.1001/archpsyc.1997.01830220033006. [DOI] [PubMed] [Google Scholar]
- 68.Krishnan KR, Hays JC, Blazer DG. MRI-defined vascular depression. Am J Psychiatry. 1997;154:497–501. doi: 10.1176/ajp.154.4.497. [DOI] [PubMed] [Google Scholar]