Abstract
With the development of genomic techniques, the demand for new methods that can handle high-throughput genome-wide data effectively is becoming stronger than ever before. Compressed sensing (CS) is an emerging approach in statistics and signal processing. With the CS theory, a signal can be uniquely reconstructed or approximated from its sparse representations, which can therefore better distinguish different types of signals. However, the application of CS approach to genome-wide data analysis has been rarely investigated. We propose a novel CS-based approach for genomic data classification and test its performance in the subtyping of leukemia through gene expression analysis. The detection of subtypes of cancers such as leukemia according to different genetic markups is significant, which holds promise for the individualization of therapies and improvement of treatments. In our work, four statistical features were employed to select significant genes for the classification. With our selected genes out of 7,129 ones, the proposed CS method achieved a classification accuracy of 97.4% when evaluated with the cross validation and 94.3% when evaluated with another independent data set. The robustness of the method to noise was also tested, giving good performance. Therefore, this work demonstrates that the CS method can effectively detect subtypes of leukemia, implying improved accuracy of diagnosis of leukemia.
Keywords: Compressed sensing, classification, gene expression, leukemia
1. Introduction
Recently, tons of genome-wide data have been generated and the quantity of the data is still increasing dramatically. A common property of genome-wide data is the high dimension, with thousands to millions of measurements (e.g. genes, probes). Most of the traditional classification methods become inapplicable or perform poorly in the subtyping of cancers from genome-wide data.1 In this paper, we propose a novel compressed sensing (CS) based classification approach to solve the problem.
Compressed sensing, also called compressive sampling, has been developed recently in statistics and signal processing and becomes a powerful tool in many applications. CS theory goes against the traditional Shannon’s celebrated theorem: the sample rate should be at least twice the maximum signal frequency (Nyquist rate). It demonstrates that the compressible signals can be recovered from far fewer samples than that needed by the Nyquist sampling theorem.2 Recently, CS has been successfully used in multiple disciplines such as medical imaging,3 computational biology,4 geophysical data analysis,5 and radar technology.6 Moreover, CS method has been claimed to be applicable in solving signal classification problems.7,8 However, the application of CS theory to genome-wide data analysis has been limited. For example, Kim et al. classified multiple cancer types by using multiclass sparse logistic regression from gene expression data and they achieved high prediction accuracy.1 They named the method as sparse one-against-all logistic (SOVAL). We recently used the CS method to classify chromosomes from multicolor fluorescence in situ hybridization (M-FISH) images,9 and to integrate gene copy number and gene expression data for identifying gene groups susceptible to cancers.10 In these studies, we demonstrated the advantages of the CS methods in compact representation of genomic data, resulting in higher classification accuracies.
In this work, we develop a CS-based classifier and further apply it to subtyping of leukemia based on gene expression analysis. Leukemia, like other cancers, associates with genetic disorders. Leukemia has four main categories: acute lymphoblastic leukemia (ALL), acute myelogenous leukemia (AML), chronic lymphocytic leukemia (CLL), and chronic myelogenous leukemia (CML) (http://www.webmd.com/cancer/tc/leukemia-topic-overview). It is desirable that different categories have individualized treatments and therapies.11 Thus, it is significant to identify the subtypes of leukemia so that these subtypes can be targeted with different drugs or treatments. Microarray-based gene expression profiling offers an opportunity for quantitative analysis of leukemia.12 Mills et al. built a diagnostic classification model based on gene expression profiles to distinguish three groups: AML, MDS (myelodysplastic syndrome) and none-of-the-targets (neither leukemia nor MDS).13 Yeoh et al. analyzed the pattern of genes expressed in leukemic blasts from ALL patients to investigate whether gene expression profiling could enhance risk assignment of treatments.14 Zhang and Ke classified ALL and AML by gene expression data using support vector machine e.g. SVM and CSVM approaches.15 The testing error rate of the classification was 2 out of 34 samples. Sun et al. developed a rough sets–based method to classify subtypes of leukemia from gene expression data.16 The rate of the misclassification was 3 out of 38 samples. Leukemia can also be studied with gene copy number analysis.17 A comparison of different classification approaches for gene expression analysis can be found in the work of Dudoit et al.18
The goal of this work is to develop CS-based classification approach and apply it to distinguish two subtypes of leukemia: ALL and AML, from gene expression data. To test the performance of our proposed CS-based classification method, we applied it to the analysis of a famous leukemia dataset used by many studies.11 When the tests were performed on the same datasets, the proposed CS-based method shows potential advantages over existing ones such as the weighted vote,11 SVM,15 sparse logistic regression method,1 and rough sets method,16 demonstrating improved classification rates with fewer informative genes. The classification accuracy of the CS detector is 97.4% when validated with the leave one out (LOO) method, and is 94.3% when tested using independent data, where one set of 38 patients (27 ALL, 11 AML) was used as training data while another dataset of 35 patients (21 ALL and 14 AML) was used as independent testing data.
2. Methods
2.1. Data collection
The leukemia dataset we used in this study was obtained from a public database available from the website of Gene Pattern in Broad Institute (http://www.broadinstitute.org/cancer/software/genepattern/datasets/). The training data have 38 bone marrow samples (27 ALL and 11 AML) and the testing data have 35 bone marrow samples (21 ALL and 14 AML). The number of total genes for the expression data is 7,129. A quantitative expression level was obtained for each gene.11
2.2. Feature design
To distinguish the two groups (e.g. AML and ALL), it is helpful to extract significant genes, also called informative genes or marker genes, from the overall 7,129 gene expression data. For each gene, we extracted four feature characteristics: the standard deviation of each group (Std1 and Std2), the absolute value of the mean difference of the two groups (MD), and the Pearson’s linear correlation coefficient (Corr) between the expression samples and a class distinction vector cd = [1, …, 0, …]; cd is a vector that consists ‘1’s in one class (ALL) and ‘0’s in the other class (AML), respectively. Thus for the ith gene, we have a four-dimensional feature vector as follows:
| (1) |
where i = 1, 2, …, N, and N is the number of genes. Each feature is normalized by its overall maximum value so that each element of Vi ∈ [0, 1]. Informative genes were selected by setting the threshold values of Vi, yielding M ≪ N selected genes. For an informative gene, we expect the expression levels from different patients within the same subtype to be similar. We also expect that the differences between the expression levels from two subtypes of leukemia are relatively high. In addition, it is easy to understand that, if the correlation between the expression values of a gene with the class distinction vector cd is higher; the gene is more likely to be a significant marker to distinguish the two subtypes of leukemia. According to the above analysis, those genes with low standard deviations within each group, high mean differences between the groups and high Pearson’s correlations are significant for the classification. Based on this analysis, we selected different numbers of genes out of 7,129 genes by setting different thresholds in the significance testing of these features, which lead to different classification accuracies, as shown in Table 1.
Table 1.
By choosing different feature vectors, informative genes of different numbers were picked out, which lead to different detection accuracies.
| Number of genes | LOO accuracy (%) | Independent testing accuracy (%) |
|---|---|---|
| 1 | 97.4 | 88.6 |
| 2 | 97.4 | 94.3 |
| 3 | 94.7 | 94.3 |
| 6 | 94.7 | 91.4 |
| 16 | 97.4 | 80.0 |
Note: The accuracy was evaluated by the LOO cross-validation and independent data testing, respectively.
2.3. Compressed sensing based classification
2.3.1. Training of the transformation matrixΦ
To compress the original data by using a few informative genes, we design a transformation matrix Φ. The training of transformation matrix can be formulated as a sparse representation problem as shown in Eq. (2),
| (2) |
where Y = {yi} ∈ ℝM×c are the gene expressions of selected genes for the total samples/patients; yi is the gene expressions of selected genes for the ith sample; c is the total number of samples; S = {si} ∈ ℝN×c are the gene expressions of all the genes for the total samples/patients, and M ≪ N. The matrix Φ ∈ ℝM×N is a sparse transformation matrix. With most of the entries are ‘0’s, the transformation matrix Φ projects the original signal S to a much smaller dimensional signal Y. Through this projection, the original gene expression data can be significantly reduced or compactly represented by the informative genes, which can lead to improved classification subsequently. The training of Φ through data S and selected data Y is given in the following.
Assume there are c1 number of training samples in group 1, c2 number of training samples in group 2, and so forth, cn number of training samples in group n, and c = c1 + c2 + ⋯ + cn for S = [s1, s2, …, sc] ∈ ℝN×c and Y = [y1, y2, …, yc] ∈ ℝM×c.
The transpose of Eq. (2) gives:
| (3) |
Let (ΦT)j ∈ ℝN×1 denotes the jth column of ΦT, and (YT)j ∈ ℝc×1 denotes the jth column of YT, where j = 1, 2, …, M. Then Eq. (3) can be rewritten as:
| (4) |
where ST ∈ ℝc×N. The linear system given by (4) is an underdetermined system, which can be solved by using l−1 norm minimization algorithm such as Homotopy method, or the Least Angle Regression (LARS) method.19 The l−1 norm optimization problem reads:
| (5) |
where ‖(ΦT)j‖1 is the l−1 norm of the vector (ΦT)j, i.e. sum of the absolute values of entries in vector (ΦT)j.
It can be seen that by introducing the sparse transformation matrix Φ, we project the original signal si ∈ ℝN×1 to a much smaller dimensional signal Φsi ∈ ℝM×1. In the following process, instead of dealing with the original signal, we only use Φsi ∈ ℝM×1 and ΦΦT ∈ ℝM×M in the construction of the compressive detector t̃, leading to a fast classification.
2.3.2. Classification
Equation (2) can be rewritten in a vector form as:
| (6) |
where ni ~ 𝒩 (0, σ2IN) is i.i.d. Gaussian noise in the observation signal. To test whether a given vector yi ∈ ℝM belongs to a known signal si ∈ ℝN or not, we set the hypothesis as follows20:
| (7) |
From (7), we have yi ~ 𝒩 (0, σ2ΦΦT) under H̃0, yi ~ 𝒩 (Φsi, σ2ΦΦT) under H̃1, which gives the probability density functions:
| (8) |
and
| (9) |
Thus, the likelihood ratio test is: if , yi is under H̃0; otherwise, yi is under H̃1. The likelihood ratio test can be simplified by taking a logarithm and the compressive classification detector t̃ can be derived as following:
| (10) |
where t̃ = {t̃i} ∈ ℝc, S = {si} ∈ ℝN×c, i = 1, 2, …, c.
It has been proven by Davenport et al.20 that under the condition of H̃0:
| (11) |
while under the condition of H̃1
| (12) |
We then calculate the differences of the standard score of t̃i(dsti) under the two conditions:
| (13) |
where
We assign a class ID label to the vector yi:
| (14) |
If Identity(yi) falls from 1 to c1, yi belongs to class 1; if Identity(yi) falls from c1 + 1 to c2, yi belongs to class 2.
2.4. Validation
2.4.1. Cross-validation with leave-one-out method
A cross-validation method, Leave-One-Out (LOO),21 is widely used in evaluating the detection accuracy of different classes. It was employed here to evaluate the performances of the proposed CS-based classification approach. A single bone marrow sample from the original 38 samples/patients was taken as the validation data, while the remaining 37 samples/patients were taken as the training data. This procedure was repeated 38 times until every sample in the database was used once as the validation data.
2.4.2. Validation with independent data
To overcome potential biases introduced by LOO method, an independent data set containing 35 bone marrow samples (21 ALL and 14 AML) has been used as testing data. The compressive detector was trained by another set of 38 patients (27 ALL, 11 AML), which was used as the classifier.
2.5. Robustness to noise
To test the robustness of the proposed CS method, we simulated Gaussian noise n in Eq. (6) with different levels. The degree of signal to noise level is expressed by the signal-to-noise ratio (SNR), which is an important metric to quantify how much a signal has been contaminated by noise. SNR is defined as:
| (15) |
where Var(s) is the variance of the signal and Var(n) is the variance of the noise. In this work, the classification accuracy ratio with/without noise under different SNR levels is used to evaluate the robustness of the method to noise.
3. Results
To test the effectiveness of our proposed CS classification approach, we took the classification of the two subtypes of leukemia (ALL and AML) as an example. Informative genes with different numbers were chosen from 7,129 genes based on four statistical features with different levels, as presented in Table 1. The performance of the classification was evaluated by both the LOO cross-validation and the independent dataset testing. The validation results are also listed in Table 1. The accuracy of LOO cross-validation test is high (94.7% to 97.4%). The independent data set testing has lower classification accuracy (80.0% to 94.3%) compared with LOO validation. Note that the classification accuracy does not always improve with the increase of informative genes.
Table 2 shows the top six informative genes with the lowest standard deviations (Std1, Std2), the highest mean difference (MD) and highest Pearson’s linear correlation (Corr). The most significant gene in classifying ALL and AML is marked as X95735, called “Zyxin.” The top six informative genes are: “Zyxin,” “Adipsin,” “MCL1,” “Cystatin C,” “Lectin,” and “p62.”
Table 2.
The first six significant genes are listed, which are selected with the lowest standard deviations, the highest mean difference and Pearson’s linear correlation.
| Gene ID | Gene annotation |
|---|---|
| X95735 | Zyxin |
| M84526 | Adipsin |
| L08246 | MCL1 |
| M27891 | Cystatin C |
| M57710 | Lectin |
| U46751 | p62a |
Note:
Phosphotyrosine independent ligand p62 for the Lck SH2 domain mRNA.
The accuracies of the classification based on the proposed CS method are compared with the results of the previous work on the same datasets,1,11,15,16 as shown in Table 3. Note that the proposed CS classification approach achieves higher classification accuracy with only two informative genes i.e. 97.4% validated by the cross-validation and 94.3% validated by an independent dataset. These are higher than all other classifiers, except the SVM approach by Zhang and Ke.15 However, the SVM approach used 6,817 genes to achieve a classification rate of 100% while our method used a few genes.
Table 3.
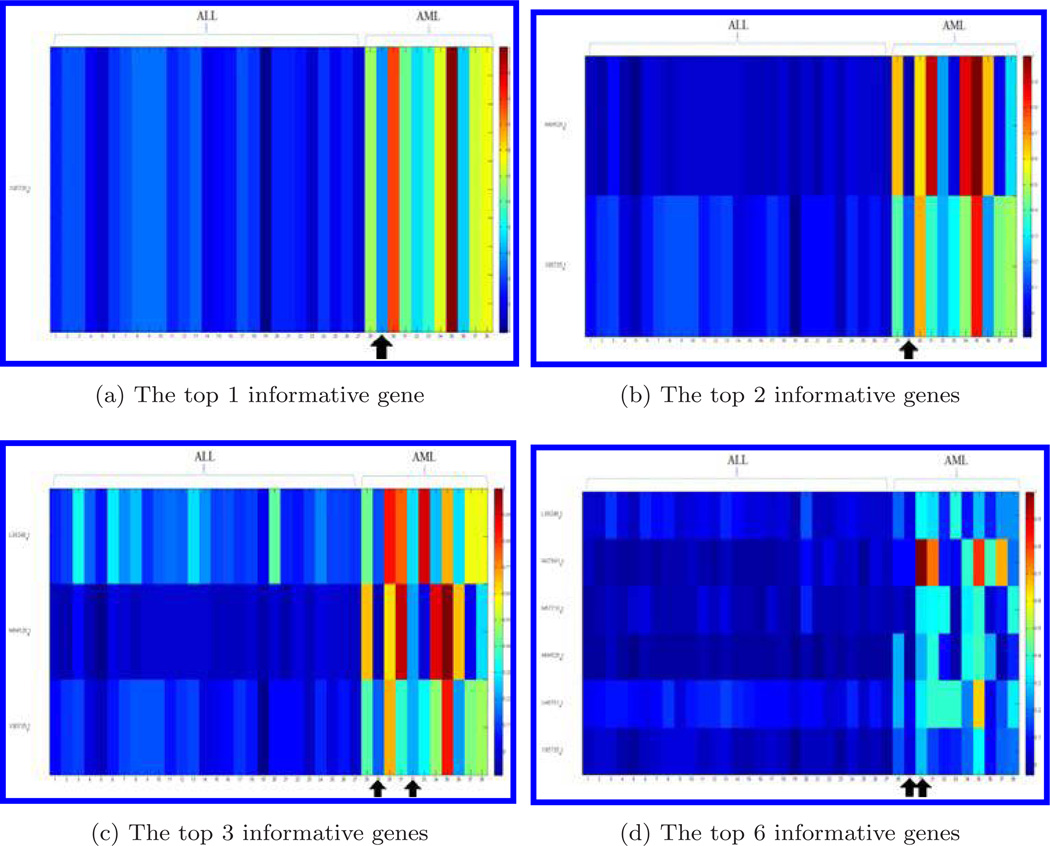
Figure 1 shows the genes for the training dataset (38 bone marrow samples) when the top 1 (a), the sets of the top 2 (b), top 3 (c), and top 6 (d) informative genes are chosen for the compressive detector. Each row represents a gene and each column represents a bone marrow sample of 38 samples (27 samples of ALL and 11 samples of AML). Colors represent levels of expression data. The gene expression data have been normalized by the largest value of sample in each row, respectively. The bone marrow samples that were misclassified by the compressive detector are marked by arrows. One of the misclassified sample, the 29th bone marrow sample in the AML group (as shown in Fig. 1), was claimed to be abnormal by Golub et al.11
Fig. 1.
Display of informative genes selected in feature design for the training dataset. We choose the 1, 2, 3, and 6 genes. Each row represents a gene and each column represents a bone marrow sample. Gene expression data is normalized by the largest value in each gene, respectively. The bone marrow samples with arrows have been misclassified by the compressive detector.
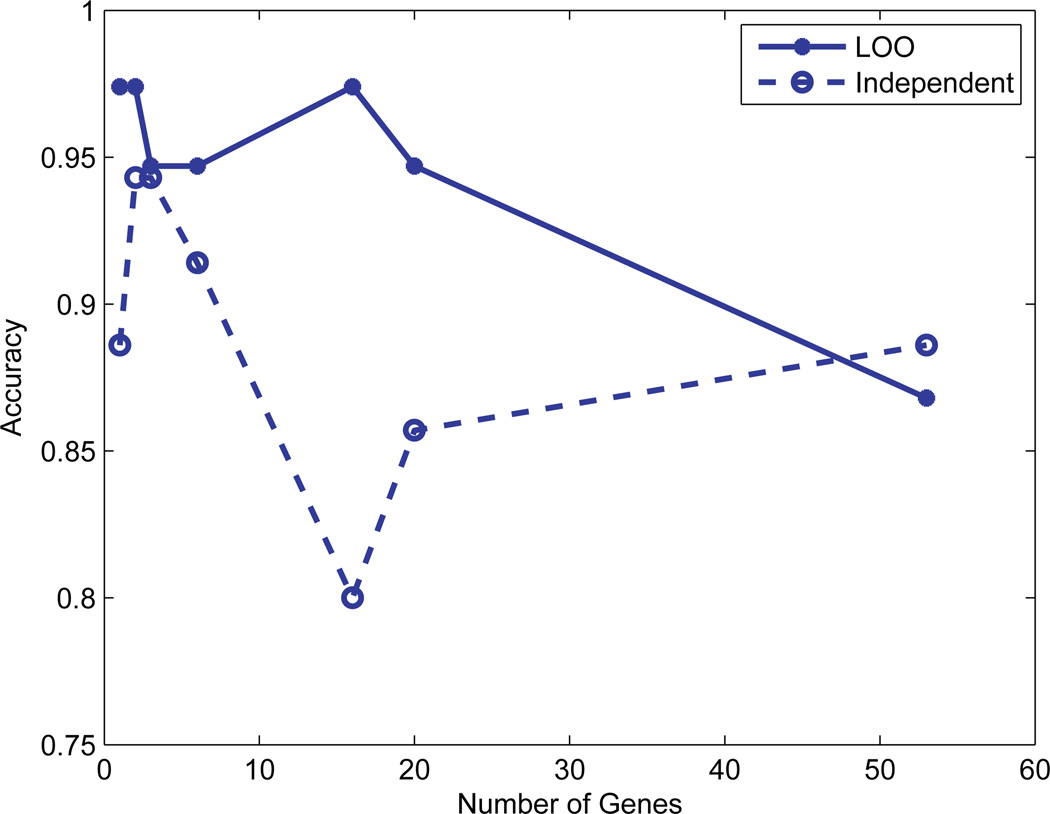
Figure 2 shows the classification accuracy for different numbers of informative genes with both the LOO validation and independent data validation. For the LOO validation, the accuracy using the top informative gene and the combination of the top two is as high as 97.4%. When we increased the numbers of informative genes to 3, 6, and 16, the detection accuracy dropped down to 94.7% for the top 3 and 6 genes; and went up to 97.4% (top 16 genes). If we continued to increase the number of informative genes e.g. the number of genes increased to 53, the accuracy decreased dramatically to 86.8% (as shown in Fig. 2) with the LOO cross-validation. This might be due to the redundancy of gene expressions; the use of fewer significant genes is more effective for subtyping. The classification accuracies evaluated by independent testing data change with the number of selected genes as shown in Fig. 2. From these tests, we can conclude that the use of fewer but significant genes will result in better classification accuracy.
Fig. 2.
The classification accuracy of ALL and AML for different numbers of informative genes. Note that the solid line represents the result of the Leave-One-Out (LOO) validation while the dash line represents the result of independent validation.
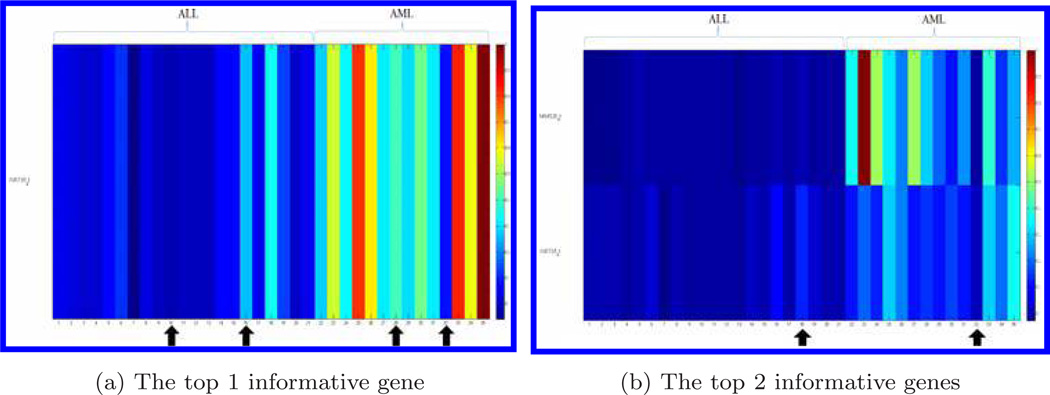
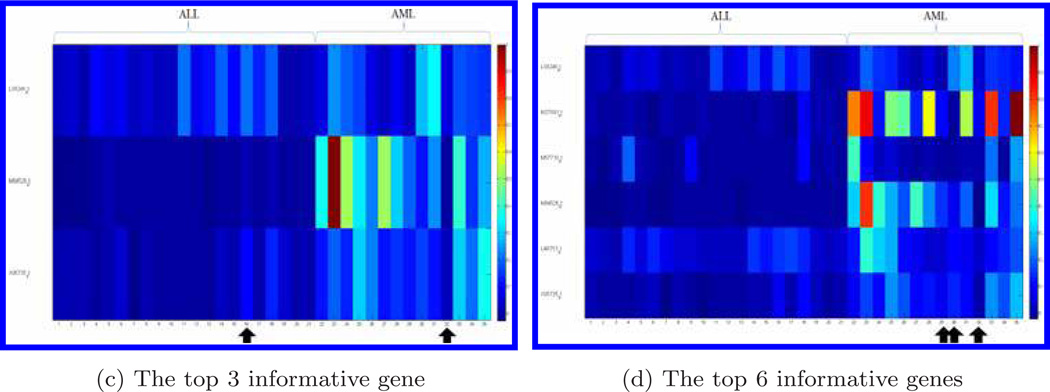
Figure 3 displays the genes for the testing data set when the top 1, 2, 3, and 6 informative genes were chosen, respectively. The bone marrow samples that were misclassified by the compressive detector are marked by arrows. With the independent data validation, the classification accuracy for the top gene was 88.6%. When we increased the numbers of informative genes to top 2, 3, 6, 16, 20, and 53, (as shown in Fig. 2), the detection accuracy went up to 94.3% for the top 2 and 3 genes; and dropped back to 91.4% (top 6 genes), then dropped again to 80.0% (top 16 genes). The classification accuracy went up again when the number of informative genes increased to 20 (85.7%) and 53 (88.6%). The use of the combination of top 2 and 3 genes gave the highest accuracy 94.3% (Fig. 2).
Fig. 3.
Display of genes distinguishing ALL from AML for the testing dataset. We choose the 1, 2, 3, and 6 genes. Each row represents a gene and each column represents a bone marrow sample. Gene expression data is normalized by the largest value in each gene, respectively. The bone marrow samples with arrows indicate those misclassified by the compressive detector.
The results of cross-validation indicate that all the bone marrow samples of ALL are classified correctly and the misclassified subjects are in the group AML (Fig. 1). It can be observed that the samples that were misclassified have low values of gene expression. This classification error might be caused by the noise or improper measurement of gene expression levels.
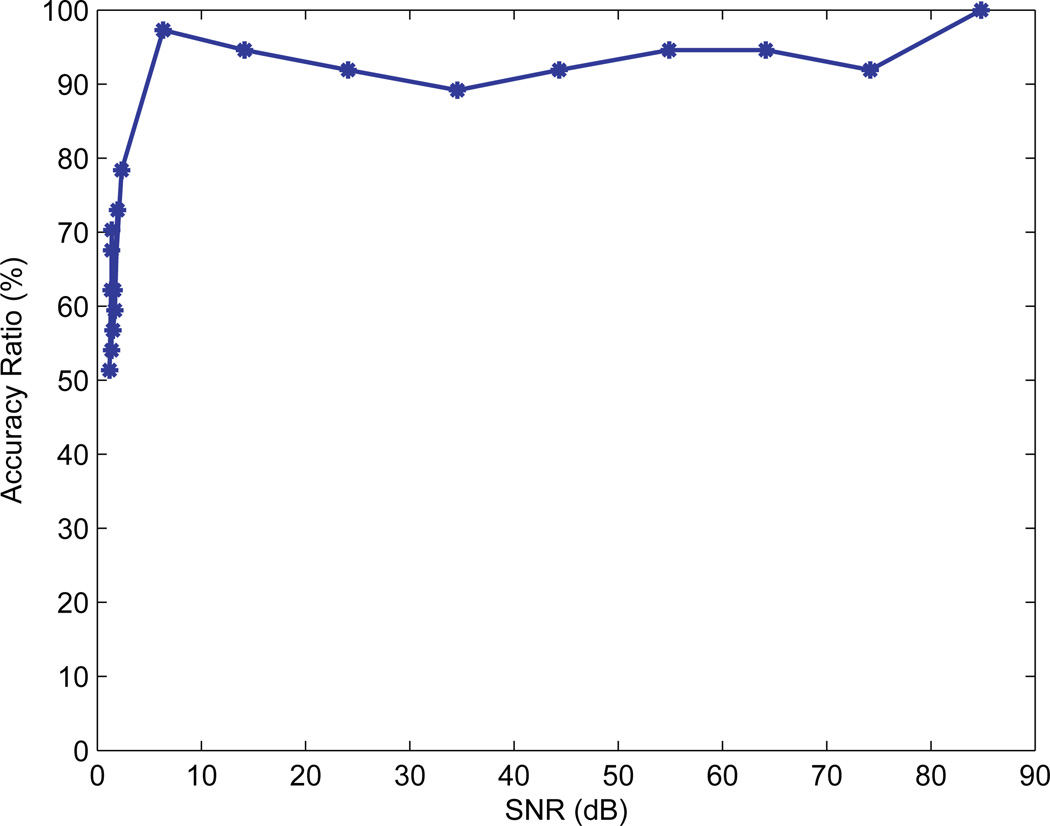
We also tested the robustness of the CS detector to noise. The Gaussian noise n in Eq. (6) was used to simulate noise with different levels and was added to gene expression data. Figure 4 shows the ratio between classification accuracies with and without noise under different SNR levels. The simulation result showed that the classification rate improves with increased SNR. Moreover, the CS method maintains a high accuracy ratio when SNR > 10 dB, indicating that the method has a strong resistance to noise.
Fig. 4.
The ratio of the classification accuracies with and without noise under different SNR levels.
4. Conclusions and Discussions
In this work, a CS-based classification method was developed, which was proven to be effective in the subtyping of leukemia with gene expression data. The proposed CS classification method allows one to employ a very small subset of genes and their expression data to identify the correct class. The proposed method has better accuracy in subtyping of leukemia than several traditional classification methods that we have compared. It also helps to reduce computational complexity and memory storage when processing large datasets.
By using the LOO validation method, we found that the detection of ALL group has an accuracy of 100%. The misclassification only occurs in the AML group, which might be due to the sample size difference. We have 27 ALL subjects and 11 AML subjects in the original training dataset. If we increase the sample size of AML, the misclassification rate in the AML group is expected to be decreased. It is interesting to note that the 29th bone marrow sample is always misclassified (Fig. 1). Visually, the 29th sample is very similar to ALL samples in the sense that all the genes in this sample have low gene expression values. Thus it is reasonable that the detector assigned this sample to ALL. It was stated that this sample was obtained from a different laboratory following a different sample preparation protocol.11 This might be the cause that the 29th bone marrow sample was always misclassified.
The more genes we select for the detector, the more information we feed to the detector. However, experiments showed that choosing too many genes does not necessarily yield better classification, which indicates that the selection of a suitable number of informative genes is more significant. The selection of informative genes for the classification of leukemia was performed by evaluating the four statistical features.
Although a few works have been published on the classification problem of ALL and AML,1,11,15,16 the proposed CS-based classification approach demonstrates more advantages in our evaluations. It is also a notable finding that using only one gene “Zyxin” can well classify ALL and AML (e.g. with a high accuracy of 97.4% evaluated by LOO method and 88.6% evaluated by independent validation). It indicates the importance of gene “Zyxin” for differentiating ALL and AML. This finding was actually validated by a biological research.22 In our work, the number of genes needed to distinguish the two subtypes has been significantly decreased compared to those in Golub et al.11 (at least 10 genes), Zhang and Ke15 (all genes used), and Kim et al.1 (33 genes used). Nevertheless, to further verify the robustness of the genes we selected (as shown in Table 1) for differentiating ALL and AML, we need more data samples, which will be our future work.
In our current work, we have shown that the CS classifier could classify two subtypes of leukemia efficiently. It is obvious to see that the CS classifier developed in this work can be easily extended for multiple-class detection problems, which are under our current research.
Acknowledgments
This work has been supported by the NIH grant R21 LM010042, NSF and Ladies Leukemia League grant.
Biographies

Wenlong Tang is a postdoctoral fellow in the Department of Biomedical Engineering at Tulane University. His research interests include data integration and statistical modeling in high-throughput and high-dimensional data space, such as genomic data and gait data. He developed a noninvasive early detection methodology based on locomotion analysis for neurological and neuromuscular disorders. He has co-authored six published journal papers and is also the co-inventor of a pending US patent and two Chinese patents. He received his Ph.D. in Mechanical Engineering from University of Maryland Baltimore County in 2010,M.S. degree in Beijing University of Technology in 2006 and Bachelor’s degree in Beijing University of Aeronautics and Astronautics, Beijing, China in 2004. He is a member of IEEE.

Hongbao Cao received the B.E. and M.S. degrees in Biomedical Engineering from the College of Precision Instrument and Optoelectronics Engineering, Tiangjin University, Tianjin, China, in 2002 and 2005, respectively. He received his Ph.D. degree in the Biomedicial Engineering Department, Louisiana Tech University in Rustorn, LA, USA. He was a postdoctoral research associate in the Department of Electronic Engineering and Computer Science at the University of Missouri at Kansas City from November 2009 to August 2010. He is currently a postdoctoral research associate at Department of Biomedical Engineering, Tulane University (September 2010~present). He has about 14 publications, and his research interests involve signal processing, image processing, pattern recognition, and computational modeling.

Junbo Duan received his B.S. degree in Information Engineering and M.S. degree in Communication and Information System from Xi’an Jiaotong University, China, in 2004 and 2007, respectively and Ph.D. degree in signal processing from Université Henri Poincaré France, in 2010. He is currently a postdoctoral researcher in the Department of Biomedical Engineering, Tulane University. His major research interests are in probabilistic approaches to inverse problems in bioinformatics.

Yu-Ping Wang received his B.S. degree in Applied Mathematics from Tianjin University, China, in 1990, and M.S. degree in Computational Mathematics and Ph.D. in Communications and Electronic Systems from Xi’an Jiaotong University, China, in 1993 and 1996, respectively. After his graduation, he had visiting positions at the Center for Wavelets, Approximation and Information Processing of the National University of Singapore and Washington University Medical School in St. Louis. From 2000 to 2003, he worked as a senior research engineer at Perceptive Scientific Instruments, Inc., and then Advanced Digital Imaging Research, LLC, Houston, Texas. In the fall of 2003, he returned to academia as an Assistant Professor of Computer Science and Electrical Engineering at the University of Missouri-Kansas City. He is currently an Associate Professor of Biomedical Engineering and Biostatistics at Tulane University and a member of Tulane Center of Bioinformatics and Genomics and Tulane Cancer Center. His research interests lie in the interdisciplinary biomedical imaging and bioinformatics areas, where he has about 100 publications. He has served on numerous program committees and NSF/NIH review panels. He was a guest editor for the Journal of VLSI Signal Processing Systems on a special issue on genomic signal processing and is a member of Machine Learning for Signal Processing technical committee of the IEEE Signal Processing Society.
References
- 1.Kim Y, Kwon S, Song SH. Multiclass sparse logistic regression for classification of multiple cancer types using gene expression data. Comput Stat Data Anal. 2006;51:1643–1655. [Google Scholar]
- 2.Candès EJ, Wakin MB. An introduction to compressive sampling. IEEE Signal Processing Magazine. 2008:21–30. [Google Scholar]
- 3.Lustig M, Donoho D, Pauly JM. Sparse MRI: The application of compressed sensing for rapid MR imaging. Magnetic Res Med. 2007;58(6):1182–1195. doi: 10.1002/mrm.21391. [DOI] [PubMed] [Google Scholar]
- 4.Dai W, Sheikh M, Milenkovic O, Baraniuk R. Compressive sensing DNA microarrays. EURASIP J Bioinform Systems Biol. 2009 doi: 10.1155/2009/162824. [DOI] [PMC free article] [PubMed] [Google Scholar]
- 5.Gholami A, Siahkoohi HR. Regularization of linear and non-linear geophysical illposed problems with joint sparsity constraints. Geophys J Int. 2010;180(2):871–882. [Google Scholar]
- 6.Xie X-C, Zhang Y-H. High-resolution imaging of moving train by ground-based radar with compressive sensing. Electron Lett. 2010;46(7):529–531. [Google Scholar]
- 7.Baraniuk RG. Compressive sensing. IEEE Signal Processing Magazine. 2007:118–124. [Google Scholar]
- 8.Davenport MA, Duarte MF, Wakin MB, Laska JN, Takhar D, Kelly KF, Baraniuk RG. Proc SPIE Computational Imaging V. San Jose, USA; 2007. The smashed filter for compressive classification and target recognition. [Google Scholar]
- 9.Cao H, Wang Y-P. Third International Conf Bioinformatics and Computational Biology (BICoB) New Orleans: USA; 2011. M-Fish image analysis with improved adaptive fuzzy C-Means clustering based segmentation and sparse representation classification. [Google Scholar]
- 10.Cao H, Wang Y-P. Third International Conf Bioinformatics and Computational Biology (BICoB) New Orleans: USA; 2011. Integrated analysis of gene expression and copy number data using sparse representation based clustering model. [Google Scholar]
- 11.Golub TR, Slonim DK, Tamayo P, et al. Molecular classification of cancer: Class prediction by gene expression monitoring. Science. 1999;286:531–537. doi: 10.1126/science.286.5439.531. [DOI] [PubMed] [Google Scholar]
- 12.Ross ME, Zhou X, Song G, et al. Classification of pediatric acute lymphoblastic leukemia by gene expression profiling. Blood. 2003;15:2951–2959. doi: 10.1182/blood-2003-01-0338. [DOI] [PubMed] [Google Scholar]
- 13.Mills KI, Kohlmann A, Williams PM, et al. Microarray-based classifiers and prognosis models identify subgroups with distinct clinical outcomes and high risk of AML transformation of myelodysplastic syndrome. Blood. 2009;114:1063–1072. doi: 10.1182/blood-2008-10-187203. [DOI] [PubMed] [Google Scholar]
- 14.Yeoh E-J, Ross ME, Shurtleff SA, et al. Classification, subtype discovery, and prediction of outcome in pediatric acute lymphoblastic leukemia by gene expression profiling. Cancer Cell. 2002;1:133–143. doi: 10.1016/s1535-6108(02)00032-6. [DOI] [PubMed] [Google Scholar]
- 15.Zhang X, Ke H. ALL/AML Cancer classification by gene expression data using SVM and CSVM approach. Genome Informatics. 2000;11:237–239. [Google Scholar]
- 16.Sun L, Miao D, Zhang H. Efficient gene selection with rough sets from gene expression data. Computer Science. 2008;5009:164–171. [Google Scholar]
- 17.Starczynowski DT, Vercauteren S, Telenius A, et al. High-resolution whole genome tiling path array CGH analysis of CD34+ cells from patients with low-risk myelodysplastic syndromes reveals cryptic copy number alterations and predicts overall and leukemia-free survial. Blood. 2008;112:3412–3424. doi: 10.1182/blood-2007-11-122028. [DOI] [PubMed] [Google Scholar]
- 18.Dudoit S, Fridlyand J, Speed TP. Comparison of discrimination methods for the classification of tumors using gene expression data. J Am Stat Assoc. 2002;97(457):77–87. [Google Scholar]
- 19.Efron B, Hastie T, Johnstone I, Tibshirani R. Least angle regression. Annals Stat. 2004;32(2):407–451. [Google Scholar]
- 20.Davenport MA, Wakin MB, Baraniuk RG. Detection and estimation with compressive measurements. Technical Report. 2007
- 21.Efron B, Tibshirani RJ. An Introduction to the Bootstrap. New York: Chapman and Hall; 1993. [Google Scholar]
- 22.Van DGE, Leccia M, Dekker S, Jalbert N, Amodeo D, Byers H. Role of Zyxin in differential cell spreading and proliferation of melanoma cells and melanocytes. J Invest Dermatol. 2002;118:246–254. doi: 10.1046/j.0022-202x.2001.01657.x. [DOI] [PubMed] [Google Scholar]


