Abstract
Purpose
The goal of this work is to evaluate PTV-to-skin proximity vs. plan quality as well as the effects of calculation voxel size on dose uncertainty in the surface region.
Methods and Materials
A right-sided CTV with the lateral border 5mm from the surface was delineated on the CT data of an H&N phantom. A 5mm PTV expansion was generated except laterally where distances of 0-5mm were used. A 7-field IMRT plan was generated using the Eclipse TPS. Optimization was performed where 95% of the PTV receives the prescription dose using a voxel size of 2mm3. Dose calculations were repeated for voxel sizes of 1, 3 and 5mm3. For each plan nine point dose values were obtained just inside the phantom surface, corresponding to a 2cm×2cm grid near the central target region. Nine ultra-thin TLDs were placed on the phantom surface corresponding to the grid. Measured and calculated dose values were compared. Conformality, homogeneity and target coverage were compared as well. This process was repeated for VMAT calculated with a 2mm3 voxel size.
Results
Surface dose is over-estimated by the TPS by approximately 21% and 9.5% for 5 and 3mm3 voxels, respectively and is accurately predicted for 2mm3 voxels. A voxel size of 1mm3 results in underestimation by 11%. Conformality improves with increasing PTV-to-skin distance and a CI of unity is obtained for grid sizes between 1-3mm3 and PTV-to-skin distances of 4-4.5mm. Hot spot also improves and falls below 110% at 4mm PTV-to-skin distance. Underdosage worsens as the PTV approaches the skin. All of the above appear to hold for VMAT.
Conclusions
For decreasing PTV-to-skin distance with this TPS, isodose conformality decreases “hot spot” increases, and target coverage degrades. Surface dose is overestimated when voxel sizes greater than 2mm3 are chosen, and underestimated for smaller voxels.
Keywords: IMRT, Skin Dose, Head and Neck, TLD
Introduction
Target and organ at risk (OAR) delineation for IMRT treatment planning in the head and neck (H&N) region can be both challenging and time consuming. Accuracy is paramount for effective optimization during the inverse planning process. Assignment of the appropriate margin(s) for planning target volume (PTV) expansion to account for immobilization and localization uncertainties often results in portions of the PTV being located in regions of electronic disequilibrium. With the variations in the expected external beam surface dose calculations for various situations given by Fraass et al. (1), it would seem prudent to apply bolus material for any PTV that is delineated in the buildup region. However, given the skin tolerance to radiation, physicians are often reluctant to follow this approach and may make clinical decisions with respect to target coverage based on the calculated isodose distributions without a full understanding of the inaccuracies inherent in treatment planning system (TPS) algorithms.
The aforementioned inaccuracies appear to be compounded by the IMRT process and in 2002 Lee et al. (2) attempted to explain the increase in skin toxicity for their H&N patients undergoing IMRT. While they found that the skin dose could be reduced by considering the skin a sensitive structure during the optimization process, they did note that there was an over-estimation of skin dose by the TPS. In 2004 Thomas and Hoole (3) suggested that IMRT delivery is not the cause of increased skin dose but that increased fluence, generated during optimization, being delivered in the surface region for scenarios where the PTV extends near the skin, is the real cause. In 2005 Chung et al. (4) demonstrated “significant discrepancies” between calculation and measurement for doses from the surface to about 2mm in depth and further indicated that the TPS over-estimated the surface dose. And from the tables presented by Court and Tishler (5) in 2007 when they evaluated the effects on calculated doses at the skin and shallow targets for different IMRT planning methods, it can be seen that the TPS again over-predicts the skin dose for PTVs defined at the skin surface. Finally, in 2011, Shiau et al. (6) used a “ball phantom” to measure surface dose and compare with the TPS values as a function of “shrinkage margin” of the target from the skin. They concluded that “the accuracy of dose calculation in the superficial region for a TPS does not depend on different shrinkage margins, but on the dose calculation algorithm”.
While the studies above indicate that in general TPS surface dose for IMRT is typically over-estimated, no attempt has been made to guide the physician during the IMRT treatment planning process with respect to PTV-to-skin proximity, associated dose uncertainties, or the effects on plan quality. To this end the goal of this work was to evaluate PTV-to-skin proximity vs. plan quality as well as the effects of calculation grid voxel size on dose calculation uncertainty in the surface region, and to provide appropriate parameters for use during planning and the approximate levels of uncertainty for variations.
Methods and Material
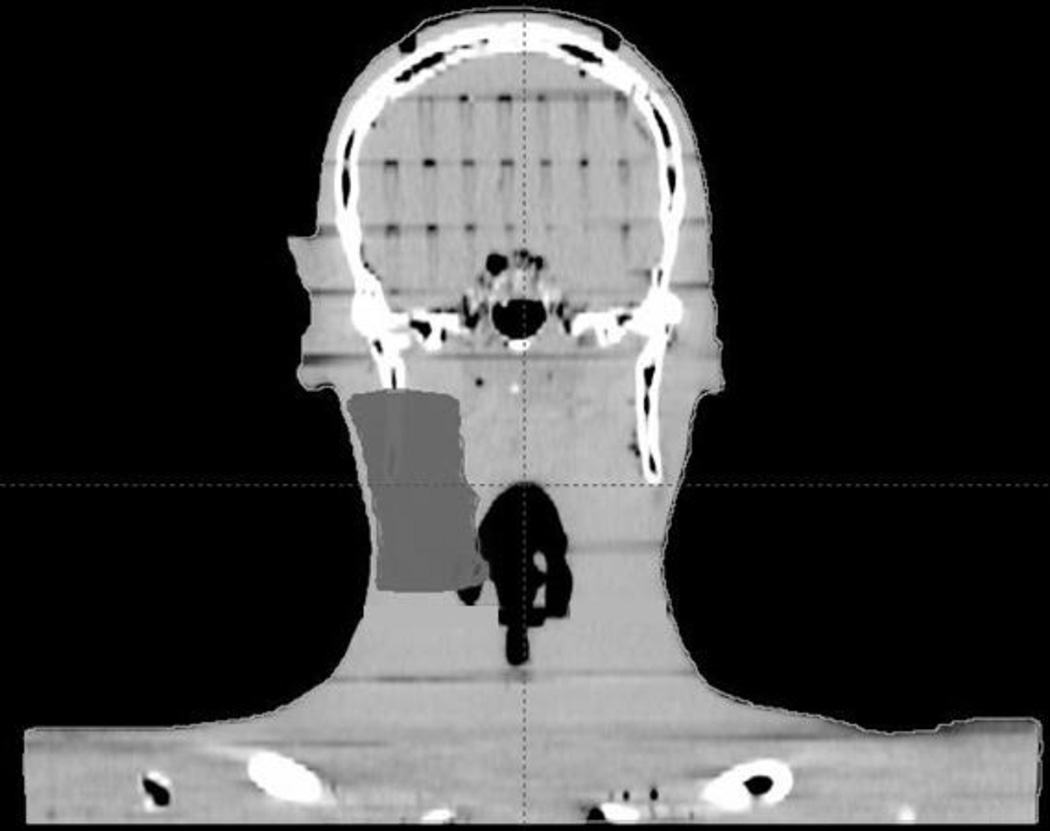
CT data were obtained for the cephalic-most 16 sections of an anthropomorphic phantom (Alderson Radiation Therapy Phantom, Radiology Support Devices, Long Beach, CA) at a slice thickness of 2.5mm and imported into the Eclipse treatment planning system (TPS, version 10.0) (Varian Medical Systems, Palo Alto, CA). A right-sided ipsilateral CTV with the lateral border being 5mm from the skin surface was delineated for planning purposes (Figure 1a). Five different PTVs were generated using 5mm expansion from the CTV in all directions except laterally where distances from the skin surface of 5, 3, 2, 1 and 0mm were used. A typical 6MV, 7-field IMRT plan (gantry angles 135, 30, 330, 300, 270, 245 and 180 degrees) was generated for step-and-shoot delivery using the analytic anisotropic algorithm (AAA). Optimization was performed such that 60Gy would be delivered at 2Gy/fraction with a minimum of 95% of the PTV receiving the prescription dose with calculations being performed with a matrix size of 2mm3 (our clinically used grid size).
Figure 1.
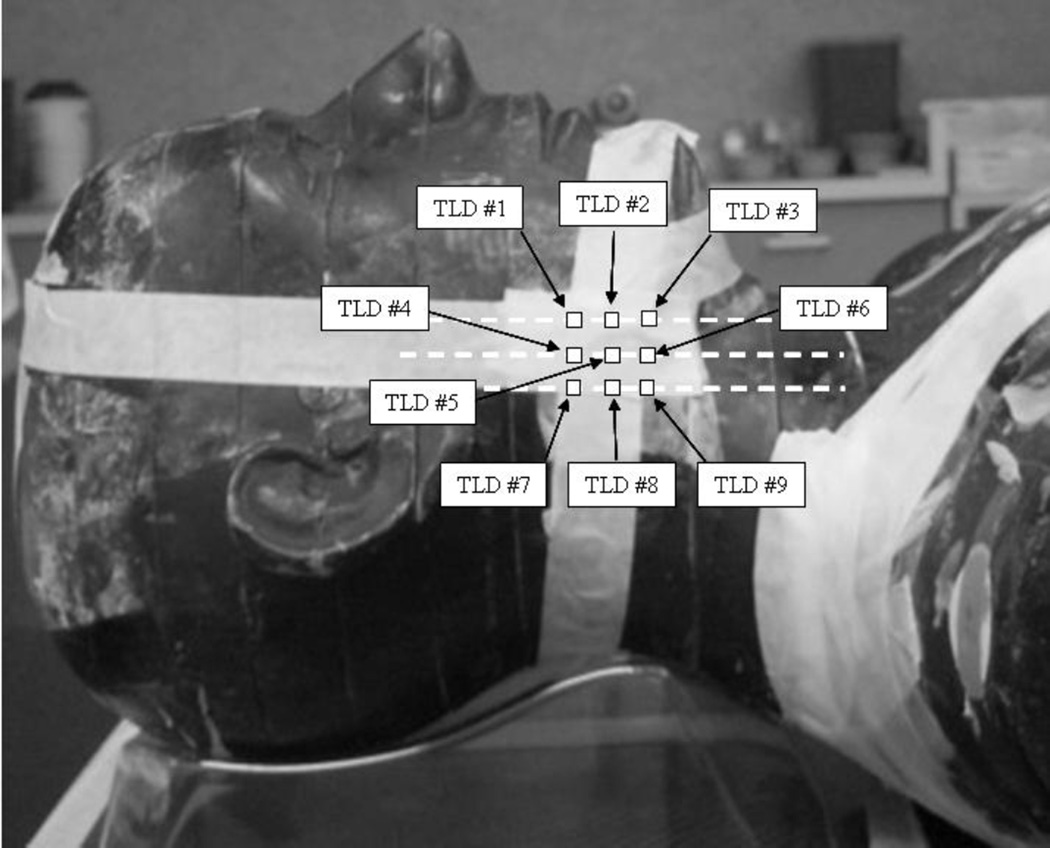
(a) Coronal CT reconstruction of anthropomorphic phantom with right-sided CTV delineated for treatment planning purposes. The lateral border of the CTV was cropped to a distance of 5mm from the skin surface. (b) Lateral view of phantom depicting approximate TLD positions. The TLDs were placed at the intersecting lines of a grid measuring 2cm × 2cm and adjacent to the central portion of the target.
There were no additional critical structures or organs at risk to complicate the optimization process for this study, with the only variable being PTV-to-skin proximity. Once an acceptable plan was generated, the final dose calculations were repeated for grid sizes of 1, 3 and 5mm3. Re-optimization was not performed. For each plan nine point dose values were obtained just inside the phantom surface using the zoom function and point-dose measurement tool in the TPS software. These point-dose measurements correspond to the intersecting lines of a 2cm×2cm grid associated with the central portion of the target, at the skin surface (Figure 1b).
The phantom was placed on the couch of a Varian iX linear accelerator and aligned via conebeam CT (CBCT). Nine ultra-thin thermoluminescent dosimeters (TLDs) (Harshaw Chemical Company, Solon, OH) each measuring 3×3×0.15mm3 were placed on the phantom surface corresponding to the intersecting lines of the 2cm×2cm grid mentioned above. The delivery sequences associated with the aforementioned planning scenarios were delivered and measured with the TLDs. Comparisons were made between measured and calculated dose values.
Plan quality was assessed by comparing conformality, homogeneity and target coverage, for each dose calculation grid size as a function of PTV-to-skin distance. The conformality index (CI) was defined as the ratio of the prescription isodose volume and the PTV. Homogeneity was assessed by evaluating the hot spot, defined as the maximum dose to 0.1cc of PTV, for the same parameters. Target coverage was assessed by evaluating the shoulder of the associated dose volume histogram (DVH) as well as the prescription isodose distribution.
In 2000, Mutic and Low (7) evaluated surface dose agreement between measurement and TPS values for serial tomotherapy delivery. They found that the TPS “…tended to overestimate doses within the first few millimeters below the surface.” As we routinely utilize volumetric modulated arc therapy (VMAT) planning and delivery at our institution, the process above was repeated for VMAT plans generated using a 2mm3 dose calculation voxel size. A 3-arc plan consisting of one full rotation plus two 230 degree arcs (cw and ccw between 50 and 180 degrees) was utilized (Varian RapidArc, Palo Alto, Ca).
Results
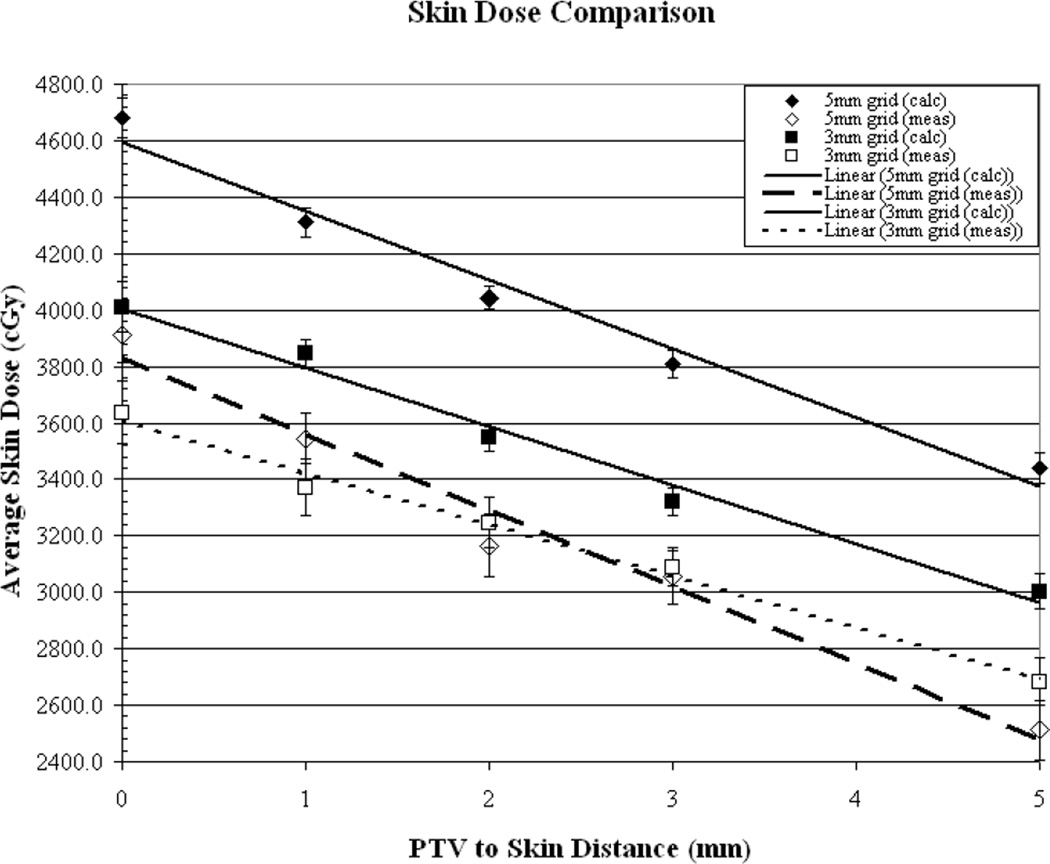
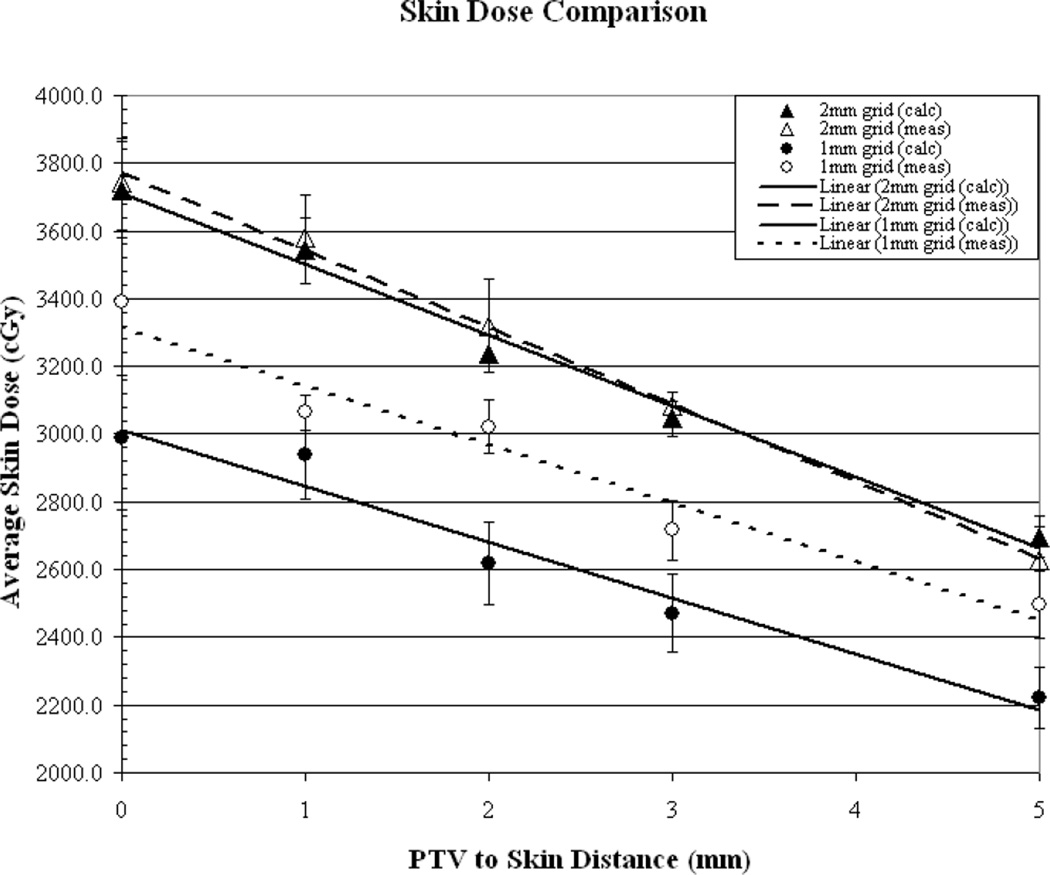
Figures (2a-2b) illustrate the comparison of measured vs. calculated average skin dose values, as a function of PTV-to-skin distance, for plans generated using a 5, 3, 2 and 1mm3 calculation voxel size. The surface dose is over-estimated by the TPS by approximately 21% and 9.5% for the 5 and 3mm3 voxel sizes, respectively. The surface dose appears to be accurately predicted (within 1%) for the 2mm3 calculation voxel size and the use of a voxel size of 1mm3 results in an underestimation of approximately 11%. As can be seen from the measured values, for the commonly “acceptable” calculation voxel sizes of 1-3mm3surface dose increases by an average of approximately 28% when decreasing the PTV-to-skin distance from 4-0mm.
Figure 2.
(a) Results of measured (dotted line) vs. calculated (solid line) skin dose as a function of PTV to skin surface proximity for dose calculation performed on a 5mm3 and a 3mm3 grid. (b) Calculations performed on a 2mm3 grid and a 1mm3 grid.
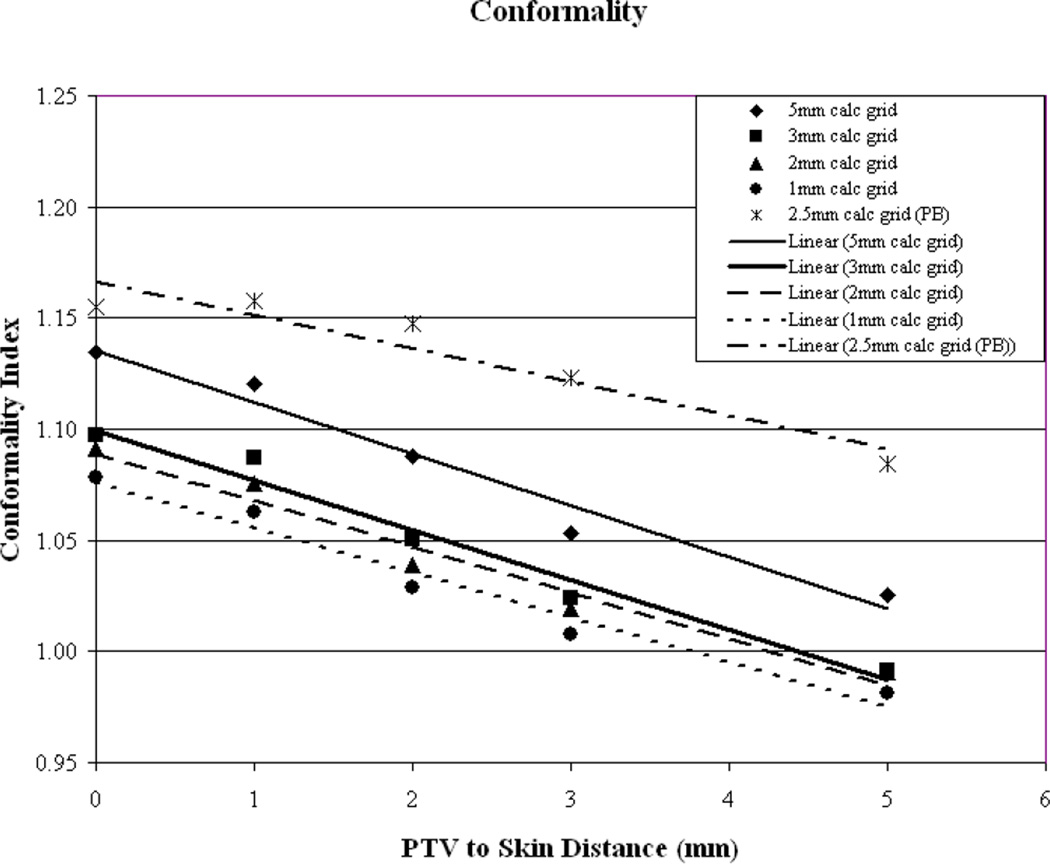
Plan conformality as a function of PTV-to-skin distance is illustrated in Figure 3a. It can be seen that a similar trend is evident for all plans with the CI improving as the PTV is moved away from the skin surface. For the clinically relevant calculation grid sizes (1, 2 and 3mm3) it appears that a CI of unity is reached at a PTV-to-skin distance between approximately 4 and 4.5mm. To evaluate if the trend of improved conformality with increasing PTV-to-skin distance is algorithm dependent, the final dose calculation was performed using a Pencil Beam (PB) algorithm with heterogeneity corrections made using the rudimentary equivalent TAR method. An integer value for the size of the calculation grid is not given as an option in the clinically useful range, therefore, an intermediate grid size of 2.5mm3 was selected. As can be seen in image 3a, while the absolute value of the CI may differ, the trend appears to hold, regardless of the algorithm used. This phenomenon helps to illustrate the known difficulties of delivering dose to the buildup region.
Figure 3.
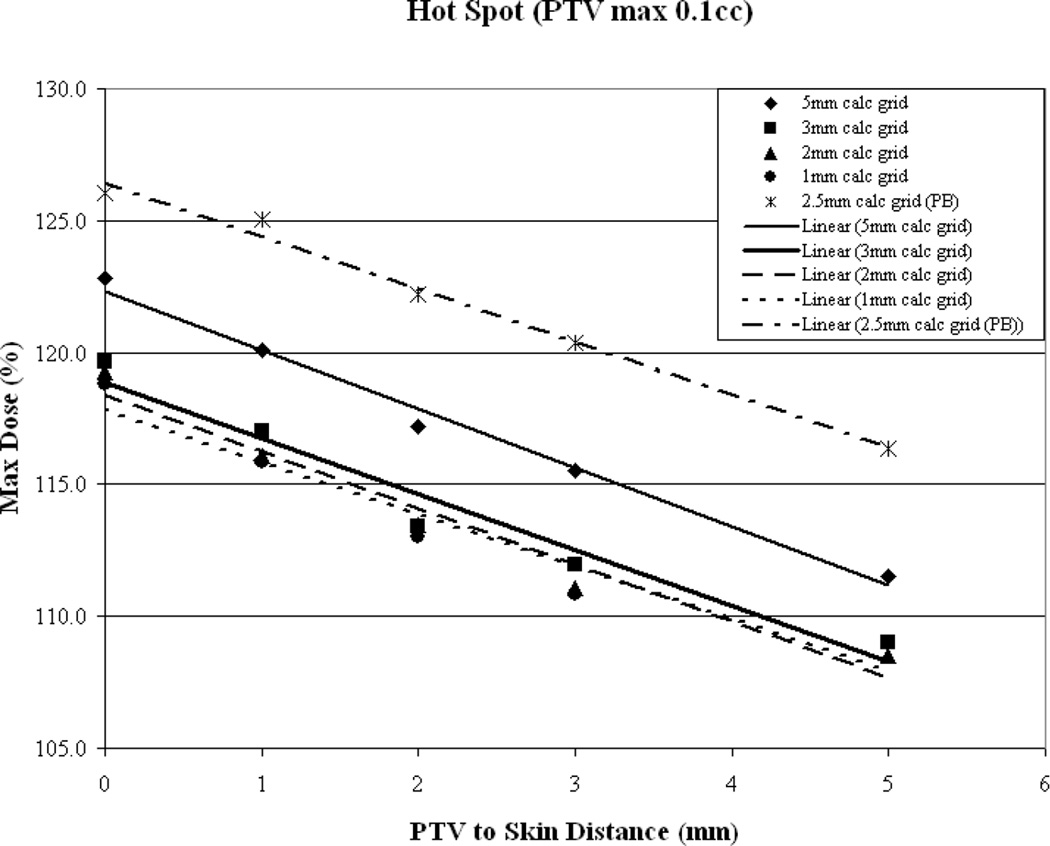
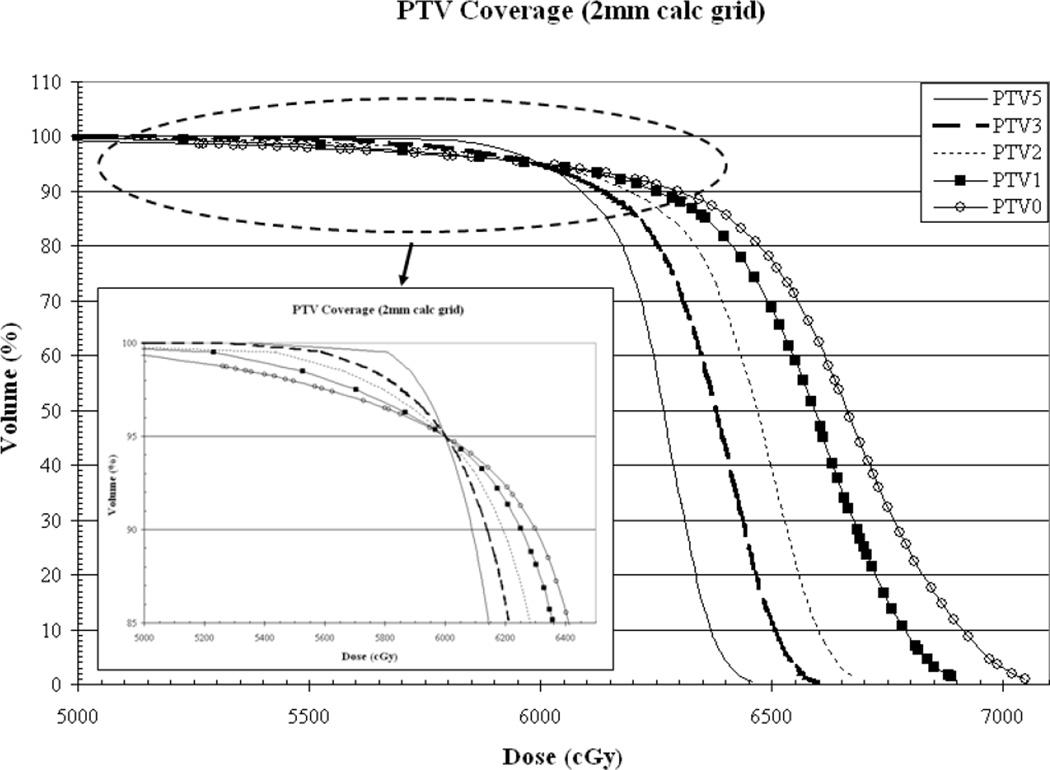
As a function of PTV-to-skin proximity (a) Illustration of the CI for all calculation grid sizes demonstrating decreased conformality as the PTV approaches the skin surface. (b) Plan homogeneity for all calculation grid sizes demonstrating increasing hot spot (0.1cc) as the PTV approaches the skin surface. (c) DVHs for all calculated on a 2mm3 grid. The tail of the individual curves illustrates the decrease in homogeneity as the PTV approaches the skin surface. The insert depicts a magnification of the shoulder section of the curves illustrating progressive target underdosing as well.
Overall plan hot spot as a function of PTV-to-skin distance is illustrated in Figure 3b and again it can be seen that a similar trend is evident for all plans with hot spot decreasing as the PTV is moved away from the skin surface. While the hot spot is lowest when the PTV is furthest from the skin surface, for the clinically relevant calculation grid sizes hot spot falls below 110% of the prescription dose once the PTV-to-skin distance reaches approximately 4mm. To assess if this trend is algorithm dependent, the results from the Pencil Beam calculations were included. Again, it can be seen that the trend holds.
While all plans were normalized such that 95% of the PTV receives the prescription dose, it can be seen from the DVH in Figure 3c that target underdosage depicted by the pronounced shoulder, is progressively greater as the PTV approaches the skin than that of the plan where the PTV is defined 5mm from the surface. The underdosed volume is located in the buildup region, as expected, with the axial distance from the surface to the prescription isodose line being approximately 7.4, 5.9, 5.1, 3.9 and 3.8mm for PTV-to-skin distances of 5, 3, 2, 1 and 0mm, respectively. The plans represented in Figure 3c were generated using a 2mm3 calculation grid.
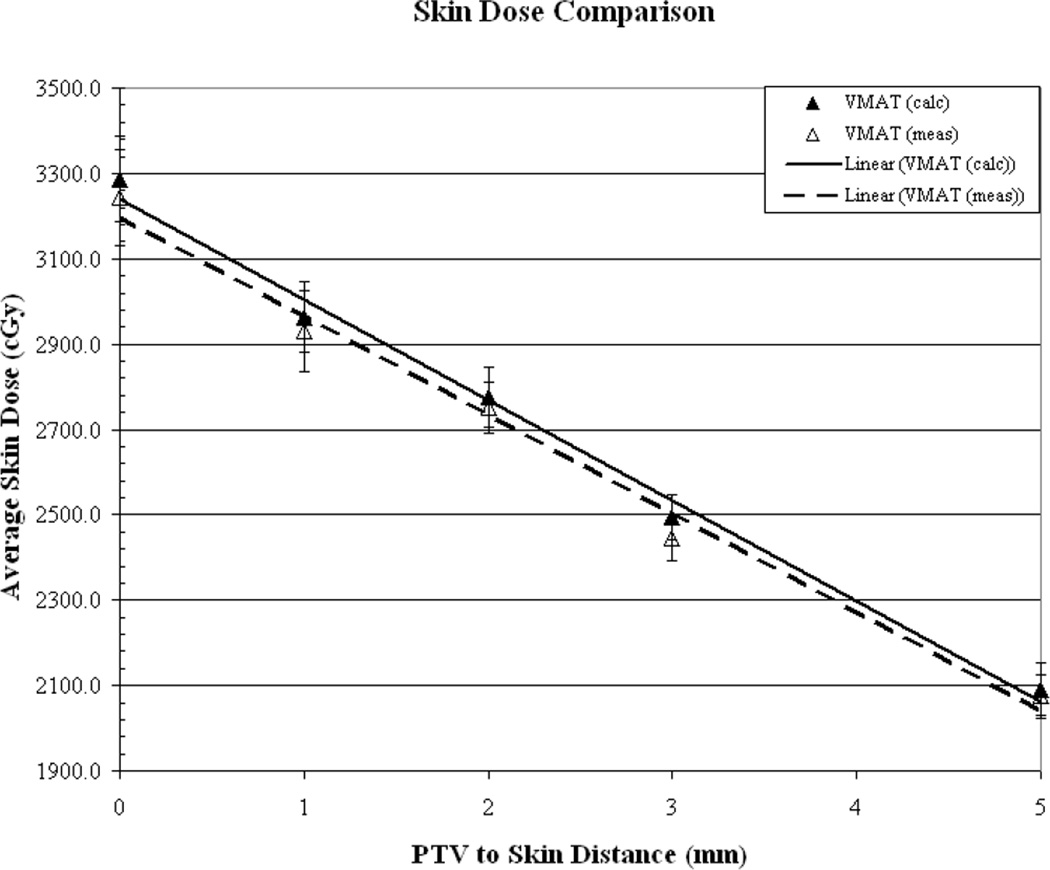
Figure 4a illustrates the comparison for the VMAT plans generated using a 2mm3 calculation voxel size. The surface dose is accurately predicted by the TPS (within 1.2%).
Figure 4.
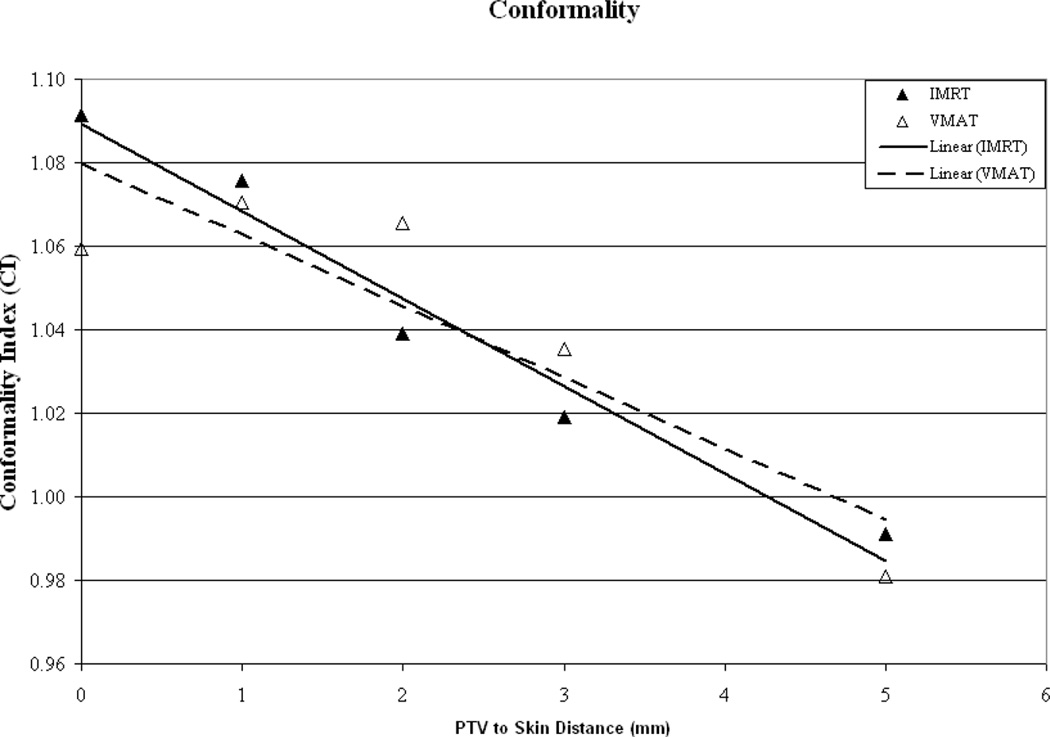
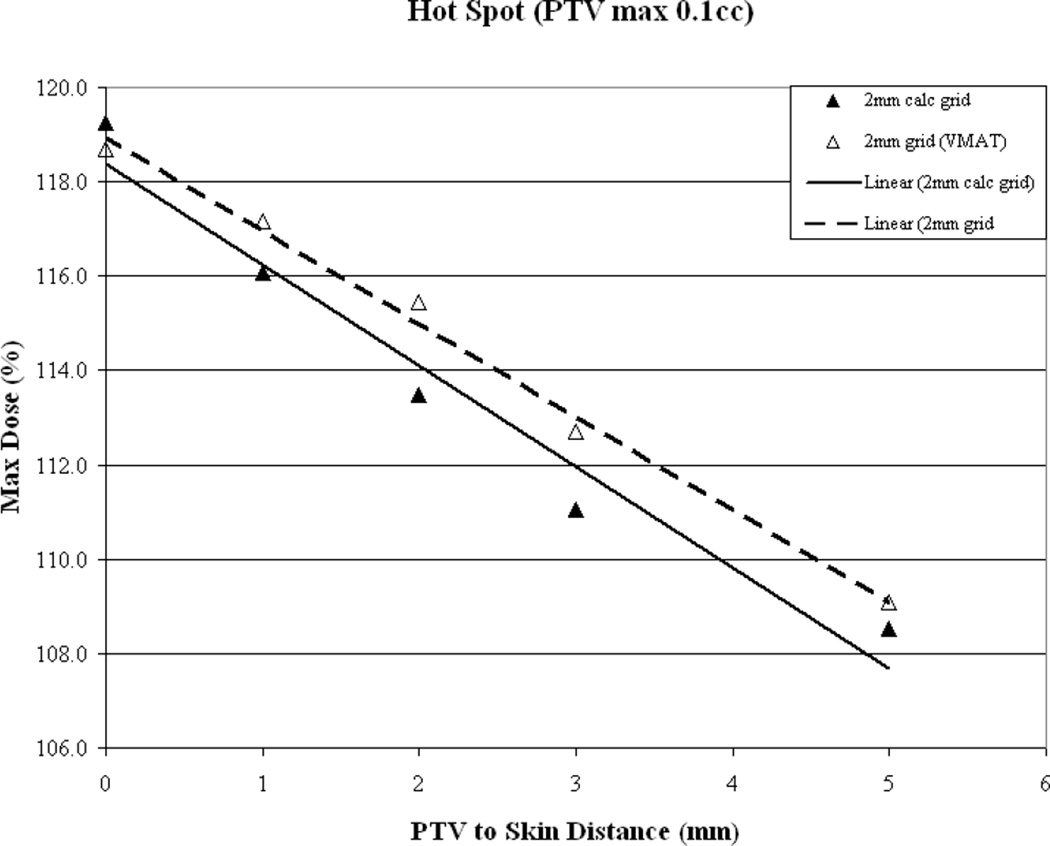
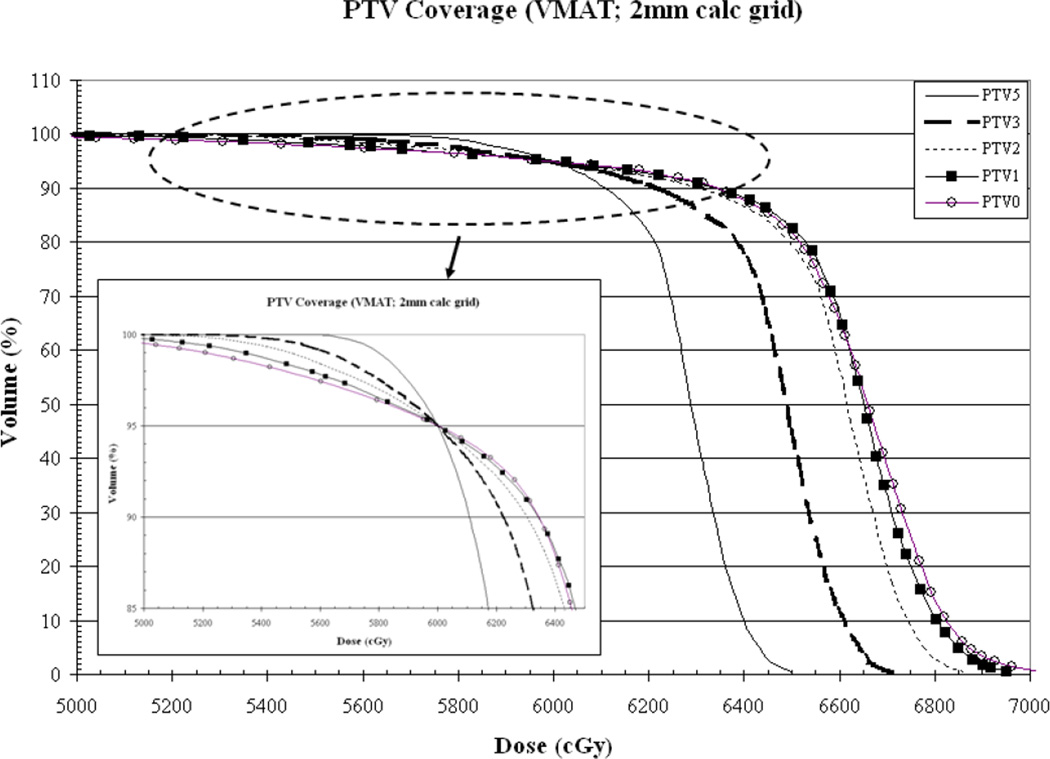
As a function of PTV-to-skin proximity (a) Results for VMAT measured (dotted line) vs. calculated (solid line) skin dose for dose calculation performed on a 2mm3 grid. Skin dose is accurately-estimated by the TPS. (b) CI for a 2mm3 calculation grid size for IMRT (solid line) vs. VMAT (dotted line) demonstrating decreased conformality as the PTV approaches the skin surface. (c) Plan homogeneity for a 2mm3 calculation grid size for IMRT (solid line) vs. VMAT (dotted line) demonstrating increasing hot spot (0.1cc) as the PTV approaches the skin surface. (d) VMAT DVHs calculated on a 2mm3 grid. The tail of the individual curves illustrates the decrease in homogeneity as the PTV approaches the skin surface. The insert depicts a magnification of the shoulder section of the curves illustrating progressive target underdosing as well.
Conformality for the above VMAT plans as compared with the 7-field fixed-beam IMRT plans generated for the same voxel size is illustrated in Figure 4b. It can be seen that a similar trend is evident for all plans with the CI improving as the PTV is moved away from the skin surface. It appears that a CI of unity is again reached at a PTV-to-skin distance between approximately 4 and 4.5mm.
Hot spot, as illustrated in Figure 4c, decreases as the PTV is moved away from the skin surface. The VMAT hot spot falls below 110% of the prescription dose once the PTV-to-skin distance reaches approximately 4.5mm.
Figure 4d illustrates VMAT target underdosage depicted by the pronounced shoulder, being progressively greater as the PTV approaches the skin surface. The underdosed volume is located in the buildup region where the axial distance from the surface to the prescription isodose line is approximately 8.1, 5.9, 4.8, 3.8 and 3.1mm for PTV-to-skin distances of 5, 3, 2, 1 and 0mm, respectively. All plans represented in the Figures 4a-d were generated using a 2mm3 calculation grid.
Discussion
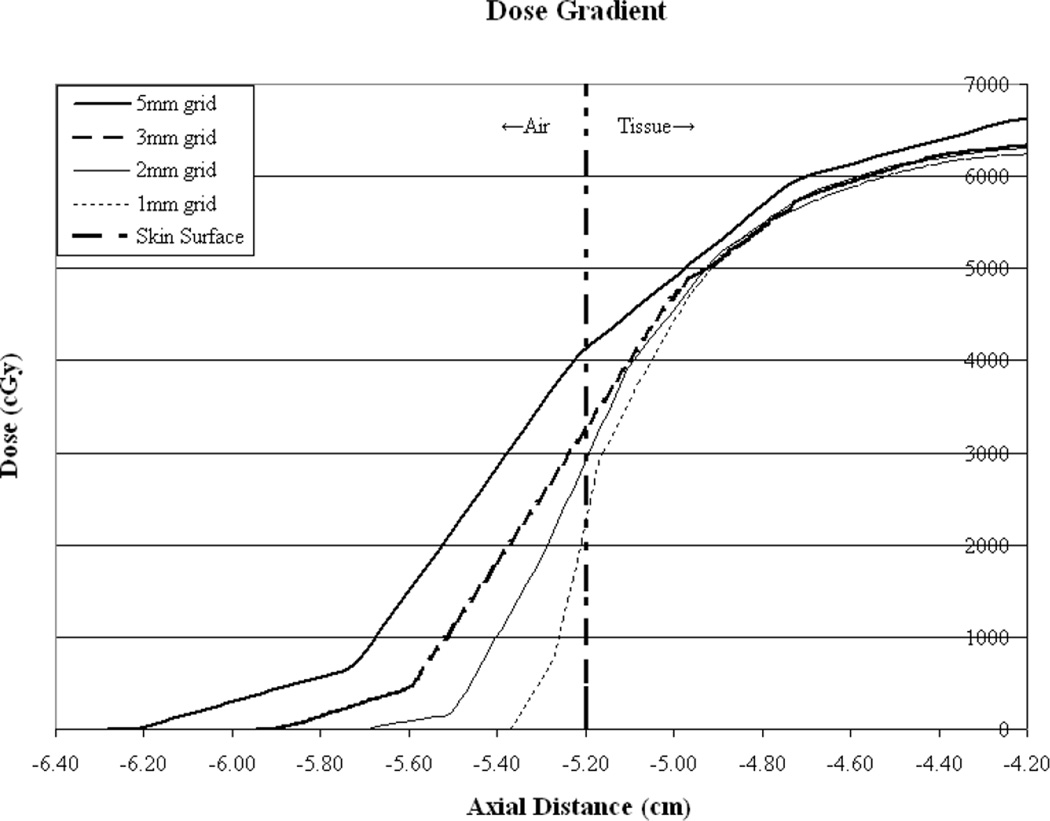
TPS dose calculation near the surface is a complex issue and is dominated by the classic “build up” effect demonstrated by a single beam percent depth dose curve and the “build down” effect for beams exiting the same region into a lower density medium (air in this case). However, clinicians rely on the TPS in part to help them determine the best course of radiotherapy delivery. This is particularly true with inverse planning for IMRT and an understanding of the input parameters is necessary for the planner to generate an acceptable dose distribution. It is assumed that target volume delineated in the surface region requires adequate dose coverage and there are many planning methods used to generate isodose distributions for targets approaching the skin surface. However, a detailed description of these methods is beyond the scope of this text. It is important to note that it is the accuracy of the resultant dose distributions that is of greatest importance as the adequacy of target coverage is determined by the clinician using information generated with the TPS. As shown in this work, the agreement between the calculated and measured values for surface dose varies as a function of dose calculation voxel size. Plan quality varies with PTV-to-skin proximity with degradation evident in all parameters assessed as the target approaches the surface. The optimization software is attempting to minimize the degree of underdosage but the lack of dose in the disequilibrium region is a physical phenomenon associated with energy deposition of high energy photon beams. Entering beams do not achieve electronic equilibrium, tangential beams are without lateral equilibrium, and exiting beams lack typical backscatter, in these regions. Altering the optimization methodology to increase dose to this region will invariably result in plan degradation in other regions. If the surface region is to be treated without the aforementioned degradation, the physical nature of the photon beam must be changed (eg. beam spoiler) or bolus material must be added to provide the appropriate dose buildup/equilibrium conditions.
Dose calculation voxel size is variable for many reasons, one of which being calculation time. The larger the voxel size the faster the calculation. Small voxels may be avoided in some clinics as they result in inordinately long calculation times. However, it can be seen in this work that the accuracy of surface dose prediction and plan quality vary as a function of calculation voxel size. It would seem intuitive that smaller voxel sizes would result in more favorable comparisons of surface dose since the larger voxels encompass larger volumes through the dose gradient near the surface and the average value subsequently determined, results in over-estimation as compared to measured surface values. However, as can be seen in figure 5, dose is calculated outside the phantom for approximately 2 voxels. Furthermore, since the dose values are artificially set to zero beyond 2 voxels by the TPS, the slope of the dose gradient outside the phantom is steepest for the smallest calculation voxel size. The profiles demonstrate this with the steepest gradient outside the phantom corresponding to the 1mm3 voxel size. Inside the phantom (tissue) the curves for the clinically useful calculation voxel sizes converge between 2 and 3mm further demonstrating this effect as the entire voxel is contained within the phantom. Comparisons may be further complicated by the fact that the TLDs measuring 3mm on a side, may stretch across more than one voxel but the resultant values are compared with point doses. Additionally, while the TLDs used are only 0.15mm thick, they do contribute some buildup. These measurement uncertainties are compounded by the determination of the surface boundary given the known artifacts in CT reconstruction of this region. While the 2mm3 calculation grid voxel size resulted in the best agreement with surface dose measurement, this fact should be used with caution since it is based on this particular TPS, the existing algorithmic implementation, and beam energy. As such, for calculation grid sizes of 1-3mm3 TPS generated surface dose agreement with measurement can be expected to be within ±10%. Combined with the measures of plan quality these data may be used to generate reasonably accurate treatment plans. Table 1 summarizes the degree of TPS estimation of surface dose, plan conformality and homogeneity as a function of PTV to skin distance, for the various calculation voxel sizes evaluated. It is also important to note that agreement between calculated and measured surface dose may vary for other systems and algorithmic implementations. However, if dose calculational accuracy is insured the aforementioned plan quality characteristics should remain unchanged.
Figure 5.
Illustration of TPS calculated dose in the skin-to-air boundary region for all calculation grid sizes. It can be seen that dose is calculated for approximately 2 voxels outside the phantom surface and therefore a more rapid dose fall-off is demonstrated for smaller calculation voxel sizes. Dose inside the phantom appears to increase at similar rates.
| 1mm calc grid | |||
|---|---|---|---|
| PTV to Skin (mm) | C.I. | Hot Spot (%) | TPS SD underestimation(%) |
| 0 | 1.08 | 117.8 | −10.3 |
| 1 | 1.06 | 115.9 | −10.6 |
| 2 | 1.04 | 113.9 | −10.9 |
| 3 | 1.02 | 111.9 | −11.2 |
| 4 | 1.00 | 109.9 | −11.6 |
| 5 | 0.98 | 108 | −12.1 |
| Average | −11.1 | ||
| 2mm calc grid | |||
| PTV to Skin (mm) | C.I. | Hot Spot (%) | TPS SD underestimation(%) |
| 0 | 1.09 | 118.4 | 1.7 |
| 1 | 1.07 | 116.2 | 1.3 |
| 2 | 1.05 | 114.1 | 0.8 |
| 3 | 1.03 | 112.0 | 0.2 |
| 4 | 1.01 | 109.8 | 0.4 |
| 5 | 0.98 | 107.7 | 1.1 |
| Average | 0.9 | ||
| 3mm calc grid | |||
| PTV to Skin (mm) | C.I. | Hot Spot (%) | TPS SD underestimation(%) |
| 0 | 1.10 | 118.9 | 9.9 |
| 1 | 1.08 | 116.7 | 9.8 |
| 2 | 1.05 | 114.6 | 9.6 |
| 3 | 1.03 | 112.5 | 9.5 |
| 4 | 1.01 | 110.4 | 93 |
| 5 | 0.99 | 108.3 | 9.1 |
| Average | 9.5 | ||
| 5mm calc grid | |||
| PTV to Skin (mm) | C.I. | Hot Spot (%) | TPS SD underestimation(%) |
| 0 | 1.14 | 122.3 | 16.5 |
| 1 | 1.11 | 120.1 | 18.1 |
| 2 | 1.09 | 117.9 | 19.8 |
| 3 | 1.07 | 115.6 | 21.8 |
| 4 | 1.04 | 113.4 | 24.0 |
| 5 | 1.02 | 111.2 | 26.6 |
| Average | 21.1 | ||
In the interest of plan quality and accuracy the authors would recommend the routine use of a 4-5mm PTV-to-skin distance for IMRT and VMAT treatment planning. Using a 2mm3 dose calculation grid results in a CI of approximately 1.01 and a “hot spot” of approximately 110%. Additionally, the shoulder of the target DVH is minimized resulting in a higher minimum dose. For patients requiring a PTV-to-skin distance of less than this value, a 5 mm thick bolus should be constructed prior to CT acquisition. This does not necessarily mean that the skin will then receive the full prescription dose as dose to the skin would obviously be limited by target proximity. The dose distribution to the skin and the first few millimeters of tissue would be more accurate and the acquisition of center-specific skin dose as a function of volume from the TPS in the region directly adjacent to the target, may then allow clinicians to arrive at meaningful guidelines for treatment planning and potential use during the optimization process.
For the TPS used in this study it appears that plan quality as a function of decreasing PTV-to-skin distance varies in the following ways: isodose conformality decreases “hot spot” increases, and target coverage degrades. The TPS appears to over -predict surface dose for IMRT delivery for dose calculation voxel sizes >2mm3under-estimates for voxel sizes < 2mm3and accurately predicts the surface dose for a 2mm3 voxel size. All of the above appear to hold for VMAT planning and delivery.
Acknowledgements
This publication was supported by grant number P30 CA006927 from the National Cancer Institute, NIH. Its contents are solely the responsibility of the authors and do not necessarily represent the official views of the National Cancer Institute or the National Institutes of Health.
Footnotes
Publisher's Disclaimer: This is a PDF file of an unedited manuscript that has been accepted for publication. As a service to our customers we are providing this early version of the manuscript. The manuscript will undergo copyediting, typesetting, and review of the resulting proof before it is published in its final citable form. Please note that during the production process errors may be discovered which could affect the content, and all legal disclaimers that apply to the journal pertain.
Conflict of Interest: None.
References
- 1.Fraass B, Doppke K, Hunt M, et al. American Association of Physicists in Medicine Radiation Therapy Committee Task Group 53: Quality assureance for clinical radiotherapy treatment planning. Med. Phys. 1998;25(10):1773–1829. doi: 10.1118/1.598373. [DOI] [PubMed] [Google Scholar]
- 2.Lee N, Chuang C, Quivey JM, et al. Skin Toxicity Due to Intensity-Modulated Radiotherapy for Head-and-Neck Carcinoma. Intern. J. Radiat. Oncol. Biol. Phys. 2002;53(3):630–637. doi: 10.1016/s0360-3016(02)02756-6. [DOI] [PubMed] [Google Scholar]
- 3.Thomas SJ, Hoole ACF. The effect of optimization on surface dose in intensity modulated radiotherapy (IMRT) Phys. Med. Biol. 49(2004):4919–4928. doi: 10.1088/0031-9155/49/21/005. [DOI] [PubMed] [Google Scholar]
- 4.Chung H, Dempsey JF, Liu C, et al. Evaluation of Surface and Build-up Region Dose for Intensity Modulated Radiation Therapy in Head and Neck Cancer. Med. Phys. 2005;32(8):2682–2689. doi: 10.1118/1.1992067. [DOI] [PubMed] [Google Scholar]
- 5.Court LE, Tishler RB. Experimental Evaluation of the Impact of Different Head-and-Neck Intensity-Modulated Radiation Therapy Planning Techniques on Doses to the Skin and Shallow Targets. Intern. J. Radiat. Oncol. Biol. Phys. 2007;69(2):607–613. doi: 10.1016/j.ijrobp.2007.03.004. [DOI] [PubMed] [Google Scholar]
- 6.Shiau A-C, Lai P-L, Liang J-A, et al. Dosimetric verification of surface and superficial doses for head and neck IMRT with different PTV shrinkage margins. Med. Phys. 2011;38(3):1435–1443. doi: 10.1118/1.3553406. [DOI] [PubMed] [Google Scholar]
- 7.Mutic S, Low DA. Superficial doses from serial tomotherapy delivery. Med. Phys. 2000;27(1):163–165. doi: 10.1118/1.598880. [DOI] [PubMed] [Google Scholar]


