

Summary
Human body surface epithelia coexist in close association with complex bacterial communities and are protected by a variety of antibacterial proteins. C-type lectins of the RegIII family are bactericidal proteins that limit direct contact between bacteria and the intestinal epithelium and thus promote tolerance to the intestinal microbiota1,2. RegIII lectins recognize their bacterial targets by binding peptidoglycan carbohydrate1,3 but the mechanism by which they kill bacteria is unknown. Here we elucidate the mechanistic basis for RegIII bactericidal activity. Here we show that human RegIIIα (hRegIIIα, also known as HIP/PAP) binds membrane phospholipids and kills bacteria by forming a hexameric membrane-permeabilizing oligomeric pore. We derive a three-dimensional model of the hRegIIIα pore by docking the hRegIIIα crystal structure into a cryo-electron microscopic map of the pore complex, and show that the model accords with experimentally determined properties of the pore. Lipopolysaccharide inhibits hRegIIIα pore-forming activity, explaining why hRegIIIα is bactericidal for Gram-positive but not Gram-negative bacteria. Our findings identify C-type lectins as mediators of membrane attack in the mucosal immune system, and provide detailed insight into an antibacterial mechanism that promotes mutualism with the resident microbiota.
hRegIIIα damages the surfaces of Gram-positive bacteria1, suggesting that hRegIIIα might target bacterial membranes. We assessed the capacity of hRegIIIα to permeabilize bacterial membranes by quantifying bacterial uptake of a membrane-impermeant fluorescent dye (SYTOX Green). hRegIIIα increased SYTOX Green uptake when added to the Gram-positive species Listeria monocytogenes, indicating damaged membranes (Fig. 1a,b). hRegIIIα has an anionic N-terminal prosegment that inhibits bactericidal activity (but not peptidoglycan binding) by docking to the core hRegIIIα protein through charge-charge interactions4. The prosegment is removed by trypsin upon secretion into the intestinal lumen, yielding bactericidally active hRegIIIα4. Bactericidally inactive pro-hRegIIIα did not induce SYTOX Green uptake, indicating minimal membrane permeabilization (Fig. 1a). Thus, hRegIIIα permeabilizes the bacterial membrane and the prosegment inhibits this activity.
Figure 1. hRegIIIα permeabilizes the bacterial membrane.

(a) Listeria monocytogeneswas treated with 25 μM hRegIIIα, pro-hRegIIIα, or BSA or left untreated, and bacterial uptake of SYTOX Green was measured. Results are representative of three independent experiments, and are expressed as a percentage of maximum SYTOX uptake in the presence of 0.2% SDS.
(b) SYTOX Green uptake by L. monocytogenes in the presence of increasing hRegIIIα concentrations. Assays were performed in triplicate. Means±SEM are plotted.
(c) Carboxyfluorescein (CF)-loaded liposomes (10 μM lipid; 85% PC/15% PS) were treated with 1 μM hRegIIIα. 1.0% octylglucoside (OG) was added towards the end to disrupt remaining liposomes. Dye efflux is expressed as percentage of maximal release by detergent. Results are representative of five independent experiments.
(d) 10 μM hRegIIIα was added to CF-loaded liposomes (100 μM lipid;100% PC, 100% PS or 85% PC:15% PS), and dyeefflux was monitored over time. Representative results are shown.
(e) Averaged results from three independent replicates of the experiment shown in (d). ns, not significant; **, p<0.01; ***, p<0.001.
(f) Initial rate of liposome dye efflux (100 μM lipid) as a function of hRegIIIα and pro-hRegIIIα concentration. Results are representative of three independent experiments. *, p<0.05; **, p<0.01.
(g) Intrinsic Trp fluorescence of 1 μM hRegIIIα was measured in the presence of increasing lipid concentrations.
(h) Trp fluorescence of 1 μM hRegIIIα and pro-hRegIIIα as a function of lipid concentration.
(i) Intrinsic Trp fluorescence of 1 μM hRegIIIα was measured in the presence of liposomes (100 μM lipid) of varying lipid composition.
(j) 5.0 μM hRegIIIα or pro-hRegIIIα was added to liposomes (100 μM lipid) incorporating 5% dansyl-PE and dansyl fluorescence was monitored. Assays were performed in triplicate.
(k) FRET efficiency as a function of hRegIIIα and pro-hRegIIIα concentration. Assays were performed in triplicate. Means±SEM are plotted.
To test directly for membrane disruption by hRegIIIα we used liposomes composed of 85% zwitterionic phospholipid (PC) and 15% acidic phospholipid (PS). The liposomes encapsulated carboxyfluorescein (CF), a fluorescent dye. hRegIIIα induced rapid dye efflux from PC/PS liposomes (Fig. 1c), which was reduced when PC-only liposomes were used (Fig. 1d,e). This indicates a preference for acidic phospholipids that is consistent with the acidic lipid content of bacterial membranes5 and with the salt sensitivity of hRegIIIα membrane toxicity (Extended Data Fig. 2a,b). These findings suggest that hRegIIIα interactions with lipid bilayers are mediated by electrostatic interactions. pro-hRegIIIα yielded a diminished rate of dye release (Fig. 1f), indicating that the prosegment inhibits membrane permeabilization.
We next assessed hRegIIIα lipid-binding activity by measuring changes in the intrinsic fluorescence of tryptophan (Trp) residues6. We observed increased Trp fluorescence intensity only when PS-containing liposomes were added to hRegIIIα (Fig. 1g-i) indicating that hRegIIIα interacts with acidic phospholipids. Furthermore, we observed fluorescence resonance energy transfer (FRET) between donor hRegIIIα Trp residues and dansyl-labeled PC/PS liposomes7 (Fig. 1j,k). FRET was inhibited by the pro-hRegIIIα N-terminal prosegment (Fig. 1j,k), suggesting that the prosegment inhibits bactericidal activity by hindering lipid binding. Consistent with its inability to bind lipids, pro-hRegIIIα did not inhibit hRegIIIα bactericidal activity in mixing experiments (Extended Data Fig. 2c).
Several membrane-active toxins destabilize membranes by forming monomeric or multimeric pores8. To test for hRegIIIα pores, we performed conductance studies in black lipid membranes, a model system that mimics the properties of a cell membrane9. hRegIIIα produced rapid single channel-like currents at -80 mV in the presence of Mg2+ ions (Fig. 2a), with no current detected at 0 mV. Using the Nernst-Planck equation we estimated the diameter of the pore at∼12 and 14 Å (Extended Data Fig. 3). The calculated pore size agreed with the lack of efflux of FITC-dextran-10 (FD10) or FD4, with Stokes diameters of ∼44 Å and ∼28 Å, respectively (Fig. 2b). In contrast, carboxyfluorescein (∼10 Å) passed readily through the pores (Fig. 1c,2b). These results show that hRegIIIα forms functional transmembrane pores and yield an estimate of the inner pore diameter.
Figure 2. hRegIIIα forms a transmembrane pore.

(a) hRegIIIα-dependent current flow across a planar lipid bilayer is depicted as a function of time. No current was observed prior to the application of a voltage across the membrane. Upon the application of -80 mV, inward current was observed, and returning to zero membrane potential diminished the current because the measured reverse potential was -4.0 mV. The current trace is representative of multiple independent experiments.
(b) Liposomes loaded with FITC-Dextran 10 (FD10), FITC-Dextran 4 (FD4), or carboxyfluorescein (CF) were treated with 5.0 μM hRegIIIα and dye release was monitored over time. 1% OG (octylglucoside) was added to disrupt the liposomes towards the end of the experiment.
(c) Negative-stain electron microscopy (EM) images of hRegIIIα in the presence of lipid bilayers. An individual hRegIIIα pore particle is shown in the right hand panel.
(d) hRegIIIα (100 μM) in the presence or absence of liposomes (1 mM lipid) was cross-linked with 5 mM 1-ethyl-3-[3-dimethylaminopropyl]carbodiimide hydrochloride (EDC). Cross-linked complexes were solubilized in detergent, resolved by size exclusion chromatography, and analyzed by Western blotting with anti-RegIII antibody. The predicted mobilities of hRegIIIα dimers, tetramers, and hexamers were calculated from the mobility of the monomer following cross-linking in the absence of liposomes (right panel).
When visualized by negative-stain electron microscopy (EM), numerous circular structures of ∼100 Å diameter were observed on liposomes incubated with hRegIIIα (Fig. 2c, Extended Data Fig. 4a). Although hRegIIIα is a monomer in solution10, the size of the pores suggested that they were multimeric. We therefore treated liposome-associated hRegIIIα with a cross-linking agent, solubilized the products in detergent, and separated them by size exclusion chromatography (Fig. 2d). In addition to a prominent monomer peak we detected a second, liposome-dependent peak at a lower retention volume, suggesting the formation of a multimeric complex. Western blotting showed a single hRegIIIα species with mobility similar to that predicted for a hexamer (Fig. 2d), suggesting that the pore was a hRegIIIα hexamer.
After longer incubations with lipid, hRegIIIα formed filaments (Extended Data Fig. 4b) similar to those in pancreatic secretions11. The filaments were ∼100 Å in diameter, correlating with the dimensions of the hRegIIIα pore (Fig. 2c). hRegIIIα filamentation required lipid and was dependent on hRegIIIα pore formation, as pro-hRegIIIα formed neither pores nor filaments (Extended Data Fig. 4b,d). Filamentation partially inhibited the ability of hRegIIIα to permeabilize membranes (Extended Data Fig. 4c, 5a-c), as observed with other membrane toxic host defense proteins where filamentation traps pore complexes and limits damage to host cells12. These findings indicate that the hRegIIIα filaments are higher-order assemblies of hRegIIIα pore complexes and show that filamentation limits hRegIIIα toxicity.
Although the ∼90 kDa hRegIIIα pore complex was too small for structure determination by single particle cryoelectron microscopy (cryoEM) methods13, the hRegIIIα filaments were sufficiently large for such analysis. We therefore reconstructed a 3D map of the hRegIIIα filament and extracted the structure of the minimal pore complex (Fig. 3a,b; Extended Data Fig. 6a-f). The nominal resolution of our structure, 9.2 Å, was limited by symmetry variability and filament bending (Extended Data Fig. 6g-j; Supplementary Information). Consistent with our cross-linking studies (Fig. 2d), the minimal pore was a hexamer formed by three hRegIIIα dimers related by helical symmetry. The outer diameter of the pore assembly was 89 Å, as observed by negative-stain EM (Fig. 2c). The pore height was 55 Å, sufficient to span a lipid bilayer (35-45 Å)14. The inner diameter was ∼18 Å, consistent with the pore size predicted by our conductance measurements (Extended Data Fig. 3) and dye release assays (Fig. 2b).
Figure 3. Structural model of the hRegIIIα pore complex.

(a) Top and side view of the cryoEM reconstruction of the hRegIIIα filament.
(b) Top and side view of the cryoEM map of the hRegIIIα hexameric complex at a nominal 9.2 Å resolution.
(c) Ribbon representation of the crystal structure of active monomeric hRegIIIα (PDB code 4MTH), aligned with the pro-hRegIIIα structure (PDB code 1UV0). The first 10 residues of the N-terminal prosegment are disordered and are therefore missing from the structure; these residues have been depicted as a dashed red line. Side chains in the loop encompassing amino acids 93-99 (KSIGNSY) are shown as sticks.
(d) Stereo diagram showing docking of the active hRegIIIα crystal structure into the cryoEM density map. The docked structures are alternately colored blue and cyan to aid in visualization of the individual subunits. The positions of K93 and E114 are indicated.
(e) 5 μM of wild-type, K93A mutant, or E114Q mutant hRegIIIα was added to 100 μM CF-loaded liposomes and dye efflu xwas monitored.
(f) 1 μM wild-type or K93A mutant hRegIIIα was assayed for membrane disruption in bacteria using the SYTOX uptake assay described in Fig. 1. Assays were performed in triplicate and results are expressed relative to wild-type hRegIIIα. Error bars, ±SEM; **, p<0.01.
(g) Most energetically stable membrane configuration around the embedded hexamer. The upper membrane boundary (gray surface) bends down to expose large charged portions of the protein to water, while the lower membrane boundary (gray surface) exhibits minor deflections. The region between the upper and lower boundaries is a water inaccessible region composed of the high-dielectric headgroups and the low-dielectric core. A stretch of hydrophobic residues (yellow) is in the center of the membrane, while charged (basic in blue and acidic in red) and polar (green) residues are near the upper and lower membrane boundaries in the high-dielectric headgroup region.
(h) Using the configuration in (g), we added negatively charged point charges to the headgroup regions to model addition of PS lipids (red dots in the inset model). At low values, the total insertion energy for the wild-type protein is positive indicating a lack of stability, but above 10 negatively-charged lipids, the hexamer is stabilized in the membrane (black curve). The optimal lipid configuration is indicated by *. The insertion energy for the K93A mutant is in red. Inset: top down view; red dots=PS lipids, blue=R and K residues, white dots=uncharged lipid positions.
hRegIIIα, like other epithelial bactericidal proteins such as α-defensins, is constrained by disulfide bonds that prohibit large secondary structure changes upon moving from an aqueous to an apolar milieu15,16. This suggested the feasibility of docking the 3D structure of the hRegIIIα monomer into the EM density map in order to further model the organization of the pore complex. First, we determined the crystal structure of processed, bactericidally active hRegIIIα (Extended Data Fig. 7a) and compared it to the previously determined structure of bactericidally-inactive pro-hRegIIIα. The two structures were similar, although the amino acid side chains of the loop encompassing residues 93-99 (sequence KSIGNSY) adopted different orientations in the active hRegIIIα structure (Fig. 3c). This was consistent with the conformational flexibility of this loop as indicated by a higher crystallographic B-factor (Extended Data Fig. 7b).
The active hRegIIIα structure could be docked into the cryo-EM hexameric density map (Fig. 3d, Extended Data Fig. 6k,l), providing good spatial constraints for building a hexameric model. The model suggests that the hRegIIIα subunits in the pore assembly are oriented with the carbohydrate-binding loop pointing towards the central channel, and the loop encompassing residues 93-99 and the N- and C-termini oriented toward the lipid bilayer (Fig. 3d). The resolution of our map did not allow us to extract detailed information about intermolecular interactions in the pore complex. There was imperfect docking of the carbohydrate-binding loop, the loop encompassing residues 93-99, and the far N-terminus (Fig. 3d), consistent with the conformational flexibility of these regions (Extended Data Fig. 7b).
We used mutagenesis to experimentally assess the orientation of hRegIIIα in the pore complex. Our model predicts that the basic residue K93 is oriented toward the lipid bilayer (Fig. 3d) and thus might be involved in interactions with the negatively-charged phospholipids required for hRegIIIα-liposome interactions (Fig. 1d,e). A K93A mutation, but not conservative K93R and K93H mutations, reduced the toxicity of hRegIIIα for liposomes as well as intact bacteria (Fig. 3e,f; Extended Data Fig. 8a). In contrast, an E114Q mutation, which resides in the carbohydrate-binding loop (Fig. 3c)3, did not impact membrane toxicity, consistent with its predicted position near the pore interior (Fig. 3d,e). As expected, the K93A mutation but not the E114Q mutation inhibited filament formation (Extended Data Fig. 8b). Finally, the orientation of the N-terminus toward the lipid bilayer is consistent with the role of the N-terminal prosegment in inhibiting hRegIIIα interactions with lipid and reducing membrane toxicity (Fig. 1a,f,h,j,k).
We next calculated the energetics of pore insertion into a PC-like membrane bilayer using physics-based computational modelling (Extended Data Fig. 9a-d)17. The model predicts that basic residues are located near the membrane-water interface while a strip of hydrophobic and polar residues is buried in the membrane core (Fig. 3g). The complex presents a positive electric field to the membrane (Extended Data Fig. 9e,f), creating an unfavorable electrostatic energy unless negatively-charged PS-like lipids are added to the membrane (Fig. 3h). This is consistent with our finding that PS lipids are necessary for hRegIIIα toxicity (Fig. 1d,e). Finally, calculations on the K93A mutant showed reduced stability (Fig. 3h) due to loss of favorable electrostatic interactions between K93 and negatively-charged lipids. Thus, the model reveals that charge sequestration is a critical determinant of hRegIIIα pore stability in the membrane. Furthermore, the model predicts that R166 interacts with the membrane surface (Extended Data Fig. 10a). Consistent with this prediction, an R166A mutation reduced membrane toxicity of hRegIIIα (Extended Data Fig. 10b). In contrast, mutating R39, which is exposed to aqueous solvent in the model, had little effect on hRegIIIα membrane toxicity (Extended Data Fig. 10a,b). Thus, our model accurately predicts the experimental behavior of the hRegIIIα pore.
hRegIIIα selectively targets Gram-positive bacteria1, raising the question of why hRegIIIα cannot kill Gram-negative bacteria by permeabilizing the outer membrane. In contrast to PC/PS liposomes, liposomes composed of an E. coli total lipid extract were not disrupted by hRegIIIα (Fig. 4a), suggesting that a component of the lipid extract inhibited membrane permeabilization. Lipopolysaccharide (LPS), a major constituent of the Gram-negative outer membrane, inhibited hRegIIIα-mediated liposome disruption and antibacterial activity (Fig. 4b,c), suggesting that LPS is one factor that prevents hRegIIIα-mediated permeabilization of Gram-negative bacteria.
Figure 4. Regulation of hRegIIIα pore formation.

(a-c) hRegIIIα pore formation is inhibited by lipopolysaccharide. (a) 10 μM hRegIIIα was added to liposomes composed of lipids from an E. coli total lipid extract or from PC/PS as a control. (b) 10 μM hRegIIIα was added to liposomes (100 μM lipid) in the presence of varying LPS concentrations. (c) 10 μM hRegIIIα was added to ∼104 cfu of log phase L. monocytogenes in the presence of varying LPS concentrations. The assay was carried out at 37°C for 2 hours, and surviving bacteria were quantified by dilution plating. Assays were done in triplicate. Results in a-care representative of two independent experiments.
(d-e) The hRegIIIα N-terminal prosegment limits toxicity toward mammalian cells. (d) hRegIIIα was added to MODE-K cells and cytotoxicity was determined by quantifying lactate dehydrogenase (LDH) release. LDH activity was assessed by spectrophotometric detection of an enzymatic product of LDH at 492 nm. (e) 10 μM hRegIIIα or pro-hRegIIIα was added to MODE-K cells and LDH release was quantified. Maximum LDH release was determined by treating cells with NP-40 detergent.
Finally, we hypothesized that the trypsin-cleavable inhibitory N-terminus of pro-hRegIIIα evolved to suppress pore-forming activity and thus minimize cytotoxicity during hRegIIIα synthesis and storage in epithelial cells. In support of this idea, hRegIIIα was cytotoxic towards cultured intestinal epithelial cells (MODE-K)18, and the prosegment suppressed this cytotoxicity (Fig. 4d,e).
Thus, RegIIIα kills its bacterial targets by oligomerizing on the bacterial membrane to form a membrane-penetrating pore (Extended Data Fig. 1). Membrane attack by pore formation represents a previously-unappreciated biological activity for the C-type lectin family. Our findings may provide insight into the evolutionary origins of the lectin-mediated complement pathway, in which recruited complement proteins disrupt microbial membranes19. With its intrinsic capacity for membrane attack, hRegIIIα may represent a more evolutionarily primitive mechanism of lectin-mediated innate immunity. We propose that the lectin-mediated complement pathway could have evolved from a directly bactericidal ancestral lectin, with the bacterial recognition function retained by the descendent C-type lectin(s) and the membrane attack function assumed by recruited accessory proteins that assemble into the membrane attack complex.
Methods
Reagents
Bovine serum albumin, 5(6)-carboxyfluorescein (CF), and LPS were purchased from Sigma. SYTOX Green nucleic acid stain was from Invitrogen. All lipids (1-palmitoyl-2-oleoyl-sn-glycero-3-phosphocholine (PC), 1,2-dioleoyl-sn-glycero-3-phospho-L-serine (PS), 1,2-dioleoyl-sn-glycero-3-phosphoethanolamine-N-(5-dimethylamino-1-naphthalenesulfonyl) (dansyl-PE), and E. coli total lipid extract) were from Avanti Polar Lipids. n-octyl-β-D-glucopyranoside (OG) and dodecyl maltoside (DM) were from Anatrace and 1-ethyl-3-[3-dimethylaminopropyl]carbodiimide hydrochloride (EDC) was from Thermo Scientific Pierce.
Bacterial membrane permeabilization assay
10 ml of a mid-logarithmic phase culture of Listeria monocytogenes (OD600 of 0.6=109 bacteria/ml) was pelleted, washed and resuspended in 5.0 ml buffer (10 mM MES pH 5.5 and 25 mM NaCl). 25 μM of hRegIIIα, pro-hRegIIIα or BSA were incubated at varying concentrations with 5×10⁷ bacteria for the indicated times. 0.50 μM SYTOX Green dye (λEx=504 nm and λEm=523 nm) was then added to each reaction and incubated for 10 minutes at room temperature. Membrane permeabilization was assessed by measuring fluorescence with a BMG Labtech microplate reader and was expressed as a percentage of maximum SYTOX uptake in the presence of 0.2% SDS.
Preparation of unilamellar liposomes
Liposomes were prepared as described previously with some modifications20. Briefly, lipids were dried in glass tubes under a stream of N2 gas and placed under vacuum for 2 hours to overnight. For fluorescent donor liposomes, 5% PC was replaced with 5% dansyl-PE (PC:PS:dansyl-PE= 80%:15%:5%). The lipid film was resuspended in 300 μL of 10 mM MES pH 5.5 and 25 or in 100 mg/ml of carboxyfluorescein (CF) made in the same buffer. Lipid suspensions were vortexed continuously for 5 minutes and then subjected to five freeze-thaw cycles in liquid N2. To obtain unilamellar vesicles, liposomes were extruded with 21 passes through a mini-extruder device (Avanti) using 80 nm- or 200 nm-sized membranes. For assays using CF dye, liposomes were separated from unincorporated dye on G25 PD10 columns (GE Healthcare).
Dye leakage assay
Fluorescence of CF-loaded liposomes (10-100 μM lipid; 80 nm size) was monitored over time on a PTI spectrofluorometer using λEx=480 nm and λEm=517 nm. 0.25 to 5 μM of hRegIIIα or pro-hRegIIIα was added to the cuvette 200 seconds after the addition of CF-loaded liposomes. At the end of the assay (>1000 sec), 1% of the detergent OG was added for complete solubilization of the liposomes. Fluorescence counts were recorded as % CF release and were plotted as a function of time. All fluorescence measurements were recorded on a Photon Technology Incorporated (PTI) Spectrofluorometer.
Tryptophan fluorescence assays
The emission spectra of intrinsic tryptophan fluorescence of hRegIIIα (1.0 μM) in the absence or presence of 100 μM PC/PS (85%/15%) vesicles were recorded on a PTI Spectrofluorometer between 290 and 450 nm at a fixed excitation wavelength of 280 nm.
FRET assays
Binding of hRegIIIα and pro-hRegIIIα to liposomes was measured by fluorescence resonance energy transfer (FRET) between protein tryptophan residues and dansyl-PE, a fluorescent lipid. 5.0 μM of hRegIIIα or pro-hRegIIIα was added to freshly prepared dansyl-PE liposomes (20 μM lipid) in 10 mM MES pH 5.5 and 25 mMNaCl for 5 minutes at room temperature and the fluorescence spectra were recorded on a PTI Spectrofluorometer with excitation at 295 nm. Emission spectra were collected at 1 nm increments from 460-580 nm. A control sample containing liposomes alone was subtracted, and FRET efficiency was calculated using the equation: Fc= F/Fb-1, where F is the dansyl fluorescence measured from the protein sample, Fb is the baseline fluorescence from the control, and Fc is the corrected fluorescence21.
Negative staining electron microscopy
Copper grids (Ted Pella Inc.) coated with a layer of thin carbon film (∼5 nm) were rendered hydrophilic immediately before use by glow-discharge in air with 40 mA current for 90 s. 2.0 μL of samples from liposomes (2.5 mM lipid; 85%/15% PC/PS) alone or incubated for 5 minutes with 1.0 μM hRegIIIα were loaded onto the grids, incubated for ∼1 minute and blotted, leaving a thin layer of sample on the grid surface. The grids were floated on a drop of stain solution (2.0% uranyl formate containing 0.5% trehalose) for 60-90 s. After air-drying the grids were inserted into a JEOL 2200FS FEG transmission electron microscope. Images were taken in low-dose mode (∼20 electron/Å2) at 60,000X with the defocus level between −1.2 to −2.0 microns. Regular calibrations of the microscope magnifications found that the nominal 60,000x used here was always accurate within 3.0% error. The low-dose mode was used to take CCD images using a 2Kx2K Tietz slowscan CCD camera (with a 1.69 post-column magnification factor).
Cross-linking experiments
100 μM hRegIIIα was incubated with liposomes (1 mM lipid; 85% PC/15% PS) for 20 minutes followed by 1 hour treatment with 5 mM of the cross-linking reagent, EDC, at room temperature. 40 mM n-decyl-β-D-maltopyranoside (DM) detergent was added and the sample was rotated overnight at room temperature. The sample was centrifuged for 10 minutes at 16,000g and loaded onto a Superdex 75 10/300 GL column equilibrated in 10 mM MES pH 5.5, 25 mMNaCl, and 4 mM DM. Peak fractions were collected, treated with 5X SDS-sample buffer and separated by SDS-PAGE followed by Western blotting and detection with anti-RegIII antibody1.
Extended Data
Extended Data Figure 1. Model of RegIIIα bactericidal function.

An overall model that incorporates both the peptidoglycan and lipid-binding functions of hRegIIIα is depicted. Combining our current and previous findings, we propose that hRegIIIα recognizes and kills its bacterial targets in two distinct steps. First, hRegIIIα is secreted from epithelial cells as a soluble monomer that recognizes Gram-positive bacteria by binding to peptidoglycan carbohydrate via an EPN motif located in the long loop region1,3. Second, hRegIIIα kills bacteria by oligomerizing in the bacterial membrane to form a hexameric membrane-penetrating pore that is predicted to induce uncontrolled ion efflux with subsequent osmotic lysis. The inhibitory N-terminus of pro-hRegIIIα hinders lipid binding and consequently suppresses pore formation until it is removed by trypsin after secretion into the intestinal lumen4. We propose that the inhibitory N-terminal peptide evolved in order to minimize collateral damage from the hRegIIIα pore-forming activity during hRegIIIα storage in the membrane-bound secretory granules of epithelial cells. In support of this idea, we found that hRegIIIα damages mammalian cell membranes and that the N-terminal prosegment limits this toxicity (Fig. 4d,e).
Extended Data Figure 2. Characterization of hRegIIIα membrane permeabilization activity.

a,b, Impact of NaCl concentration on hRegIIIα membrane permeabilization activity. a, 10 μM hRegIIIα was added to liposomes (100 μM lipid) in the presence of varying NaCl concentrations. Representative results are shown. b, Averaged results from three independent replicates of the experiment shown in a. c, pro-hRegIIIα does not inhibit hRegIIIα bactericidal activity. 10 μM of purified recombinant pro-hRegIIIα, hRegIIIα, or a combination of the two was added to ∼105 CFU of Listeria monocytogenes for 2 hours at 37°C. Surviving bacteria were quantified by dilution plating.
Extended Data Figure 3. hRegIIIα forms a transmembrane pore.

Analysis of hRegIIIα conductance in lipid bilayers. The trace of a typical single channel recording gave rise to the event histogram shown here. At -80 mV, there was a short latency before the first opening event, which led to the base line current of -6.5 pA at -80 mV. The baseline current was subtracted so that the baseline corresponds to a peak at 0 pA. Once we assigned two basic peaks at -53 pA and -81 pA as two independent opening events (i1 and i2), all the other major peaks in the histogram are linear combinations of these two basic events (as labeled). The data therefore suggested two different scenarios. One is that there are three pores, and each pore has two different conducting states, which may reflect the flexible diameter of the pore. The other is that i1 and i2 reflect two different pores that have different diameters, and that there are at least five different channels in the membrane in order to produce the observed histogram. This second scenario correlates with the observed variability in helical symmetry. With the idea of variability and protein dynamics in mind, it is likely that the two types of pores may interconvert with each other in the membrane.
From the basic events, we estimated the pore diameters by applying the Nernst-Planck equation. In the experimental conditions, our recording chambers had 150 mM K+, 25 mM Na+, 215 mM Cl-, 20 mM Mg2+, and 10 mM MES pH 5.5 in the cis side, and 20 mM K+, 25 mM Na+, 45 mM Cl-, and 10 mM MES pH 5.5 in the trans side. The reversal potential (EK, ENa, ECl, and EMES) for each ion could be calculated (EK= 50.9 mV, ENa = 0 mV= EMES, and ECl = -39.5 mV). In the trans side, there is a trace amount of Mg2+ (∼10 μM), which gives a reversal potential EMg of 92 mV. Our dye leakage assay showed that the pore was open at Vmem = 0 mV transmembrane potential, ruling out significant voltage-dependent gating of the hRegIIIα channel. Based on the ion replacement studies we did for different ions, we estimated the relative permeability of different ions to be: PK = PNa = 1.0; PCl = 0.85; PMES = 0.73 and PMg = 0.66. The measured relative permeation rates showed that the pore has very weak cation-selectivity, and favors K+/Na+ over Mg2+ due to the charge density difference. Under the same assumption, the average conductance (<g>) of the two basic opening events (i1 and i2) could be calculated as the following:
The two calculated conductance levels of 100 pS and 152 pS were then entered into the Nernst-Planck equation for electrodiffusion and gave rise to an approximate estimate of the pore diameter of 12 and 14 Å respectively, which is in good agreement with the observed pore size in the reconstructed 3D structure of the pore (Fig. 3b). A more rigorous calculation of the ion flux is possible with a high-resolution picture of the potential profile, but is beyond the scope of this paper.
Extended Data Figure 4. Analysis of liposome-associated hRegIIIα by electron microscopy (EM).

a, Negative staining EM controls lacking hRegIIIα or liposomes are shown. b-d, hRegIIIα pore complexes assemble into filaments. b, hRegIIIα forms filaments in the presence of lipid vesicles. 20 μM hRegIIIα was incubated for 2 or 20 minutes with unilamellar vesicles composed of PC/PS (85%:15%). Samples were visualized by transmission electron microscopy. Grids were stained with anti-RegIII antibody1,10 to confirm that the filaments were composed of hRegIIIα. Filamentation required membranes, as no filaments were observed in the absence of liposomes. Arrows indicate examples of filaments in each image. c, 20 μM hRegIIIα carrying a mutation near the C-terminus [C-terminal sequence: FTD (wild-type)→VH (mutant)] was incubated for 20 minutes with unilamellar vesicles and visualized by cryoEM and negative-staining EM. The results demonstrate that the VH mutant retains the ability to form pores in lipid bilayers but cannot form filaments. A comparison of the wild-type and mutated C-terminus is shown below. d, Quantification of filament formation by 20 μM pro-hRegIIIα, wild-type (wt) and C-terminal mutant (VH) hRegIIIα in the presence of vesicles. Results are representative of counts from three different areas. nd, not detected. The results show that pro-hRegIIIα, which cannot form pores, also cannot assemble into filaments.
Extended Data Figure 5. Filament formation inhibits hRegIIIα membrane toxicity.

Here we examined the functional properties of the hRegIIIα VH mutant carrying a mutation near the C-terminus [C-terminal sequence: FTD (wild-type)→VH(mutant)], thus truncating the protein near the C-terminus. The VH mutant lacks the ability to form filaments but retains the ability to form pores. In accordance with its pore-forming activity, the hRegIIIα VH mutant retained membrane toxicity against liposomes and live bacteria. In fact, membrane toxicity was modestly enhanced in the hRegIIIα VH mutant, suggesting that trapping of the pore complexes in filaments inhibits their membrane permeabilizing activity. This function contrasts with that of human α-defensin-6 filaments, which directly trap bacteria in “nanonets”22.
a, 1.0 μM wild-type (wt) and hRegIIIα (VH) mutant was added to 10 μM CF-loaded liposomes and dye release was monitored. The detergent octylglucoside (OG) was added at the end of the experiment to disrupt remaining liposomes. b, Initial rate of liposome dye release (10 μM lipid) as a function of wild-type and mutant hRegIIIα concentration. c, 5.0 μM wild-type or hRegIIIα (VH) mutant was assayed for membrane disruptive activity toward whole bacteria using the SYTOX uptake assay described in Fig. 1. Assays were performed in triplicate. Error bars, ±SD; ***, p<0.001.
Extended Data Figure 6. CryoEM reconstruction of the hRegIIIα filament structure.
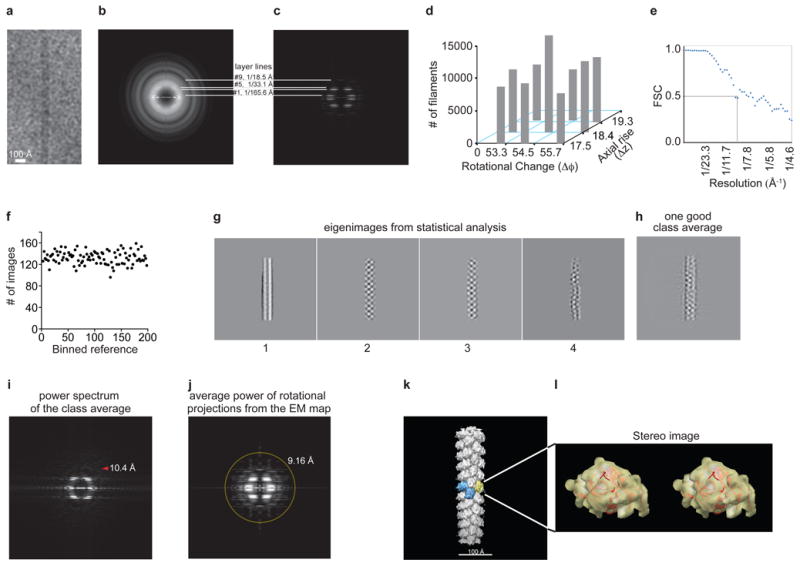
a, Raw image of a single filament. b,c, Comparison of the average power spectrum of cryoEM images of individual short helical segments, b, and the average power spectrum, c, from the projections of the 3D reconstruction at evenly sampled rotation angles around the helical axis. Layer lines 1, 5 and 9 were labeled, and layer line 4 was clearly visible. d, Symmetry variability (Δφ and Δz) in the cryoEM dataset. The reconstruction from the aligned images was imposed with symmetry parameters that vary around the center pair (Δφ=54.5° and Δz=18.4 Å), and the experimental dataset was classified into nine bins by projection matching. The populations in these classes were exhibited in a 3D histoplot. Even though the central bin is the most populated, the distribution is approximately flat. e, FSC calculated from the same two independent volumes but windowed in the same boxes. The strong symmetry in the two volumes led to the FSC ∼0.2 at the Nyquist frequency. The first fast drop of FSC curve to 0.5 was elected to give a conservative estimate of resolution. f, Number of the filament images aligned with each reference projection from the 3D model in the last round of refinement. The projections from the 3D model evenly sampled the orientation space. As expected, the distribution is fairly flat. g-j, Statistical analyses of the hRegIIIα filament structure. g, First four eigenimages from the multivariate statistical analysis of the centered filaments in the dataset that were padded to 320 pixels in size. The second and third images lack the symmetry around the central line, suggesting the parity is odd. The fourth image shows the significant bending of the filaments, a major limiting factor for us in reaching a better resolution in our reconstruction. h, A good class average after the multivariate statistical analysis and hierarchical classification. i, Square root of calculated power spectrum. The tip of the red arrowhead points at 10.4 Å. j, The layer lines in the average power spectrum of the rotational projections from the final reconstruction without symmetry imposition extend isotropically to ∼9.2 Å (yellow circle), and further along the vertical direction (helical axis). k,l, Docking of the hRegIIIα crystal structure into the cryoEM map. k, The 3D reconstruction from IHRSR of the images in the central bin, d, with a hexameric pore highlighted. l, Stereo image showing docking of the RegIIIα crystal structure in the cryoEM density map of one subunit out of the reconstruction.
Extended Data Figure 7. Crystal structure of bactericidally-active hRegIIIα.

a, Table showing data collection and refinement statistics for the active hRegIIIα crystal structure. b, Crystallographic B-factor map of the active hRegIIIα structure showing areas of conformational flexibility. Red=greater flexibility.
Extended Data Figure 8. hRegIIIα mutagenesis.

a, Mutagenesis of K93 with conservative amino acid substitutions (R and H) does not alter membrane toxicity of hRegIIIα. 5 μM of wild-type, K93R mutant, or K93H mutant hRegIIIα was added to 100 μM CF-loaded liposomes and dye release was monitored. These mutants retain membrane toxicity, in contrast to K93A (Fig. 3e), suggesting the importance of positive charges at these sites. b, Filamentation of hRegIIIα mutants (K93A and E114Q) correlates with membrane toxicity. 20 μM hRegIIIα K93A (left panel) or E114Q (right panel) was incubated for 20 minutes with unilamellar vesicles and visualized by negative-staining EM. The results demonstrate that the non-toxic E114Q mutant, unlike the toxic K93A mutant, assembles into filaments.
Extended Data Figure 9. Computational modeling of hRegIIIα insertion into membranes.

a, Top down view of the numeric grid and complex boundary used in the elasticity calculations to represent the upper leaflet. The protein complex occupies the white space in the center, and the membrane-protein contact curve is the red-white boundary. The membrane is modeled in all non-white regions. The rectangular grid for the elasticity solver is shown here colored by the membrane bending energy density (red is high bending energy and blue is low bending energy). This calculation corresponds to the membrane bending shown in Fig. 3g. b-d, Numeric convergence of the model. b, Convergence of the elastostatic energy. In all panels, percent error was calculated as 100·|(E(n) − E(nmax))/E(nmax)|, where E(n) = energy calculated with n grid points, and nmax = maximum number of grid points used. The elastic energy converges smoothly as n increases, and we used n = 400 in both the x and y directions for all calculations in the main text, which gives a 5% error. c, Convergence of the electrostatic energy. Percent error of the dipole charge-protein interaction energy (diamonds), protein solvation energy (squares), anionic lipid charge-protein interaction energy (circles) and the total electrostatic energy (triangles) are shown as a function of the grid discretization. A value of n = 161 was used for the calculations discussed in the main text resulting in a total electrostatic error of 2.5%. d, Convergence of the non-polar energy. A discretization of n = 100 points was used for the calculations reported in the main text, and this has a very small error on the order of 0.1%. Values used for calculations in the main text are indicated by *. e,f, Electrostatic potential of the hRegIIIα pore complex. e, In-plane view. The Poisson-Boltzmann equation was solved using APBS after embedding the complex in a low dielectric region mimicking the lipid bilayer23. The low dielectric membrane region is deformed corresponding with the lowest energy shape predicted by our physics-based computational model. Positive (blue) isocontours of the electrostatic potential are drawn at +5 kcal/mol/e. f, Out-of-plane view. All details are identical to those in panel a. Both positive (blue) and negative (red) isocontours of the electrostatic potential are drawn at ±5 kcal/mol/e. g, Table showing bilayer material properties used in the modeling calculations. h, Table showing model parameters.
Extended Data Figure 10. Modeling of hRegIIIα-membrane interactions.

a, hRegIIIα pore complex model shown from the side. R166 is located near the water-membrane interface, suggesting that it is positioned to interact with the phospholipid headgroups, while R39 is predicted to be exposed to aqueous solvent. Membrane boundaries predicted from the computational calculations are indicated. b, 5 μM of wild-type, R166A mutant, or R39A mutant hRegIIIα was added to 100 μM CF-loaded liposomes and dye release was monitored. The experimental results are consistent with the position of these residues relative to the membrane interface in the model.
Supplementary Material
Acknowledgments
We thank Timothy Craig for assistance with the liposome disruption assays. The MODE-K cell line was kindly provided by D. Kaiserlian, INSERM U851, Lyon, France. We thank Dr. Edward Egelman for sharing his programs and for offering advice on cryoEM data analysis. This work was supported by NIH R01 DK070855 (LVH), NIH R01 GM088745 and GM093271 (Q-X.J), NIH R01 NS40944 (JR), Welch Foundation (I-1684 to Q-XJ), NSF CAREER MCB0845286 (MG), a Helen Hay Whitney Fellowship (SM), a Burroughs Wellcome Foundation New Investigators in the Pathogenesis of Infectious Diseases Award (LVH), and the Howard Hughes Medical Institute (LVH). Coordinates of the crystallographic structure of active hRegIIIα have been deposited in the PDB with accession codes 4MTH. The cryoEM map has also been deposited in the 3D EM database (EMD–27937).
Footnotes
Author contributions: S.M., Q.-X.J., and L.V.H. designed the research, analyzed data, and wrote the paper. S.M., H.Z., C.L.P., D.R., and D.C.P. performed the experiments. M.D. determined the crystal structure of bactericidally-active hRegIIIα. K.C. and M.G. performed the physics-based computational modeling studies. S.M., H.Z., C.L.P., J.R., and L.V.H. interpreted the data.
Author information: Reprints and permissions information is available at www.nature.com/reprints.
The authors declare no competing financial interests.
Supplementary Information is linked to the online version of the paper at www.nature.com/nature.
References
- 1.Cash HL, Whitham CV, Behrendt CL, Hooper LV. Symbiotic bacteria direct expression of an intestinal bactericidal lectin. Science. 2006;313:1126–1130. doi: 10.1126/science.1127119. [DOI] [PMC free article] [PubMed] [Google Scholar]
- 2.Vaishnava S, et al. The antibacterial lectin RegIIIγ promotes the spatial segregation of microbiota and host in the intestine. Science. 2011;334:255–258. doi: 10.1126/science.1209791. [DOI] [PMC free article] [PubMed] [Google Scholar]
- 3.Lehotzky RE, et al. Molecular basis for peptidoglycan recognition by a bactericidal lectin. Proc Natl Acad Sci U S A. 2010;107:7722–7727. doi: 10.1073/pnas.0909449107. [DOI] [PMC free article] [PubMed] [Google Scholar]
- 4.Mukherjee S, et al. Regulation of C-type lectin antimicrobial activity by a flexible N-terminal prosegment. J Biol Chem. 2009;284:4881–4888. doi: 10.1074/jbc.M808077200. [DOI] [PMC free article] [PubMed] [Google Scholar]
- 5.Zasloff M. Antimicrobial peptides of multicellular organisms. Nature. 2002;415:389–395. doi: 10.1038/415389a. [DOI] [PubMed] [Google Scholar]
- 6.Kraft CA, Garrido JL, Leiva-Vega L, Romero G. Quantitative analysis of protein-lipid interactions using tryptophan fluorescence. Sci Signal. 2009;2:l4. doi: 10.1126/scisignal.299pl4. [DOI] [PubMed] [Google Scholar]
- 7.Fernandez I, et al. Three-dimensional structure of the synaptotagmin 1 C2B-domain: synaptotagmin 1 as a phospholipid binding machine. Neuron. 2001;32:1057–1069. doi: 10.1016/s0896-6273(01)00548-7. [DOI] [PubMed] [Google Scholar]
- 8.Brogden KA. Antimicrobial peptides: pore formers or metabolic inhibitors in bacteria? Nat Rev Micro. 2005;3:238–250. doi: 10.1038/nrmicro1098. [DOI] [PubMed] [Google Scholar]
- 9.Mueller P, Rudin DO, Tien HT, Wescott WC. Reconstitution of cell membrane structure in vitro and its transformation into an excitable system. Nature. 1962;194:979–980. doi: 10.1038/194979a0. [DOI] [PubMed] [Google Scholar]
- 10.Cash HL, Whitham CV, Hooper LV. Refolding, purification, and characterization of human and murine RegIII proteins expressed in Escherichia coli. Prot Expr Purif. 2006;48:151–159. doi: 10.1016/j.pep.2006.01.014. [DOI] [PMC free article] [PubMed] [Google Scholar]
- 11.Ho MR, et al. Human pancreatitis-associated protein forms fibrillar aggregates with a native-like conformation. J Biol Chem. 2006;281:33566–33576. doi: 10.1074/jbc.M604513200. [DOI] [PubMed] [Google Scholar]
- 12.Kagan BL, et al. Antimicrobial properties of amyloid peptides. Mol Pharm. 2012;9:708–717. doi: 10.1021/mp200419b. [DOI] [PMC free article] [PubMed] [Google Scholar]
- 13.Jiang QX, Wang DN, MacKinnon R. Electron microscopic analysis of KvAP voltage-dependent K+channels in an open conformation. Nature. 2004;430:806–810. doi: 10.1038/nature02735. [DOI] [PubMed] [Google Scholar]
- 14.Lodish H, et al. Molecular Cell Biology. W.H. Freeman; 2000. [Google Scholar]
- 15.Kagan BL, Selsted ME, Ganz T, Lehrer RI. Antimicrobial defensin peptides form voltage-dependent ion-permeable channels in planar lipid bilayer membranes. Proc Natl Acad Sci U S A. 1990;87:210–214. doi: 10.1073/pnas.87.1.210. [DOI] [PMC free article] [PubMed] [Google Scholar]
- 16.Zhang Y, Lu W, Hong M. The membrane-bound structure and topology of a human α-defensin indicate a dimer pore mechanism for membrane disruption. Biochemistry. 2010;49:9770–9782. doi: 10.1021/bi101512j. [DOI] [PMC free article] [PubMed] [Google Scholar]
- 17.Callenberg KM, Latorraca NR, Grabe M. Membrane bending is critical for the stability of voltage sensor segments in the membrane. J Gen Physiol. 2012;140:55–68. doi: 10.1085/jgp.201110766. [DOI] [PMC free article] [PubMed] [Google Scholar]
- 18.Vidal K, Grosjean I, evillard JP, Gespach C, Kaiserlian D. Immortalization of mouse intestinal epithelial cells by the SV40-large T gene. Phenotypic and immune characterization of the MODE-K cell line. J Immunol Methods. 1993;166:63–73. doi: 10.1016/0022-1759(93)90329-6. [DOI] [PubMed] [Google Scholar]
- 19.Ip WKE, Takahashi K, Ezekowitz RA, Stuart LM. Mannose-binding lectin and innate immunity. Immunol Rev. 2009;230:9–21. doi: 10.1111/j.1600-065X.2009.00789.x. [DOI] [PubMed] [Google Scholar]
- 20.Araç D, et al. Close membrane-membrane proximity induced by Ca2+-dependent multivalent binding of synaptotagmin-1 to phospholipids. Nat Struct Mol Biol. 2006;13:209–217. doi: 10.1038/nsmb1056. [DOI] [PubMed] [Google Scholar]
- 21.Novakovic VA, et al. Membrane-binding properties of the Factor VIII C2 domain. Biochem J. 2011;435:187–196. doi: 10.1042/BJ20101797. [DOI] [PMC free article] [PubMed] [Google Scholar]
- 22.Chu H, et al. Human α-defensin 6 promotes mucosal innate immunity through self-assembled peptide nanonets. Science. 2012;337:477–481. doi: 10.1126/science.1218831. [DOI] [PMC free article] [PubMed] [Google Scholar]
- 23.Shrake A, Rupley JA. Environment and exposure to solvent of protein atoms. Lysozyme and insulin. J Mol Biol. 1973;79:351–371. doi: 10.1016/0022-2836(73)90011-9. [DOI] [PubMed] [Google Scholar]
- 24.Henriksen J, et al. Universal behavior of membranes with sterols. Biophys J. 2006;90:1639–1649. doi: 10.1529/biophysj.105.067652. [DOI] [PMC free article] [PubMed] [Google Scholar]
- 25.Kucerka N, Tristram-Nagle S, Nagle JF. Closer look at structure of fully hydrated fluid phase DPPC bilayers. Biophys J. 2006;90:L83–5. doi: 10.1529/biophysj.106.086017. [DOI] [PMC free article] [PubMed] [Google Scholar]
- 26.Petrache HI, et al. Structure and fluctuations of charged phosphatidylserine bilayers in the absence of salt. Biophys J. 2004;86:1574–1586. doi: 10.1016/S0006-3495(04)74225-3. [DOI] [PMC free article] [PubMed] [Google Scholar]
- 27.Fuller N, Benatti CR, Rand RP. Curvature and bending constants for phosphatidylserine-containing membranes. Biophys J. 2003;85:1667–1674. doi: 10.1016/s0006-3495(03)74596-2. [DOI] [PMC free article] [PubMed] [Google Scholar]
- 28.Nielsen C, Goulian M, Andersen OS. Energetics of inclusion-induced bilayer deformations. Biophys J. 1998;74:1966–1983. doi: 10.1016/S0006-3495(98)77904-4. [DOI] [PMC free article] [PubMed] [Google Scholar]
- 29.White SH. Formation of ‘solvent-free’ black lipid bilayer membranes from glyceryl monooleate dispersed in squalene. Biophys J. 1978;23:337–347. doi: 10.1016/S0006-3495(78)85453-8. [DOI] [PMC free article] [PubMed] [Google Scholar]
Associated Data
This section collects any data citations, data availability statements, or supplementary materials included in this article.