

Abstract
Histones are chromatin proteins that are highly modified with many different types of post-translational modifications. These modifications act in concert to regulate a number of chromatin-related processes. However, identification and quantification of co-occurring histone post-translational modifications is challenging because there are many potential combinations of modifications and because the commonly used strategy of fragmenting proteins using trypsin or an alternative protease prior to LC-MS/MS analysis results in the loss of connectivity between modifications on different peptides. In this unit mass spectrometric methods to analyze combinatorial histone modifications on histone tails (Middle-down mass spectrometry) and on intact histones (Top-down mass spectrometry) are described.
Keywords: Histone modifications, top-down mass spectrometry, middle-down mass spectrometry, post-translational modifications
Introduction
This unit introduces mass spectrometry (MS) techniques for identifying co-occurring post-translational modifications (PTMs) on histone proteins. This unit is divided into two sections: Middle-down MS (Basic Protocol 1 and 2), and Top-down MS analysis of histones (Basic Protocol 3). It focuses on histones H3 and H4 because they are the most highly modified histones, however these techniques can also be applied to the other histone family members, or other highly modified proteins (Boyne et al., 2006; Sarg et al., 2005; Siuti et al., 2006; Young et al., 2010a). Top-down MS is a technique where intact, purified proteins are analyzed using a mass spectrometer, usually a high-resolution instrument such as an Orbitrap or an FTICR mass spectrometer. Modified forms of a protein are identified by mass shifts in the full MS spectrum of intact protein masses, and by electron transfer dissociation (ETD)- or electron capture dissociation (ECD)-based sequencing of the protein (McAlister et al., 2007). A more sensitive alternative to Top-down MS is Middle-down MS, where proteins are digested into a few, long peptides with a mass greater than ∼ 3000 Da. These long peptides retain information about the context of PTMs with respect to different histone sequence variants and with respect to other modifications on the same peptide. Different modified forms of the peptides can be resolved from each other prior to MS analysis using on-line weak cation exchange hydrophilic interaction chromatography (WCX-HILIC) (Basic Protocol 1) or by using an off-line HILIC fractionation technique (Alternate Protocol)(Garcia et al., 2007).
Middle-Down Mass Spectromtric Analysis of Histones
Basic Protocol 1
This protocol describes Middle-down mass spectrometry of histone H3. Middle-down MS requires proteins to be digested into large peptides, usually through the use of proteases that target less common amino acids. In the cases of histones H3 the proteases Glu-C is used because it cleaves H3 after its highly modified N-terminal tail. The advantage of Middle-down MS compared to common techniques, such as western blotting or Bottom-up MS analysis of small peptides, is that it gives more contextual information about which PTMs co-exist. Also described in this protocol are separations techniques that can be used to resolve modified histone peptides and increase the sensitivity of Middle-down MS (Young et al., 2009). If Middle-down MS is used in combination with MS-compatible labeling techniques such as stable isotope labeling of amino acids in cell culture (SILAC; UNIT 14.9) it can also be used for relative quantification of combinatorial histone modifications across conditions.
Materials
Dry, HPLC purified histone H3 variant (see SUPPORT PROTOCOL) At least 20 μg, dry HPLC purified H3. The three variants of histone H3 (H3.1, H3.2, H3.3) can be resolved by reversed phase chromatography (Support Protocol 1). H3.1 and H3.2 differ from H3.3 by a few amino acids in their N-terminal tails.
Glu-C (Roche, # 10791156001) re-suspend in Milli-Q water or equivalent, dry 50 μg aliquots completely in SpeedVac, and store in -20°C
100 mM Ammonium Acetate, pH 4.0, store at room temperature
Off-line reverse phase (RP) buffer A See Recipe
Off-line reverse phase (RP) buffer B See Recipe
On-line WCX-HILIC buffer A See Recipe
On-line WCX-HILIC buffer B See Recipe
Microcentrifuge
HPLC
Vydac C18, 250 mm, 2.1 mm, 5 μm, 300 Å (Grace #218TP52) or a similar reversed-phase column
HILIC capillary column, 10 mm, 50 μm i.d, 360 μm o.d., PolyCat A resin (300 Å, 3 μm). HILIC capillary columns can be purchased (Nest Group, #P15M05CT0503), or can be packed using a pressure bomb (See Support Protocol 2)
Sample vials for MS
Eksigent nanoLC-Ultra 2D with AS2 autosampler or equivalent nanoflow system. It is also possible to use a split-flow system.
LTQ-Orbitrap XL with ETD (Thermo Scientific)
Middle-down analysis of Histone H3: preparation
-
1
Re-suspend at least 20 μg of purified dried histone H3 in in 100 mM ammonium acetate (pH 4.0) to give a final H3 concentration of 1 μg/μL.
-
2
Re-suspend one aliquot of lyophilized Glu-C in 100 mM ammonium acetate (pH 4.0) to give a final concentration of 1 μg/μL.
-
3
Digest the H3 sample using Glu-C protease at a protein to enzyme mass ratio of 10:1 (1 μL re-suspended Glu-C for every 10 μL re-suspended H3) for 5 hours at room temperature at pH 4.0. Glu-C will cut at the C-terminus of Glutamate residues resulting in the cleavage of the 50 amino acid N-terminal tail from histone H3.
-
4
Quench the digest by freezing at -80°C or proceed immediately to the next step.
-
5
Dissolve the Glu-C digested H3 in RP-HPLC buffer A. Load onto on a Vydac 2.1 mm C18 column at a flow rate of 0.3 mL/min using RP-HPLC buffer A. Set the HPLC detector to collect data at 220 nm.
-
5
Resolve the digested fragments according to the gradient conditions given in Table 1.
-
6
Collect fractions according to time and then pool the fractions corresponding to the H3 (residues 1-50) fragment. See Figure 1A for a representative chromatogram indicating where the H3(1-50) tail elutes. Check that you have the correct fragment before proceeding by analyzing a small amount of the fraction using a MALDI-TOF mass spectrometer. The H3(1-50) tail may be split into several peaks as shown inFigure 1A according to acetylation state.
-
7
Dry the pooled fractions completely in a Speed Vac. Samples can be stored dry for several months at room temperature. Complete drying of the sample is important - the on-line reverse phase buffers contain TFA, which is highly reactive and will degrade your samples over time. TFA is volatile so most of it should be removed by drying the samples.
Table 1. RP-HPLC gradients.
| Gradient | Step | Duration | Percent B |
|---|---|---|---|
| Off-line RP-HPLC wash | Equilibrate column | 15 min | 2% |
| Gradient | 1 min | 2% | |
| 30 min | 95% | ||
| Wash | 5min | 95% | |
| Off-line RP-HPLC H3 fragment gradient | Equilibrate column | 15 min | 2% |
| Gradient | 1 min | 2% | |
| 95 min | 95% | ||
| Wash | 15 min | 95% | |
| Off-line RP-HPLC histone | Equilibrate column | 15 min | 2% |
| Gradient | 1 min | 2% | |
| 2 min | 30% | ||
| 100 min | 60% | ||
| 5 min | 95% | ||
| Wash | 5 min | 95% | |
| On-line RP-HPLC wash | Equilibrate column | 10 min | 2% |
| Gradient | 1 min | 2% | |
| 15 min | 95% | ||
| Wash | 5 min | 95% | |
| On-line RP-HPLC H4 Middle-down gradient | Equilibrate column | 10 min | 1% |
| Gradient | 1 min | 1% | |
| 60 min | 20% | ||
| Wash | 5 min | 95% |
Figure1.
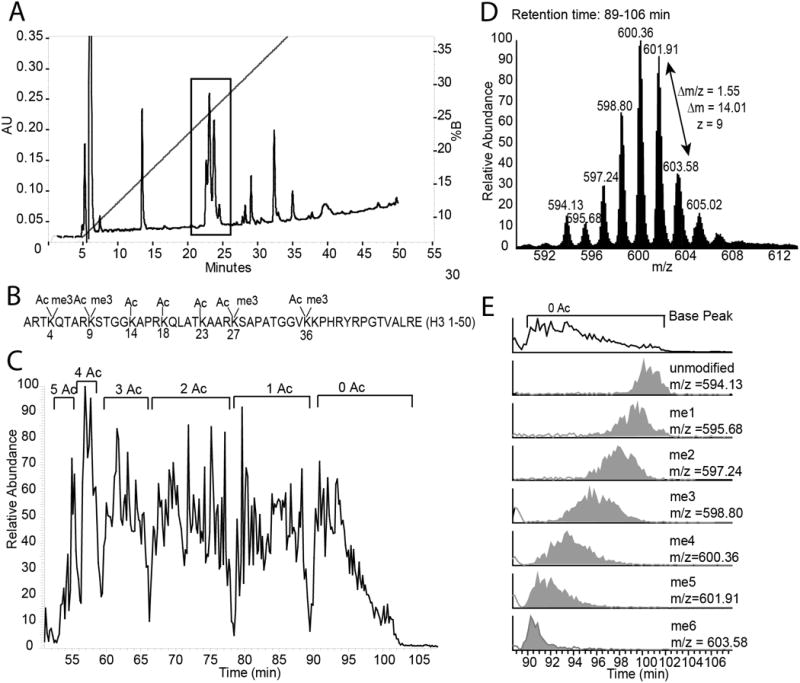
A. H3 GluC digest off-line RP-Chromatogram. The peaks corresponding to the 1-50 piece are indicated with a box. Depending on the quality of the chromatography the H3(1-50) fragment will be resolved into up to 5 peaks based on its acetylation state. B. The H3(1-50) sequence and common sites of modification. Some lysines can be modified with up to three methyl groups or one acetyl group. C. H3(1-50) on-line WCX-HILIC base peak chromatogram. The H3(1-50) fragment is resolved by the number of acetylation groups (Ac). D. MS1 averaged over the H3(1-50) 0Ac peak from the WCX-HILIC chromatogram. The peaks are separated by a mass of 14.01, corresponding to the mass of one methyl group. E. Selected ion chromatograms of unacetylated H3(1-50) with different numbers of methyl groups. The area under the curve for each selected ion chromatogram can be used to quantify H3(1-50) with different numbers of acetyl and methyl groups. Divide the area under the curve for each H3(1-50) form by the total signal for H3(1-50) to give the relative amount of each form.
Middle-down analysis of histone H3: chromatography and mass spectrometry
-
8
Prepare a 100 μm i.d. methyl-deactivated fused silica column with an integrated nano-spray ionization emitter then pack the column with 3-μm, 300-Å-pore size, PolyCAT A to a length of 10 cm using a pressure bomb (Link and LaBaer, 2009) (See Support Protocol 2). Alternatively, pre-packed HILIC nanoLC columns can be purchased from the Nest Group (Part # P15M05CT0503). It is important to use non-polar methyl-deactivated fused silica capillary if you are packing your own column. If un-coated silica capillary is used analytes can interact with the walls of the column causing peak broadening under HILIC conditions.
-
9
Attach the column to the nano-flow HPLC. Activate it using it using 20 column volumes of On-line WCX-HILIC buffer B at a flow rate of 250 nL/min. After activating the column, run three online WCX-HILIC wash gradients over the column (Table 2).
-
10
Re-suspend 1μg of purified H3(1-50) fragment in 20μL on-line HILIC buffer A, centrifuge for 5 minutes at maximum speed in a microcentrifuge, and pipet the solution carefully into a sample loading vial for the mass spectrometer without forming an air bubble at the bottom of the vial.
-
11
Bomb-load the sample onto the HILIC column by placing the sample vial in the pressure bomb without its cap and inserting the column into the top of the bomb until it is a few millimeters above the bottom of the vial. Apply pressure to the bomb until drops start forming at the top of the column. Adjust the pressure on the bomb until the sample forms droplets at the tip of the column at a rate of about 5μL/min. Load the entire volume of sample at this flow rate. Alternatively, use an autosampler to load the sample onto the column – if you are using an autosampler, then you should re-suspend the sample in a smaller volume (2-10 μL) of online HILIC buffer A.
-
12
Warm the ETD reagent ion source for 15 - 30 min before starting the MS analysis. Check the signal for the ETD reagent ion (m/z = 202); it should have a signal of at least 5×10⁵ (an optimally tuned instrument will have and ETD reagent ion signal of at least 1×10⁷ in profile mode). If the signal for the ETD reagent ion signal intensity is low, tune the ETD reagent ion optics.
-
13
Resolve the modified forms of histone H3(1-50) using a flow rate of 250 nL/min and the gradient shown in Table 2. Collect the data using either an LTQ-Iontrap (low resolution) mass spectrometer or an LTQ-Orbitrap (high resolution) mass spectrometer equipped with ETD ionization. The parameters to use for the MS method for an LTQ-Orbitrap XL are shown in Table 3. Run the mass spectrometer in data dependent mode. Collect one full MS1 scan across the full mass range (290-2000 m/z). Determine the most abundant charge state of the eluting ions and narrow the mass range accordingly for a second MS1 scan. Collect MS2 scans from the top 7 most abundant ions from the second (reduced range) MS1 scan. A sample on-line HILIC chromatogram for H3.2 is shown in Figure 1C. The +9 charge state of the H3(1-50) tail was the most abundant charge state in many of our runs, so we used a second MS1 scan with a mass range of 590-650 m/z (Figure 1D). For reproducible chromatography, equilibrate the column for the same amount of time between MS runs
-
15
The histone H3 data is very complex and involves many co-eluting modified forms making modified species difficult to identify and quantify. Our lab developed software in-house to identify and quantify Middle-down mass spectrometry results for histone H3 and H4 (DiMaggio et al., 2009). You can also use commercial and open source programs such as Z-Core (Thermo), Sequest (Thermo), pFind (http://pfind.net/)(Wang et al., 2007), or ProsightPTM (prosightptm2.northwestern.edu) (Zamdborg et al., 2007), and search your Middle-down data against a limited histone database to identify modified forms of the H3 tail in your data. If you do a database search you should use the elution profile of modified peptides as a guide (Figure 1C) and remember that peaks are resolved by acetylation state, then by methylation state and that more highly acetylated species will elute first from the HILIC column. Be careful when using software to identify H3 isoforms as co-elution of similar species leads to mixed MS2 mass spectra.
-
16
Determine the accurate mass for all of the identified H3 combinatorial modifications. Create extracted ion chromatograms for these masses in Xcalibur or another suitable program (Figure 1E). Determine the area under the curve for each mass. The relative abundance of each modified form is the area under the curve for that form divided by the sum of areas for all identified forms. Many H3 modification combinations are not completely resolved from each other (for example H3 forms that only differ from each other in the position of the acetyl group). In this case the relative amount of different species can be determined from unique c and z ions in the mixed MS2 spectra as described previously (DiMaggio et al., 2009; Phanstiel et al., 2008; Young et al., 2009).
Table 2. HILIC gradients.
| Gradient | Step | Duration | Percent B |
|---|---|---|---|
| On-line WCX-HILIC Activation | Activate | 30 min | 99% |
| On-line WCX-HILIC Wash | Wash | 1% | |
| Gradient | 1 min | 1% | |
| 200 min | 99% | ||
| Online WCX-HILIC H3(1-50) resolving gradient | Equilibrate | 60 min | 1% |
| Gradient | 1min | 1% | |
| 200 min | 99% | ||
| Off-line HILIC resolving gradient | Equilibrate | 15 min | 1% |
| Gradient | 1min | 1% | |
| 60 min | 99% | ||
| Wash | 5 min | 100% |
Table 3. MS settings.
| H3 Middle-Down | H4 Middle-down | Top Down | |
|---|---|---|---|
| Spray Voltage | 2.7 | 2.7 | 2.7 |
| Source Voltage | ? | ||
|
| |||
| FT-resolution | 3.00E+04 | 30000 | 100,000 |
| FT-Full MS-AGC | 7.00E+05 | 7.00E+05 | 7.00E+05 |
| FT-MSn-AGC | 1.00E+06 | 1.00E+06 | 2.00E+05 |
| IT-Full-AGC | 5.00E+04 | 5.00E+04 | |
| IT-MSN-AGC | 3.00E+04 | 3.00E+04 | |
| Maximum injection time (ms) | 1.00E+02 | 1.00E+02 | 100 |
| microscan number | 10 | ||
|
| |||
| Reagent ion AGC | 3.00E+06 | 3.00E+06 | 1.00E+06 |
| reaction time (ms) | 100 | 100 | 5-7 |
| isolation width (m/z) | 2 | 2 | 3 |
| Activation Q | 0.25 | 0.25 | 0.25 |
|
| |||
| mass range (m/z) | 290-1200 590-650 |
393.0-440.0 | start with 400 - 1500 |
| Reject Charge states | +1, +2, +3 | +1, +2, +3 | NA |
| number of data dependent scans | 7 | 7 | NA |
| Exclusion width (m/z) | 1 | 1 | NA |
| Exclusion time (s) | 60 | 60 | NA |
| Lock Mass | 371.101, 445.120 | 371.101, 445.121 | |
Basic Protocol 2
Histone H4 modification patterns are less complex than histone H3. The histone H4 N-terminal tail has 4 major acetylation sites and 1 major methylation site. Middle-down analysis of histone H4 involves digesting the protein with AspN resulting in a peptide containing the first 23 amino acids of the N-terminal tail. Modified forms of the histone H4 tail can be resolved using WCX-HILIC (Young et al., 2009) (see Basic protocol 1), however since the modification patterns are simpler, the H4 tail can also be resolved using reversed phase chromatography based on its acetylation state.
Materials
Dry purified histone H4 (see SUPPORT PROTOCOL 1) At least 20 μg of dry, HPLC purified H4
ASP-N (Roche, #11370529001) re-suspend in Milli-Q water or equivalent, store at 4°C for up to 5 days
100 mM Ammonium Bicarbonate, pH 8.0 store at 4°C
Glacial acetic acid (> 99.9%)
Trifluoro acetic acid (TFA)
HPLC-grade methanol
LC-MS-grade water
On-line reverse phase (RP) buffer A See Recipe
On-line reverse phase (RP) buffer B See Recipe
Empore C8 disk (3M, # 2214)
Microcentrifuge
Reversed-phase C18 capillary column, 150 mm, 75 μm i.d., 360 μm o.d., C18-AQ resin (200 Å, 3 μm). Reversed-phase capillary columns can be purchased (for example 3u 200A MAGIC C18AQ 0.1 X 150 from Michrom), or can be packed using a pressure bomb in house (See Support Protocol 2).
Sample vials for MS
LTQ-Orbitrap XL with ETD (Thermo Scientific)
Eksigent nanoLC-Ultra and Eksigent AS2 autosampler or equivalent nanoflow system. It is also possible to use a split-flow system.
Middle-down analysis of histone H4: Preparation
Re-suspend at least 20 μg of purified histone H4 in 100 mM ammonium bicarbonate (pH 8.0). Digest the protein for 6 hours at 37°C using a protein to enzyme mass ratio of 5 to 1 using Asp-N. Quench the reaction by freezing at -80°C or proceed immediately to the next step. This digest should cut before (at the N-termini of) aspartate residues, producing fragments including the 23-amino acid H4 tail (Figure 2A).
Dry the H4 digest to a volume of 10-20 μL in a Speed Vac and acidify using glacial acetic acid or TFA to a final pH of 3 - 4.
Desalt the H4(1-23) fragment using a stop-and go (Stage-tip) solid phase extraction tip as described previously (Rappsilber et al., 2003). Briefly, prepare a pipet tip containing 3×1mm diameter discs of solid phase C8 material, activate the C8 material using 100 μL methanol, wash the methanol from the tip using 2× 100μL 0.1M acetic acid in water, load the acidified H4 ASP-N digest onto the Stage-tip at a slow rate, wash the tip 1 × using 100 μL 0.1 M acetic acid in LC/MS-grade water, finally elute the desalted digest fragments into a new tube using 50% acetonitrile, 0.5% acetic acid, 49.5% LC/MS-grade water. Alternatively, the histone H4 1-23 fragment can be purified by reversed phase chromatography using the same conditions described in steps 3-6 of the H3 Middle-down section of Basic Protocol 1. The Stage-tip method for desalting the H4 1-23 peptide is fast with fewer losses than purifying the peptide using HPLC, however the Stage-tip sample will include all of the H4 peptides created during the ASP-N digest and will therefore be more complex.
Figure2.
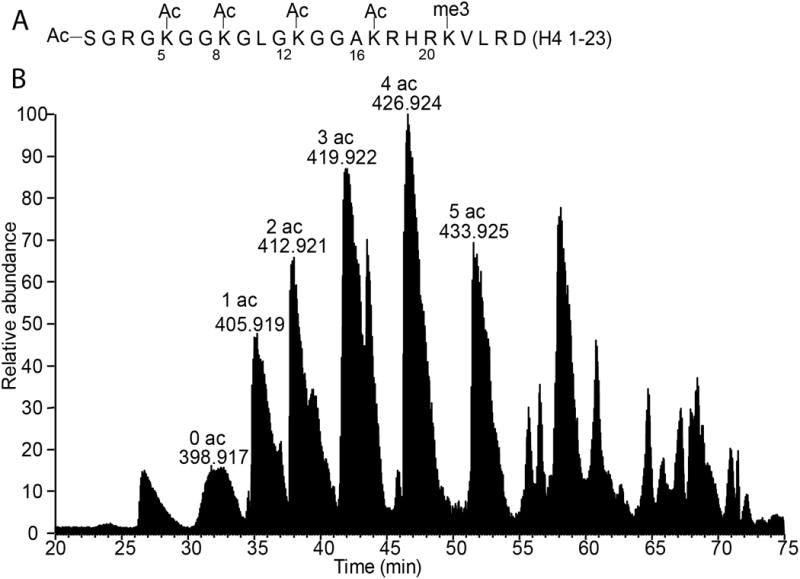
A. The H4(1-23) sequence and common sites of modification. Some lysines can be modified with up to three methyl groups or one acetyl group. B. Asp-N digested H4 on-line RP-HPLC total ion chromatogram. The H4(1-23) piece is resolved by acetylation state.
Middle-down analysis of histone H4: Mass Spectrometry
-
4
Pack a 75-μm-inner diameter, 360-μm-outer diameter fused silica column with an integrated nano-spray ionization emitter as described in Support protocol 2 with 3 μm, 200Å Magic C18AQ resin.(Goodlett et al., 2007) Alternatively purchase a pre-packed column, for example Michrom sells a capillary column that is also packed with 3 μm, 200Å Magic C18AQ resin (#3u 200A MAGIC C18AQ 0.1 × 150).
-
5
Warm up the ETD reagent ion source 15- 30 minutes before starting. Check the signal for the ETD reagent ion (m/z = 202); it should have a signal of at least 5×10⁵ in profile mode (an optimally tuned instrument will have and ETD reagent ion signal of at least 1×10⁷ in profile mode). If the signal for the ETD reagent ion is low then tune the ETD reagent ion optics.
-
6
Re-suspend 1 μg of the de-salted H4 digest in on-line RP-buffer A.
-
7
Either bomb-load the H4 sample onto the reverse-phase column using the method described in Basic Protocol 1 step 11, or use an auto sampler.
-
8
Elute the histone H4 fragments using the on-line RP-HPLC H4 fragment gradient conditions detailed in Table 1 at a flow rate of 250 nL/min. As the sample elutes, collect data using an LTQ-Oribtrap mass spectrometer with ETD capabilities. The suggested MS parameters for middle-down H4 analysis are presented in Table 1. Collect one MS1 scan and 7 data dependent MS2 scans. The H4 fragments will be resolved based on their acetylation state as shown in Figure 2B.
-
9
The results from H4 middle-down can be analyzed using the programs listed in the H3 middle down section step 13, however if you use these programs we suggest that you check the results by hand and use the known relative elution pattern for modified H4 forms as a guide.
-
10
Use label-free quantification techniques described in Basic Protocol 1 step 16 to quantify the relative abundances of H4 combinatorial modifications. Determine the accurate mass for all of the identified H4 combinatorial modifications. Create extracted ion chromatograms for these masses in Xcalibur or another suitable program. Determine the area under the curve for each mass. The relative abundance of each modified form is the area under the curve for that form divided by the sum of areas for all identified forms. Many isobaric H4 acetylation states are not completely resolved from each other (for example H4 forms that only differ from each other in the position of the acetyl group). In this case the relative amount of different acetylated species can be determined from unique c and z ions the MS2 spectra as described previously (DiMaggio et al., 2009; Phanstiel et al., 2008; Young et al., 2010a).
Top-Down Ms Analysis of Histones
Basic Protocol 3
Top-down MS is the analysis of intact proteins. Modifications are identified by shifts in the mass of the intact proteins as well as by sequencing fragments produced by ETD or HCD MS/MS spectra. Top-down MS can be used to study all histone family members, although histone H4 is the easiest to analyze because it has only one isoform and has less complex modification patterns. The protocol below describes techniques appropriate for Orbitrap technology. FTICR instrumentation can also be used for Top-down characterization. For more information on the application of FTICR to identify combinatorial modifications on histones using Top-down MS refer to manuscripts from the Kelleher group (Pesavento et al., 2008; Thomas et al., 2006).
Materials
Purified histones (see SUPPORT PROTOCOL 1)
Equine myoglobin (Sigma, # M0630)
50% LC-MS grade Acetonitrile, 50% LC-MS grade water, 0.1 M acetic acid
Magic C18 AQ resin, 5 μm, 100 Å (Michrom Bioresources INC, #PM5/61100/00)
Infusion column, 20 μm id, 365 μm od Follow instructions to create an empty column with integrated emitter from Support Protocol 2 or purchase a commercial emitter (New Objective, # FS360-20-10-N5105CT)
Syringe (Hamilton, 25 μL, #80275)
Micro-centrifuge
LTQ-Orbitrap XL with ETD
Top-down MS analysis of intact histones using ETD
Prepare an infusion column using a 50-μm-inner diameter, 360-μm-outer diameter fused silica capillary column with an integrated nano-spray ionization emitter Support Protocol 2. Pack 1 mm of Magic C18AQ resin into the tip of the emitter using a pressure bomb, this will form a “filter” at the tip of the column (Support Protocol 2 for packing columns).
Using 20-μm-inner diameter, 360-μm-outer diameter fused silica capillary tubing, connect the nanospray emitter to the nano-ESI source and the infusion syringe. Wash the entire system with 50% acetonitrile and 50% water solution.
Tune the LTQ ion optics on a representative high-mass ion, for example myoglobin or an abundant histone sample. To do this re-suspend 30μg equine myoglobin in 30 μL 50% Acetonitrile, 50% water and 0.1M acetic acid then centrifuge in a microcentrifuge at 13,000 RPM for 5 minutes to clarify. Keep the supernatant and be careful not to pipet any solids at the bottom of the tube. Infuse the myoglobin at a rate of 1μL/min using a 25μL Hamilton syringe. Wait for the signal to stabilize so that the signal relative standard deviation (RSD) is less than 15%, then tune on the 848.64 mass. This step is important because most standard tune files are set for low molecular weight peptides, and will therefore have lower transmission efficiencies for higher molecular weight proteins. We use myoglobin to tune our instrument because it has a mass similar to the histone proteins, it is cheap, and we find that it is easy to get a stable myoglobin signal. Alternatively, if you have a large amount of histone, you can also tune the instrument using one of the histone family members. If you are using an LTQ Orbitrap XL, turning off the HCD gas, turning off the “FT zero offset”, and setting the detection delay to “low” in the “Diagnostics/toggle” menu before tuning will improve the intact protein signal.
Warm the ETD reagent ion source 15- 30 minutes before collecting data. Check the signal for the ETD reagent ion (m/z = 202); it should have a signal of at least 5×10⁵ in profile mode (an optimally tuned instrument will have and ETD reagent ion signal of at least 1×10⁷ in profile mode). If the signal for the ETD reagent ion is low then tune the ETD reagent ion optics.
Use the “Define Scan” dialog box in the Tune program to enter the mass spectrometer settings listed in Table 1. These are settings that gave us a good signal on an LTQ Orbitrap XL If you have a different instrument you should refer to appropriate literature to determine the correct AGC settings, and you may need to adjust the ETD reaction times depending on the histone you are analyzing.
**
-
5
Re-suspend 50 μg of purified histone H4 in 50 μL of 50% Acetonitrile, 50% water and 0.1M acetic acid then centrifuge in a microcentrifuge at 13,000 RPM for 5 minutes to clarify. Keep the supernatant and be careful not to pipet any solids at the bottom of the tube. Sample processing can lead to oxidation of methionines, shifting the mass of some histones and diluting the signal into multiple peaks. A mild oxidation treatment to intentionally oxidize histones prior to analysis can improve histone signals (Pesavento et al, 2007).
-
6
Infuse the sample using a 25μL Hamilton syringe at a rate of 0.7 μL/min and start collecting data in profile mode. When infusing the sample be sure to use a dedicated syringe and tubing for proteins, and clean by flushing everything with 50% Acetonitrile, 50% water and 0.1M acetic acid before running a new sample.
-
7
Choose a histone peak at a charge state that has a high intensity, but a low enough charge state that the modified forms of histone are resolved from each other by at least 1-2 m/z for MS2 analysis. Reduce the MS1 mass range to encompass only the histone peaks at this charge state (see Figure 3A for an example MS1 spectrum). Collect the MS1 spectrum for 1 minute using a microscan count of 10. Average over the entire time window when analyzing your data to reduce noise. A good H4 mass spectrum should resembleFigure 3A. The charge state of the protein is 1 over the difference between two adjacent isotopic peaks in a protein. You can use lower or higher microscan counts and collection times depending on the quality of the data.
-
8
In the Define Scan window: choose ETD as the activation type, 2 m/z as the isolation width, turn on supplemental activation, and select 5 ms as the reaction time to start with. Collect MS2 spectra for 5 minutes using a microscan count of 10. A high quality MS2 spectrum should resemble the one in Figure 3B with masses across the entire mass range. You will need to change the isolation width and ETD reaction time depending on the protein. Choose the settings that allow you to isolate the entirety of the peak you are interested in without other peaks, and that give you the most peaks in the ETD MS/MS spectrum. Sometimes different ETD reaction times will give you different sets of fragment ions, so it is worth collecting several spectra at different reaction times. Average the data over the entire time window when you are analyzing the MS/MS spectrum because this will reduce the noise level.
-
9
Repeat step 8 with the remaining peaks in the MS1 spectrum collected in step 7.
-
10
If you can determine the identity of the modified histone form based on the MS1 mass, then there are a number of on-line programs you can use to generate a c and z ion list given a protein's sequence. You can use these masses as a guide to identify the fragment ions in your MS/MS spectrum. MS Product (http://prospector.ucsf.edu/prospector/cgi-bin/msform.cgi?form=msproduct) is a useful website for predicting c and z ions given a protein sequence. Programs for analyzing Top-down data are currently not as well developed as they are for Bottom-up data. If you have the Proteome discoverer program then you can use the Prosight-PC program to identify MS2 ions. There is also a free version of this program on-line at prosightptm2.northwestern.edu (D. LeDuc and L. Kelleher, 2002).
Figure3.
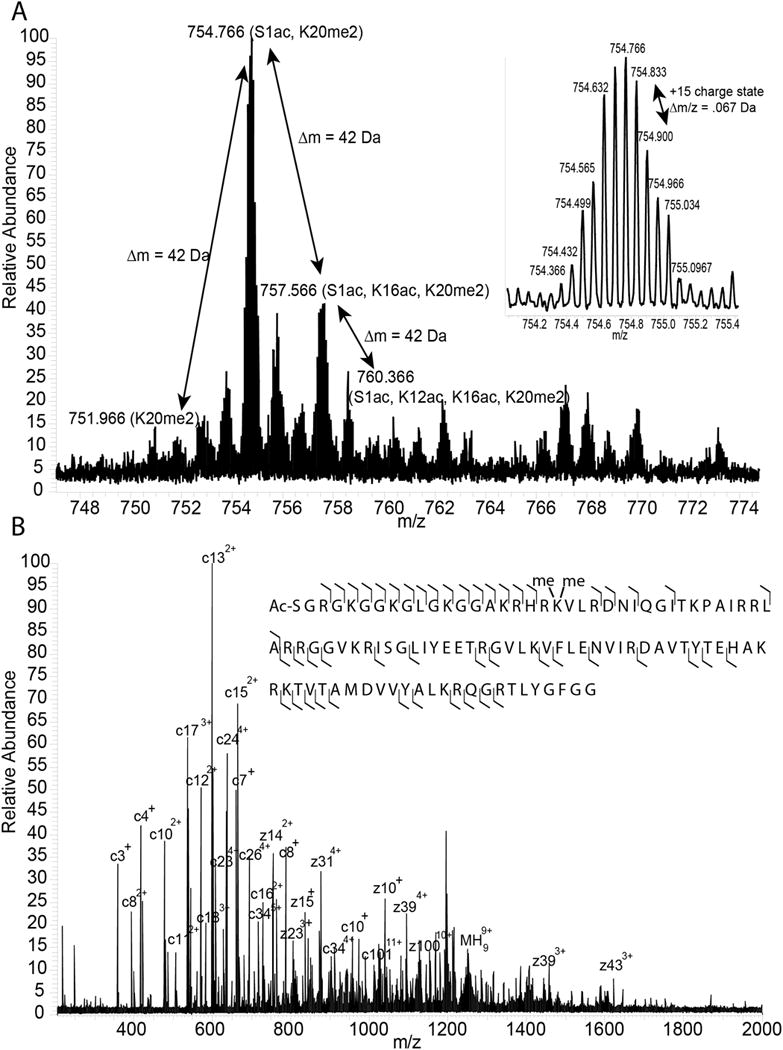
A. MS1 of the +15 charge state of intact H4. The main peaks in the MS1 spectrum correspond to abundant modified forms of H4. The delta mass of peaks in the MS1 spectrum gives clues about the identity of each peak. For example, peaks separated by one acetyl group are highlighted in this figure. The mass shift for one acetyl group is 42 Da for a plus one charge state, corresponding to 3.8 m/z for the +15 charge state shown in this figure. The insert is a magnification of the H4 N-terminal acetyl, K20 dimethyl form. The difference in m/z between isotope peaks can be used to determine the charge of the ion. In this case the Δm/z is 0.067 Da, so the charge state is 1/0.067, or +15. B. ETD MS2 of the H4 N-terminal acetyl, K20 dimethyl form. The c and z ions cover most of the H4 sequence.
Alternate Protocol
Off-Line Hilic Separation of Intact Histones
For each histone family member, there are many modified forms and in many cases sequence variants that differ from each other by very small mass differences. Some of these sequence isoforms and modified histone forms are isobaric, making mass spectrometric analysis difficult. Off-line HILIC can be used to reduce the sample complexity before MS analysis by separating histones based on their charge and hydrophobicity.
This method can also be used with Glu-C digested histone H3 instead of the on-line WCX-HILIC separation technique described in Basic Protocol 1. Any off-line HILIC fractions will need to be desalted thoroughly before they are introduced to the mass spectrometer.
Materials
Histone sample
Off-line HILIC buffer A See Recipe
Off-line HILIC buffer B See Recipe
0.1M Acetic Acid in HPLC-grade water
0.1M Acetic Acid, 75% HPLC-grade Acetonitrile, 25% HPLC-grade water
Trichloroacetic acid (TCA) (store at 4°C) See Recipe
0.1 % (v/v) HCl in Acetone (store at -20°C)
Cold acetone (store at -20°C)
HPLC
PolyCAT A column (4.6 mm, 150 mm; 3μm, 1000 Å, PolyLC, Columbia, MD) Note: Follow manufacturer's guidelines for care and storage of HILIC columns to ensure that they function properly.
Empore C8 (3M, # 2214)
Compressed air canister
SpeedVac
Hilic for Intact Histones
Run a linear gradient from 1% to 95% off-line HILIC buffer B over 30 minutes to wash and activate the polyCAT A column, then equilibrate the column at 1 %B for 15 minutes prior to run. Follow manufacturer's instructions for activating and storing HILIC columns to ensure a longer lifetime for the column.
Re-suspend 150 μg of dry HPLC-purified histone or purified H3(1-50) peptide in off-line HILIC buffer A.
Clarify the sample by centrifuging at 13,000xg in a micro centrifuge for 10 minutes.
Load the sample onto the HPLC and apply the off-line HILIC gradient given in Table 2. Collect 0.5 minute fractions in collection tubes using an autosampler. Set the HPLC detector to collect data at 220 nm. Make sure to re-equilibrate the column at 1% B for the same amount of time before each run.
Pool fractions corresponding to peaks in the chromatogram.
Use a vacuum concentrator to dry the HILIC fractions to 50 μL or less.
Add 100% ice-cold TCA to the fractions on ice to give a final concentration of 30% TCA. Then precipitate for 2 hours (or up to overnight) on ice.
Centrifuge the fractions for 15 minutes at 13,000xg at 4°C, then aspirate off the supernatant.
Wash the fractions 2× with ice-cold 30% TCA without re-suspending the sample, centrifuging for 15 minutes at 13,000xg at 4°C, and aspirating off each wash.
Wash the sample twice with ice-cold 0.1% HCl in -20°C acetone, centrifuging for 15 minutes at 13,000xg at 4°C, and aspirating off each wash.
Finally wash the sample twice with -20°C acetone, centrifuging for 15 minutes at 13,000xg at 4°C, and aspirating after each wash.
Air-dry the sample.
De-salt the sample using a Stage-Tip. Prepare a pipet tip containing 3 × 0.5mm disks solid phase C8 material (use 1 disk of C8 material per 2-4 μg of sample)(Rappsilber et al., 2003). Activate the C8 material using 100 μL methanol, pushing the liquid through the tip using a compressed air canister or by centrifuging at 400 rpm in a tabletop centrifuge. Wash the methanol from the tip using 2× 100 μL 0.1M acetic acid in water. Re-suspend the sample in 50 μL 0.1M acetic acid in water. Load the re-suspended HILIC fraction onto the tip at a rate of approximately 5 μL/s. Wash the tip 1× using 100μL 0.1M acetic acid in water, finally elute the desalted fraction proteins into a new tube using 75% acetonitrile, 0.1M acetic acid at a rate of approximately 5 μL/s. Dry the sample completely in a speedvac. This sample can be used for Top-down MS analysis. At this point the samples can be stored dry at room temperature for up to a year dry.
Extraction and Purification of Mammalian Histones from Cell Lines
Support Protocol 1
Middle-down and Top-down MS require large amounts of pure histones. There are several methods for extracting and purifying histones (Shechter et al., 2007). Below is a straightforward method that relies on nuclear isolation using nonionic detergents, followed by acid extraction and TCA precipitation of histones from the nuclei, and finally reversed phase separation of the histone family members (H3, H4, H2A, H2B and H1).
Materials
This method is applicable to mammalian cells. The number of cells required will depend on the cell type and the application, but 50×106 cells is a good starting point. Make sure that your histone extraction technique gives you at least 200 μg of sample that you will have enough of the individual histone family members for Middle-down or Top-down processing. The more sample, the easier it will be to optimize your method.
Phosphate Buffered Saline (PBS)
Nuclear isolation buffer See Recipe
10% (v/v) NP-40 alternative nonionic detergent
5M Sodium Butyrate (store at -20°C)
1M DTT stock (prepare fresh)
Protease and phosphatase inhibitor cocktail
0.4 N Sulfuric Acid
100% Trichloroacetic acid (store at 4°C) See Recipe
0.1 % (v/v) HCl in Acetone (store at -20°C)
Cold acetone (store at -20°C)
Off-line RP-Buffer A
Off-line RP-Buffer B
HPLC with UV-detector
Vydac 4.6 mm, 5μm, 300 Å pore size column (Grace, Vydac, #218TP54) or a similar reversed-phase column
Microcentrifuge
SpeedVac
Acid Extraction of histones from mammalian cell lines
Prepare nuclear isolation buffer with 0.3% (v/v) NP-40 (NIB plus NP-40) as well as HDAC, protease and phosphatase inhibitors. Keep the buffer on ice or at 4°C, use immediately after adding inhibitors.
Collect cells. The number of cells needed for these experiments varies by cell type, for example 50 × 106 cells is enough for HeLa cells for the following procedure, however the number of cells you will need depend on the cell type. Determine the number of cells that will give you at least 200 μg of acid extracted histone.
Wash the cells 3× with PBS.
If you are using cells from suspension add 10× the cell pellet volume of NIB plus NP-40. If you are using adherent cells grown on plates, add enough NIB plus 0.3% NP-40 to cover the surface of the plate, then scrape the cells from the plate surface and transfer them to a conical tube. Let the cells sit for 5 minutes on ice in NIB plus 0.3% NP-40.
Centrifuge the cells for 5 minutes at 600xg in a tabletop centrifuge at 4°C. The remaining pellet should contain the cell nuclei and should appear whiter than the original pellet of intact cells. If the cell pellet is still yellowish in appearance, check to make sure that the cells have lysed using trypan blue staining. Nuclei should be less refractive than intact cells and will stain blue. If they are not lysed, re-suspend the cells and incubate in a larger volume of NP-40 until they are lysed.
Aspirate off the NIB and cytoplasmic proteins (the supernatant), leaving the nuclear pellet.
To wash the isolated nuclei, gently re-suspend the pellet in NIB without NP-40. Then centrifuge for 5 minutes at 600xg in a tabletop centrifuge at 4°C.
Repeat steps 6 and 7. The nuclear pellet can be stored at -80°C for several months.
Aspirate the liquid from the top of the nuclear pellet then re-suspend the pellet in 5× the nuclear pellet volume of 0.4 N H2SO4. This step results in the extraction of acid-soluble proteins, primarily core histones.
Rotate the cells at 4°C for one hour. It is possible carry out the acid extraction for longer times in order to extract more histones, however this tends to result in dirtier preps containing more non-histone proteins and some acid soluble lipids.
Centrifuge at 4°C at the highest possible speed for 5 minutes to clarify the acid-extract in a microcentrifuge (if your volumes are small), or in the tabletop centrifuge if the volumes are larger.
Move the clarified acid extract to a clean tube.
Add 100% cold TCA drop by drop to the acid extract at 4°C, while vortexing at 800 rpm to give a 30% v/v final concentration. Leave the sample to precipitate for 1 hour or up to overnight. The acid-extracted proteins should start to precipitate as the TCA is added, making the solution look cloudy.
Centrifuge the sample at maximum speed for 15 minutes at 4°C then aspirate off the supernatant. The precipitated proteins should form a white film on the sides and bottom of the sample tube.
Without re-suspending the sample, cover the sample with ice-cold 0.1% HCl in acetone. Then centrifuge for 5 minutes at maximum speed at 4°C and aspirate to remove the acetone.
Repeat step 15.
Wash the sample with 100% ice cold acetone then centrifuge for 5 minutes at maximum speed at 4°C.
Aspirate off the acetone and leave the samples to air-dry. The samples should contain mostly histones. The samples can be stored dry for months to a year at room temperature.
Reversed phase separation of histone family members
-
19
Run a 30-minute “blank” gradient (See Table 1 for complete gradient conditions) to activate the reversed phase column. Then allow the column to equilibrate at 1% RP-HPLC buffer B for 15 minutes.
-
20
Re-suspend at least 200 μg of acid-extracted histones in RP-HPLC Buffer A (you can load up to 1mg on a 4.6 mm column). Do not store samples in HPLC buffers because the TFA will degrade your samples.
-
21
Spin the histones in a microcentrifuge at 13,000 rpm for 10 minutes to remove any undissolved material from the solution. Pipet the supernatant into a clean tube.
-
22
Load the clarified histone solution onto the 4.6 mm reversed phase HPLC for 5 minutes in 1% RP-HPLC buffer B.
-
23
Apply the Off-line HPLC histone-resolving gradient (Table 1) using a flow rate of 0.8 mL/min to separate histone family members. Follow the protein's elution using a UV detector set at 220 nm.
-
24
The histones should elute in approximate order of hydrophobicity. Collect histone fractions as they elute, or based on time. Figure 4 shows the relative elution profile for histones on a 4.6 mm Vydac column. Note: If other reversed phase columns are used the relative histone elution order might change. You can check the elution profile by running 1-5 μg of each fraction on a 1D SDS gel (Unit 10.1).
-
25
Combine the appropriate histone fractions for analysis and immediately dry them using a centrifugal vacuum concentrator. This step is very important. TFA is a volatile acid and will be removed completely by drying your samples. Leaving your samples in buffers containing TFA will be detrimental to the protein's integrity.
Figure4.
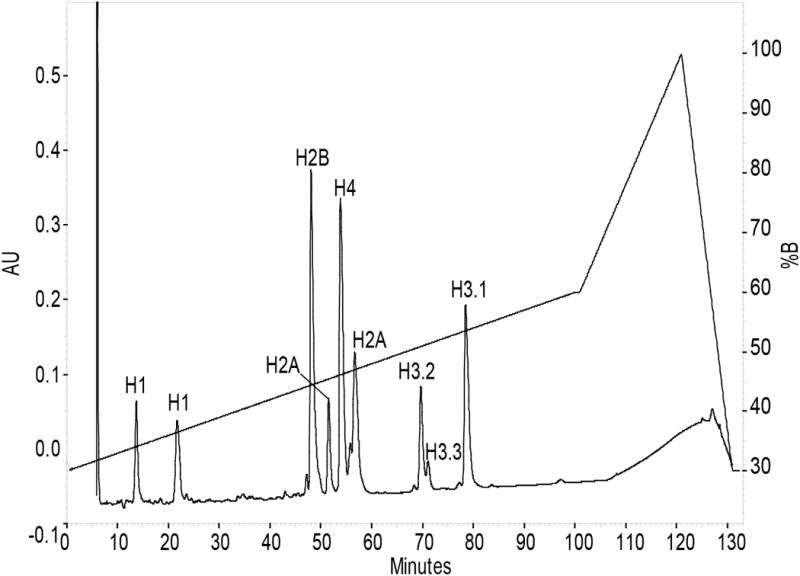
Off-line RP chromatograph of acid extracted histones from Jurkat cells. Also plotted is the Off-line RP gradient.
Making Capillary Columns with Integrated Emitters
Support Protocol 2
Some of the MS techniques described in this section require on-line chromatographic resolution of histone peptides by either nano-flow WCX-HILIC (Basic Protocol 1) or reversed phase (Basic Protocol 2) chromatography. HILIC, reversed phase, and infusion capillary columns with integrated emitters for nano-flow chromatography can be made cheaply using fused silica capillary tubing and the desired stationary phase resin as described below (Goodlett et al., 2007; Schieltz et al., 2006).
Materials
50% Methanol (reagent grade), 50% Milli-Q water
HPLC-grade Acetonitrile
HPLC-grade Isopropanol
0.1M Acetic Acid in HPLC-grade water
Angiotensin (Sigma, # A9650)
Fused silica capillary, 75 μm i.d., 360 μm o.d. (Polymicro Inc., #BCT0303)
Methyl-deactivated fused silica capillary, 100 μm i.d., 369 μm (Supelco, #25740-u)
Ceramic scoring wafer (Restek, # 23015)
Lighter
Kimwipe
Laser Tip puller (Sutter Instrument Co, Model P-2000)
Glass vials
Flea stir bar
Stir plate
Pressure bomb (Nanobaume, # SP-400) The pressure bomb should be attached to a gas tank using tubing and fittings capable of withstanding 9000 psig, including a three-way valve with a bottom vent to regulate the flow of gas to the bomb.
Helium pressurized gas tank Any pressurized gas should work
PolyCat A resin, 3 μm, 300 Å (PolyLC, #BMCT0303)
Magic C18 AQ resin, 5 μm, 100 Å (Michrom Bioresources INC, # PM3/61100/00)
1.5 mL Eppindorf tubes
Pulling emitter tips
Cut approximately 40 cm of fused silica tubing using a ceramic scoring wafer. The inner diameter of the fused silica tubing, as well as the type depends on the application. Use coated, non-polar tubing for WCX-HILIC applications (Basic Protocol 1). Make sure that the cut edge of the silica tubing is even and that you don't crush the silica when using the scoring wafer. Uneven edges and crushed tubing ends can cause clogging and dead volume issues.
Choose settings on the laser tip puller that will create a 5 μm diameter tip using the manufacturer's manual as a guide. The settings are just a guideline; you will need to optimize the heat, velocity, delay, and pull settings on your laser puller.
Using a lighter burn the polyimide polymer coating just until it turns black over about 2 cm in the middle of the 40 cm piece of tubing. Wet a Kimwipe with 50% methanol. Wipe off all of the burnt coating so that the silica is exposed. Make sure that you don't overheat the silica tubing – this can cause it to weaken and bend. Also make sure that you remove all of the blackened silica coating so that none is left to obstruct the path of the laser inside of the puller.
Place the piece of tubing inside of the tip puller with the exposed silica centered in the path of the laser. Attach the puller's clamps and start the puller method.
Examine the tip under a microscope. The sides of the tip should be even, at around … degrees. The tip should also not be too elongated. Columns with integrated emitters can be packed to make analytical columns or can be used empty or packed with 2-3 mm of C18 material as infusion columns.
Packing the column using a pressure bomb
-
6
Clean a glass vial and a stir bar using 50% methanol. Add 700 μL isopropanol, 700 μL acetonitrile and the stir bar to the vial. Start the stir bar stirring at medium speed. Add 0.5 - 1 mg of Magic C18 AQ resin to the vial.
-
7
Wait until the C18 resin is mixed evenly into the 50% isopropanol/acetonitrile solvent – there should be no clumps of C18 resin. Place the vial inside of the chamber of the pressure bomb.
-
8
Thread the bottom of a column with an integrated emitter tip a few centimeters through the Teflon ferrule on the top of the pressure bomb.
-
9
Place the top of the pressure bomb onto the bottom chamber so that the bottom of the column is centered over the C18 resin vial. Push the column into the vial until it touches the bottom of the vial, and then pull it up so that it is about 5 mm from the bottom of the vial. Tighten the nut around the ferrule until it is finger-tight, and then use a wrench to tighten it a quarter turn more so that the column is held firmly in place. Be careful not to over-tighten as this can deform the ferrule.
-
10
Tighten the screws on the pressure bomb, alternating sides, until the top of the bomb is firmly pressed against the chamber of the bomb.
-
11
Turn on the gas tank, and regulate the pressure so that it is at 1000 psi.
-
12
Open the valve so that gas flows into the bomb. Immediately after opening the bomb, gently tap the tip of the column using the ceramic scoring wafer. This should open the tip of the column so that the resin beads are trapped inside the column, but the solvent can flow out of the tip easily.
-
13
Allow the column to pack until it has reached the desired length. Longer columns have a higher resolution, but also have a higher backpressure. Nano-HPLC systems without a column heater can handle the backpressure from a column packed up to around 15 cm.
-
14
Turn off the gas tank pressure, and then slowly release the pressure going to the column by slowly closing the valve. If the pressure is released too quickly the resin will flow back out of the bottom of the column.
-
15
Attach the column to the mass spectrometer. Equilibrate for 15 minutes by running 95% buffer A over the column.
-
16
Load 5uL of 2ng/μL angiotensin in Buffer A onto the column at a flow rate of 500 nL/min. Run gradient 1 over the column (See Table 1). This step is required to block non-specific binding sites on silica columns. We use angiotensin because it is cheap, but any other digested protein sample could be used. This step may need to be repeated a few times to completely condition the column.
-
17
Run a sample on the column that you run frequently to test the chromatography. Peaks should be Gaussian, sharp, and evenly distributed across the gradient.
Reagents and Solutions
Off-line Reverse Phase Buffer A
5% HPLC-grade Acetonitrile
95% HPLC-grade water
0.2% Trifluoro acetic acid (TFA)
Add all except for a few milliliters of acetonitrile to the water and TFA. Degas for 5 minutes in a sonicating water bath. Add acetonitrile to give the final volume of buffer. Filter the buffer using a pharmaceutical-grade 0.2-μm membrane filter to remove any particulates. Store for 2-3 months at room temperature.
Off-line Reverse Phase Buffer B
95% HPLC-grade Acetonitrile
5% HPLC-grade water
0.188% Trifluoro acetic acid (TFA)
Add all except for a few milliliters of acetonitrile to the water and TFA. Degas for 5 minutes in a sonicating water bath. Add acetonitrile to give the final volume of buffer. Filter the buffer using a pharmaceutical-grade 0.2-μm membrane filter to remove any particulates. Store for up to a month at room temperature (after longer periods of time the acetonitrile will evaporate and will no longer be at the correct concentration).
On-line WCX-HILIC buffer A (pH 6.0)
75% LC-MS grade methanol
25% LC-MS grade water
5 mM propionic acid (>99.5%, Fluka Puriss, Sigma)
Add the propionic acid to the water then add 8μL/L buffer of ammonium hydroxide (>99.99%) to bring the pH to 6.00. Add methanol to the solution until it is a couple of milliliters below the final volume mark and mix. Next, de-gas the solvent by placing it in a sonicating bath for 5 minutes. After degassing, add methanol to give the final volume of buffer. Finally filter the buffer using a pharmaceutical-grade 0.2-μm membrane filter to remove any particulates. Store for up to a month at room temperature (after longer periods of time the methanol will evaporate and will no longer be at the correct concentration).
On-line WCX-HILIC buffer B (pH 2.32)
4.5% LC-MS grade methanol
95% LC-MS grade water
0.5% Formic Acid (LC/MS grade)
Add the formic acid to the water. Add methanol to the solution until it is a couple of milliliters below the final volume mark and mix. Next, degas the solvent by placing it in a sonicating bath for 5 minutes. After degassing, add methanol to give the final volume of buffer. Finally filter the buffer using a pharmaceutical-grade 0.2-μm membrane filter to remove any particulates. Store the buffer in an amber bottle to protect from light. Formic acid is not stable for long periods of time. Store for a month at room temperature.
On-line Reverse Phase Buffer A
5% LC-MS grade acetonitrile
95% LC-MS grade water
0.1M acetic acid (>99.9%)
Add all except for a few milliliters of acetonitrile to the water and acetic acid. Degas for 5 minutes in a sonicating water bath. Add acetonitrile to give the final volume of buffer. Filter the buffer using a pharmaceutical-grade 0.2-μm membrane filter to remove any particulates. Store for 2-3 months at room temperature.
Off-line Reverse Phase Buffer B
95% LC-MS grade acetonitrile
5% LC-MS grade water
0.1M acetic acid (>99.5%, Fluka Puriss, Sigma)
Add all except for a few milliliters of acetonitrile to the water and TFA. Degas for 5 minutes in a sonicating water bath. Add acetonitrile to give the final volume of buffer. Filter the buffer using a pharmaceutical-grade 0.2-μm membrane filter to remove any particulates. Store the buffer in an amber bottle to protect from light. Store for up to a month at room temperature (after longer periods of time the acetonitrile will evaporate and will no longer be at the correct concentration).
Off-line HILIC buffer A
75% HPLC-grade acetonitrile
25% HPLC-grade water
20 mM triethylamine (TEA)
pH 4.0 with H3PO4
Dissolve the triethylamine in water, pH to 4.0 with phosphoric acid then bring up to the final volume of water. Add all except for a few milliliters of acetonitrile to the pHed water and triethylamine solution. Add acetonitrile to give the final volume of buffer. Filter the buffer using a pharmaceutical-grade 0.2-μm membrane filter to remove any particulates. Store for up to a month at room temperature (after longer periods of time the acetonitrile will evaporate and will no longer be at the correct concentration).
Off-line HILIC buffer B
60% HPLC-grade acetonitrile
40% HPLC-grade water
20 mM triethylamine (TEA)
500 mM NaClO4
pH 4.0 with H3PO4
Dissolve the triethylamine and sodium perchlorate in water, pH to 4.0 with phosphoric acid, and then bring up to the final volume of water. Add all except for a few milliliters of acetonitrile to the pHed water and triethylamine solution. Add acetonitrile to give the final volume of buffer. Filter the buffer using a pharmaceutical-grade 0.2-μm membrane filter to remove any particulates. Store for up to a month at room temperature (after longer periods of time the acetonitrile will evaporate and will no longer be at the correct concentration).
Nuclear isolation buffer
15mM Tris-HCL (pH 7.5)
60mM KCl
15mM NaCl
5mM MgCl2
1mM CaCl2
250mM Sucrose
Store the nuclear isolation buffer in aliquots in the -20°C freezer for up to a year.
100% Trichloroacetic Acid Solution
500 g TCA
227 ml ddH2O
Mix TCA with water in the above proportions to give a 100% (wt/vol) solution. Store at 4°C for 6 months to a year. TCA is extremely hygroscopic; so do not try to weigh TCA to make solutions. Use the entire container to make fresh TCA solution to ensure that the mass is correct. Over time the solution also absorbs water and you may need to add a larger volume of TCA to precipitate your sample.
Commentary
Background Information
Histones and 147 base pairs of DNA are the basic building blocks of nucleosomes, which are in turn the most basic units of chromatin. Chromatin is responsible for packaging DNA into the nucleus of eukaryotic cells. Dynamic post-translational modifications (PTMs) on histones, as well as replacement of canonical histones with histone variants, play important roles in regulating many chromatin-related processes. The most common histone PTMs include: lysine acetylation and methylation (by far the most abundant), N-terminal acetylation, serine and threonine phosphorylation, lysine ubiquitination and arginine methylation (Sidoli et al., 2012; Young et al., 2010b). Most sequence variation and PTMs occur on the C and N-terminal tails of histones, which protrude from the nucleosome core, making them accessible to be bound by effector proteins important for a wide range of cellular activities including gene expression, DNA damage repair and cell cycle control.
Individual histone PTMs are correlated with specific activities, for example histone acetylation and H3 lysine 4 trimethylation (H3K4me3) are associated with active gene expression, H3K27me3 with silenced genes, and H3S10 phosphorylation with cell mitosis. However, histones, particularly histones H3 and H4, are usually decorated with many PTMs. Studies from our lab and from other labs identified over 200 different PTM combinations on histone H3 and over 70 modification combinations on histone H4 (Pesavento et al., 2008; Young et al., 2009). Some of these PTM combinations are known to bind proteins with multiple modification binding motifs, to bind protein complexes with different histone binding subunits, to block protein binding, or to guide further modification of histones or histone-binding complexes (Fischle et al., 2005; Hu and Wade, 2012; Moriniere et al., 2009; Taverna et al., 2006). However, the question remains whether each of the hundreds of identified modification combinations has a unique function. Identifying combinations of modifications and how they differ across conditions and cell types is one of the current challenges in chromatin biology that can be addressed using mass spectrometry.
Traditional methods such as western blotting and radioisotope labeling of modifications are only useful for studying one PTM at a time. In addition, many antibodies suffer from a lack of specificity and from epitope occlusion when two modifications are too close together (Fuchs et al., 2011). Some progress has been made in developing good quality antibodies against single modifications that have been used in ChIP-Seq investigations, but the modifications of interest still need to be known in advance (Park, 2009). Mass spectrometry is the method of choice for studying modifications on histones because it is sensitive, quantitative, and most importantly previously unknown modification patterns can be studied, and many isoforms of one protein with different modifications can be detected at one time. The most commonly used MS method is Bottom-up MS where proteins are digested into small peptides, which are then resolved chromatographically before they are identified by MS/MS analysis, and finally the peptides are aligned to protein sequences to determine which proteins are present in a sample. Bottom-up mass spectrometry has been instrumental in uncovering new histone modifications and modification sites on histones, however the peptides created by digestion of histones with trypsin or ArgC for bottom-up analysis are too short to gain much information about the context of modifications with respect to other modifications and histone variants with similar sequences (Plazas-Mayorca et al., 2009). Top-down and Middle-down mass MS, where intact proteins or minimally digested proteins are analyzed, provide the sequence context required to identify co-occurring modifications.
The strengths of Middle-down MS are: 1) more of the context is retained for PTMs, and 2) it can be used in combination with on-line separation strategies to increase the number of modified forms identified. Lindner et al showed that HILIC, a normal phase and ion exchange chromatography mixed-mode separation method, is well suited to separating histones and their modified forms (Lindner et al., 1996). In 2004 Lidner's lab used HILIC to separate modified forms of histone H4 tails, thus reducing the sample complexity prior to Middle-down MS analysis (Sarg et al., 2004). Since then HILIC has been used in combination with mass spectrometry to analyze combinatorial modifications on H3 and to analyze H2A variants (Garcia et al., 2008). Our lab developed a volatile reagent-based WCX-HILIC method that is compatible with mass spectrometry to analyze combinatorial modifications on H3 and H4 tails (Young et al., 2009). This on-line method significantly reduced the sample processing time and the amount of sample needed for a more complete analysis of combinatorial modifications. The Middle-down method for H3 in this unit includes this WCX-HILIC method.
Top-down MS is also not a new technique for studying histones and their modifications. It has been used to identify variants and modified forms of all histone family members (Boyne et al., 2006; Pesavento et al., 2008; Sarg et al., 2005; Siuti et al., 2006; Thomas et al., 2006). The technique introduced here involves direct infusion of histone family members into a high-resolution mass spectrometer. This is the simplest Top-down method, but it is not very sensitive. More histone isoforms can be identified using an upfront separation technique. Top-down MS has been combined with off-line HILIC fractionation, capillary electrophoreses and online WCX-HILIC and reversed phase fractionation to increase the number of modified histone forms identified (Eliuk et al., 2010; Tian et al., 2012).
Critical Parameters
The WCX-HILIC technique described in this protocol allowed our lab to identify and estimate the relative abundances of hundreds of combinatorial modifications on histone H3 and H4. However, WCX-HILIC is also very sensitive to changes in running conditions, and it is important to keep every step of the chromatography as consistent as possible between runs. The separation technique relies on both weak cation exchange and hydrophilic interactions; this means that the pH and organic content of the buffers are very important. Buffers shouldn't be allowed to evaporate over time, and should be made by measuring the amount of added acid and base components and adding the same amount of acid and base every time the buffers are made. Similarly all vials filled with buffer A in the on-line nano-LC, used for filling the sample loop when drawing up sample, should be changed on a daily basis.
Both of the techniques described in this protocol are very sensitive to contamination. Contaminant proteins, salt, detergents, and polymers from plastics such as PEG (polyethylene glycol) can affect your sample's ionization efficiency, chromatography, and make spectra more difficult to interpret. For that reason it is important to start with a good histone prep, wear gloves, maintain a clean lab space, and desalt samples well before loading them onto the mass spectrometer. It is also important to make sure all of the off-line, on-line, and stage tip buffers are clean. Buffers containing ammonium ions or formic acid are unstable and should only be used for a month before they are replaced. In addition, formic acid and acetonitrile-containing buffers are light sensitive and should be stored in amber bottles at ambient temperature.
The MS parameters described in this unit are specific for the LTQ-Orbitrap XL that we use in our lab. However a number of high-resolution, high mass accuracy instruments could be used for these techniques including other Orbitrap models and FT-ICR. In fact, new mass spectrometers have been developed since the LTQ Obitrap-XL that would be better for analyzing large peptides or intact proteins because they have a higher resolution, faster duty cycles, higher sensitivity, and better ETD ion transmission. The type of fragmentation technique is also important. ETD gives the best results for highly charged peptides and proteins. Complete protein or peptide fragmentation is important for localizing modification sites and for differentiating between very similar protein isoforms. Higher energy collision induced dissociation (HCD) has also been used successfully for sequencing of top-down proteins and large peptides, however some method development would be required before it is applied to histones. It is better to use a higher resolution spectrometer for MS/MS analysis so that the charge states on fragment ions can be resolved.
Troubleshooting
A table of common problems encountered in Top and Middle-down MS of histone modifications and possible solutions are summarized in Table 4.
Table 4. Troubleshooting Guide.
| PROBLEM | POSSIBLE CAUSE | SOLUTION |
|---|---|---|
| Poor signal during Top-down analysis | Sample loss during prep | Measure the amount of protein you collect from offline RP-HPLC peaks by Bradford or run some of the sample on a gel to ensure that you are collecting enough sample. You may need to change your histone extraction procedure to improve yield. You can also try collecting histones using a 10 mm column. |
| Poor tuning | Tune ion transmission using myoglobin, or an abundant histone sample. Sometimes the automatic tune function in the mass spectrometer will settle on a local maximum and manual tuning is required. | |
| Ion suppression from contaminant ions | Keep working area clean. Sometimes contamination can also come from detergents on glassware. Always use LC-MS grade solvents and high purity acids. | |
| Unidentified peaks in Top-Down MS1 spectrum | Protein impurities or salt adducts of the protein of interest | Make sure that solvents are clean. Collect HPLC fractions only over the middle of the histone of interest's elution profile. |
| Low-quality ETD spectra | Reaction time is too short | Increase ETD reaction time. In the ETD tune window there is also the option to tune the ETD reaction time. |
| ETD reagent ion signal is low or unstable -Reagent ion was not tuned properly, MS was not tuned in negative ion mode for ion transmission recently, dirty ion volume. | Calibrate the negative ion multipliers (this can affect the AGC). Refer to your user manual for suggested voltages to make sure the tune values are not too far out of range. You may also need to replace the ion volume. | |
| Poor on-line WCX-HILIC chromatography | Column not equilibrated well between MS runs | Equilibrate for longer, and make sure to equilibrate for the same amount of time between runs. |
| Improper organic solvent concentrations in HILIC buffer A – analyte is eluted in the void volume | Prepare fresh buffers weekly | |
| Unrecognizable peaks in H3 Glu-C digest off-line chromatogram | Over digestion of sample, dirty histone prep | Optimize digest times. Acid extract histones for less time if you are using the acid extraction technique. |
| Unrecognizable peaks in H3 Glu-C digest or H4 digest on- line chromatogram | Salt contamination | Add more washes in Stage-Tip procedure. Replace solvents. |
| PEG contamination | PEG can come from many sources including plastic ware. Consider using different tubes or washing tubes with methanol before use. Many new columns also contain PEG. Wash the column at 95% online RP-buffer B until the PEG signal disappears. | |
| Pulled emitter tip is elongated and wont open easily | Wrong tip puller method | Adjust tip puller heat and velocity to achieve better quality tips |
| Dirty laser optics | Follow manufacturers instructions to clean the mirrors inside of the tip puller | |
| Column stops packing or is packing slowly | Pressure leak | Check pressure bomb and fittings going to bomb for leaks |
| Wrong tip geometry | Adjust puller settings to create a larger tip opening – it is possible for resin to clog the tip opening | |
| Clogged column | Clean vial and start again with a new empty column. Make sure to maintain a dust-free environment for column packing. |
Anticipated Results
Histones are highly modified proteins. A fairly comprehensive list of PTMs for all histones and their variants can be found on-line at http://www.actrec.gov.in/histome/index.php. The most common modifications on histones are lysine acetylation and methylation, consequently the most intense peaks in Top-down and Middle-down spectra will correspond to acetylated and methylated forms of histones. The patterns of modifications and the detection of other less common modifications will depend on your samples. For example, stem cell samples will have more histone acetylation, and mitotic samples will have more phosphorylation sites (Banerjee and Chakravarti, 2011; Shukla et al., 2008).
Middle-down MS
Digested and purified histone H3 and H4 N-terminal tails will be separated according to their hydrophilicity using on-line WCX-HILIC chromatography, with tails eluting according to number of acetylation groups. Within each acetylation-group peak the tails are further resolved according to the number and position of methylation groups. At low pH, lysines and arginines are positively charged, but when the lysines are acetylated they lose their charge making them more hydrophobic. This is why more highly acetylated peptides elute first on the WCX-HILIC column and unmodified peptides elute last. The trend is the opposite for H4 resolved using reversed phase chromatography, the more hydrophobic highly-acetylated forms elute last. Neither separation method will result in sharp peaks corresponding to completely resolved modified forms because modified isomers are so similar to each other. However, the researcher should be able to rely on diagnostic peaks in the ETD spectrum to distinguish between different modified forms as they elute.
WCX-HILIC middle-down MS is a sensitive technique. Good signal can be obtained from 1ug of digested purified H3 and H4 tails on LTQ-ion trap using WCX-HILIC. The dynamic range and sensitivity will depend on your mass spectrometer and quality of chromatography. According to Coon et al, the reversed phase LC – Middle-down MS analysis of histone H4(1-23) modified forms should have a linear dynamic range for modified forms 1:100 in terms of peak intensity (1 fmol of a modified form can be detected in the presence of 10 pmol of other forms), and a dynamic range of 1:10,000 (Phanstiel et al., 2008). The number of combinatorial modifications detected from butyrate (a histone deacetylation inhibitor) treated HeLa cells using the WCX-HILIC was 70 for H4, over 200 forms of H3.2. The most highly modified form of histone H3 had five acetylation sites and two methylation sites (Young et al., 2009). The number of modified forms of H4 that can be detected using reversed phase chromatography is similar to the number detected using WCX-HILIC.
Top-down MS
All histone family members can be analyzed by Top-down MS. If the histone family members are not separated further then the most abundant modified forms will be detected. For H4 there are usually 13 peaks corresponding to most abundant forms, for H3 there are many more. The standard Top-down infusion experiment can be done with 10μg of sample, however, more sample is better because there are more chances to analyze less abundant forms. The sensitivity depends on instrumentation.
Time Considerations
Purification and separation of histone family members (1.5 days)
Isolation of nuclei from mammalian cell lines and acid extraction of histones from them takes one day (approximately 5 hours of bench work, including incubation and precipitation steps).
The total amount of time needed to finish separating the histone family members using reversed phase chromatography is approximately 3.5 hours. This includes: one hour to run a blank run to clean the column, and 15 minutes to equilibrate the column after the blank run, two hours to resolve the histones and finally one hour to dry the samples in the centrifugal vacuum concentrator (this depends on the efficiency of your system).
Middle-down mass spectrometry of one histone family member (2 days)
The preparatory steps for Middle-down MS (digestion and de-salting) takes approximately 7 hours for histone H4 and 8 hours for histone H3 (the extra time comes from having to run a reversed-phase gradient to purify the N-terminal tail of H3). Collecting data on the mass spectrometer takes 1.5 hours for the reverse-phase separation of modified forms of histone H4, and 5 hours to resolve the modified forms of histone H3 by WCX-HILIC. The reversed phase chromatography method requires an extra 30 minutes for column equilibration and sample loading, and the WCX-HILIC method requires 60 extra minutes for sample loading and column equilibration.
Top-down mass spectrometry of one histone family member (1 day)
Preparing the mass spectrometer for Top-down MS, including tuning the ion optics, warming the ETD reagent ion source, and switching to an infusion system takes around one hour. The amount of time required to analyze one histone family member depends on the number of isoforms of the protein that are detected. For histone H4 there are around 14 abundant forms, to collect MS2 for every form would take around 1.5 hours.
Data analysis (1-2 days)
A typical run using commercial or opensource database searching software takes a few minutes for Top-down and for Middle-down analysis of one protein. Confirming the results from these analyses can take several hours. Analyzing MS2 data by hand will take much longer.
Packing analytical columns (0.5 day)
Analytical columns (15 cm) should finish packing within 1-2 hours if they are not clogged. Conditioning the columns using two one-hour HPLC gradients takes another 2 hours.
Acknowledgments
The data in this protocol were collected by Nicolas Young and Barry Zee. Thanks to Barry Zee for reading and providing insight into the Middle-down techniques in this paper. BAG acknowledges funding from a National Science Foundation Early Faculty CAREER award, and the NIH Innovator grant (DP2OD007447) from the Office of the Director, and an NSF CBET-0941143 award.
Footnotes
Internet Resources: http://www.actrec.gov.in/histome/index.php
Includes sequences and modification sites for all histones and histone variants.
http://prospector.ucsf.edu/prospector/cgi-bin/msform.cgi?form=msproduct
A useful tool for predicting c and z ion masses given a protein sequence. It will also match predicted ions to an imported peak list from your ETD MS2 spectrum.
http://prosightptm2.northwestern.edu
Can be used for database searching of ETD MS2 spectra of peptides and intact proteins.
Literature Cited
- Banerjee T, Chakravarti D. A Peek into the Complex Realm of Histone Phosphorylation. Mol Cell Biol. 2011;31:4858–4873. doi: 10.1128/MCB.05631-11. [DOI] [PMC free article] [PubMed] [Google Scholar]
- Boyne MT, 2nd, Pesavento JJ, Mizzen CA, Kelleher NL. Precise characterization of human histones in the H2A gene family by top down mass spectrometry. J Proteome Res. 2006;5:248–253. doi: 10.1021/pr050269n. [DOI] [PubMed] [Google Scholar]
- LeDuc RD, Kelleher NL. Current Protocols in Bioinformatics. John Wiley & Sons, Inc.; 2002. Using ProSight PTM and Related Tools for Targeted Protein Identification and Characterization with High Mass Accuracy Tandem MS Data. [DOI] [PubMed] [Google Scholar]
- DiMaggio PA, Young NL, Baliban RC, Garcia BA, Floudas CA. A Mixed Integer Linear Optimization Framework for the Identification and Quantification of Targeted Post-translational Modifications of Highly Modified Proteins Using Multiplexed Electron Transfer Dissociation Tandem Mass Spectrometry. Molecular & Cellular Proteomics. 2009;8:2527–2543. doi: 10.1074/mcp.M900144-MCP200. [DOI] [PMC free article] [PubMed] [Google Scholar]
- Eliuk SM, Maltby D, Panning B, Burlingame AL. High Resolution Electron Transfer Dissociation Studies of Unfractionated Intact Histones from Murine Embryonic Stem Cells Using On-line Capillary LC Separation: DETERMINATION OF ABUNDANT HISTONE ISOFORMS AND POST-TRANSLATIONAL MODIFICATIONS. Molecular & Cellular Proteomics. 2010;9:824–837. doi: 10.1074/mcp.M900569-MCP200. [DOI] [PMC free article] [PubMed] [Google Scholar]
- Fischle W, Tseng BS, Dormann HL, Ueberheide BM, Garcia BA, Shabanowitz J, Hunt DF, Funabiki H, Allis CD. Regulation of HP1-chromatin binding by histone H3 methylation and phosphorylation. Nature. 2005;438:1116–1122. doi: 10.1038/nature04219. [DOI] [PubMed] [Google Scholar]
- Fuchs SM, Krajewski K, Baker RW, Miller VL, Strahl BD. Influence of combinatorial histone modifications on antibody and effector protein recognition. Curr Biol. 2011;21:53–58. doi: 10.1016/j.cub.2010.11.058. [DOI] [PMC free article] [PubMed] [Google Scholar]
- Garcia BA, Pesavento JJ, Mizzen CA, Kelleher NL. Pervasive combinatorial modification of histone H3 in human cells. Nat Methods. 2007;4:487–489. doi: 10.1038/nmeth1052. [DOI] [PubMed] [Google Scholar]
- Garcia BA, Thomas CE, Kelleher NL, Mizzen CA. Tissue-specific expression and post-translational modification of histone H3 variants. J Proteome Res. 2008;7:4225–4236. doi: 10.1021/pr800044q. [DOI] [PMC free article] [PubMed] [Google Scholar]
- Goodlett DR, Yi EC, Mottay P. Preparation and Use of an Integrated Microcapillary HPLC Column and ESI Device for Proteomic Analysis. Cold Spring Harbor Protocols. 2007 doi: 10.1101/pdb.prot4617. 2007:pdb.prot4617. [DOI] [PubMed] [Google Scholar]
- Hu G, Wade Paul A. NuRD and Pluripotency: A Complex Balancing Act. Cell Stem Cell. 2012;10:497–503. doi: 10.1016/j.stem.2012.04.011. [DOI] [PMC free article] [PubMed] [Google Scholar]
- Lindner H, Sarg B, Meraner C, Helliger W. Separation of acetylated core histones by hydrophilic-interaction liquid chromatography. Journal of Chromatography A. 1996;743:137–144. doi: 10.1016/0021-9673(96)00131-8. [DOI] [PubMed] [Google Scholar]
- Link AJ, LaBaer J. Proteomics: A Cold Spring Harbor Laboratory Course Manual. Cold Spring Harbor Laboratory Press; 2009. [Google Scholar]
- McAlister GC, Phanstiel D, Good DM, Berggren WT, Coon JJ. Implementation of electron-transfer dissociation on a hybrid linear ion trap-orbitrap mass spectrometer. Analytical Chemistry. 2007;79:3525–3534. doi: 10.1021/ac070020k. [DOI] [PMC free article] [PubMed] [Google Scholar]
- Moriniere J, Rousseaux S, Steuerwald U, Soler-Lopez M, Curtet S, Vitte AL, Govin J, Gaucher J, Sadoul K, Hart DJ, Krijgsveld J, Khochbin S, Muller CW, Petosa C. Cooperative binding of two acetylation marks on a histone tail by a single bromodomain. Nature. 2009;461:664–668. doi: 10.1038/nature08397. [DOI] [PubMed] [Google Scholar]
- Park PJ. ChIP-seq: advantages and challenges of a maturing technology. Nat Rev Genet. 2009;10:669–680. doi: 10.1038/nrg2641. [DOI] [PMC free article] [PubMed] [Google Scholar]
- Pesavento JJ, Bullock CR, LeDuc RD, Mizzen CA, Kelleher NL. Combinatorial Modification of Human Histone H4 Quantitated by Two-dimensional Liquid Chromatography Coupled with Top Down Mass Spectrometry. J Biol Chem. 2008;283:14927–14937. doi: 10.1074/jbc.M709796200. [DOI] [PMC free article] [PubMed] [Google Scholar]
- Pesavento JJ, Garcia BA, Streeky JA, Kelleher NL, Mizzen CA. Mild Performic Acid Oxidation Enhances Chromatographic and Top Down Mass Spectrometric Analyses of Histones. Molecular & Cellular Proteomics. 2007;6:1510–1526. doi: 10.1074/mcp.M600404-MCP200. [DOI] [PubMed] [Google Scholar]
- Phanstiel D, Brumbaugh J, Berggren WT, Conard K, Feng X, Levenstein ME, McAlister GC, Thomson JA, Coon JJ. Mass spectrometry identifies and quantifies 74 unique histone H4 isoforms in differentiating human embryonic stem cells. Proceedings of the National Academy of Sciences. 2008;105:4093–4098. doi: 10.1073/pnas.0710515105. [DOI] [PMC free article] [PubMed] [Google Scholar]
- Plazas-Mayorca MD, Zee BM, Young NL, Fingerman IM, LeRoy G, Briggs SD, Garcia BA. One-pot shotgun quantitative mass spectrometry characterization of histones. J Proteome Res. 2009;8:5367–5374. doi: 10.1021/pr900777e. [DOI] [PMC free article] [PubMed] [Google Scholar]
- Rappsilber J, Ishihama Y, Mann M. Stop and go extraction tips for matrix-assisted laser desorption/ionization, nanoelectrospray, and LC/MS sample pretreatment in proteomics. Anal Chem. 2003;75:663–670. doi: 10.1021/ac026117i. [DOI] [PubMed] [Google Scholar]
- Sarg B, Gréen A, Söderkvist P, Helliger W, Rundquist I, Lindner HH. Characterization of sequence variations in human histone H1.2 and H1.4 subtypes. FEBS Journal. 2005;272:3673–3683. doi: 10.1111/j.1742-4658.2005.04793.x. [DOI] [PubMed] [Google Scholar]
- Sarg B, Helliger W, Talasz H, Koutzamani E, Lindner HH. Histone H4 Hyperacetylation Precludes Histone H4 Lysine 20 Trimethylation. J Biol Chem. 2004;279:53458–53464. doi: 10.1074/jbc.M409099200. [DOI] [PubMed] [Google Scholar]
- Schieltz DM, Washburn MP, Hays LG. Analysis of Complex Protein Mixtures Using Nano-LC Coupled to MS/MS. Cold Spring Harbor Protocols. 2006 doi: 10.1101/pdb.prot4553. 2006:pdb.prot4553. [DOI] [PubMed] [Google Scholar]
- Shechter D, Dormann HL, Allis CD, Hake SB. Extraction, purification and analysis of histones. Nat Protoc. 2007;2:1445–1457. doi: 10.1038/nprot.2007.202. [DOI] [PubMed] [Google Scholar]
- Shukla V, Vaissière T, Herceg Z. Histone acetylation and chromatin signature in stem cell identity and cancer. Mutation Research/Fundamental and Molecular Mechanisms of Mutagenesis. 2008;637:1–15. doi: 10.1016/j.mrfmmm.2007.07.012. [DOI] [PubMed] [Google Scholar]
- Sidoli S, Cheng L, Jensen ON. Proteomics in chromatin biology and epigenetics: Elucidation of post-translational modifications of histone proteins by mass spectrometry. Journal of Proteomics. 2012;75:3419–3433. doi: 10.1016/j.jprot.2011.12.029. [DOI] [PubMed] [Google Scholar]
- Siuti N, Roth MJ, Mizzen CA, Kelleher NL, Pesavento JJ. Gene-specific characterization of human histone H2B by electron capture dissociation. J Proteome Res. 2006;5:233–239. doi: 10.1021/pr050268v. [DOI] [PubMed] [Google Scholar]
- Taverna SD, Ilin S, Rogers RS, Tanny JC, Lavender H, Li H, Baker L, Boyle J, Blair LP, Chait Brian T, Patel DJ, Aitchison JD, Tackett AJ, Allis CD. Yng1 PHD Finger Binding to H3 Trimethylated at K4 Promotes NuA3 HAT Activity at K14 of H3 and Transcription at a Subset of Targeted ORFs. Molecular cell. 2006;24:785–796. doi: 10.1016/j.molcel.2006.10.026. [DOI] [PMC free article] [PubMed] [Google Scholar]
- Thomas CE, Kelleher NL, Mizzen CA. Mass spectrometric characterization of human histone H3: a bird's eye view. J Proteome Res. 2006;5:240–247. doi: 10.1021/pr050266a. [DOI] [PubMed] [Google Scholar]
- Tian Z, Tolic N, Zhao R, Moore RJ, Hengel SM, Robinson EW, Stenoien DL, Wu S, Smith RD, Pasa-Tolic L. Enhanced top-down characterization of histone post-translational modifications. Genome Biol. 2012;13:R86. doi: 10.1186/gb-2012-13-10-r86. [DOI] [PMC free article] [PubMed] [Google Scholar]
- Wang LH, Li DQ, Fu Y, Wang HP, Zhang JF, Yuan ZF, Sun RX, Zeng R, He SM, Gao W. pFind 2.0: a software package for peptide and protein identification via tandem mass spectrometry. Rapid Commun Mass Spectrom. 2007;21:2985–2991. doi: 10.1002/rcm.3173. [DOI] [PubMed] [Google Scholar]
- Young NL, DiMaggio PA, Plazas-Mayorca MD, Baliban RC, Floudas CA, Garcia BA. High throughput characterization of combinatorial histone codes. Mol Cell Proteomics. 2009;8:2266–2284. doi: 10.1074/mcp.M900238-MCP200. [DOI] [PMC free article] [PubMed] [Google Scholar]
- Young NL, Plazas-Mayorca MD, DiMaggio PA, Flaniken IZ, Beltran AJ, Mishra N, LeRoy G, Floudas CA, Garcia BA. Collective Mass Spectrometry Approaches Reveal Broad and Combinatorial Modification of High Mobility Group Protein A1a. Journal of the American Society for Mass Spectrometry. 2010a;21:960–970. doi: 10.1016/j.jasms.2010.01.020. [DOI] [PMC free article] [PubMed] [Google Scholar]
- Young NL, Plazas-Mayorca MD, Garcia BA. Systems-wide proteomic characterization of combinatorial post-translational modification patterns. Expert Rev Proteomics. 2010b;7:79–92. doi: 10.1586/epr.09.100. [DOI] [PubMed] [Google Scholar]
- Zamdborg L, LeDuc RD, Glowacz KJ, Kim YB, Viswanathan V, Spaulding IT, Early BP, Bluhm EJ, Babai S, Kelleher NL. ProSight PTM 2.0: improved protein identification and characterization for top down mass spectrometry. Nucleic Acids Res. 2007;35:W701–706. doi: 10.1093/nar/gkm371. [DOI] [PMC free article] [PubMed] [Google Scholar]