Abstract
Matrix-Assisted Laser Desorption/Ionization (MALDI) Imaging Mass Spectrometry (IMS) is a molecular technology that allows simultaneous investigation of the content and spatial distribution of molecules within tissue. In this work, we examine different classes of detergents, the anionic sodium dodecyl sulfate (SDS), the nonionic detergents Triton X-100, Tween 20 and Tween 80, and the zwitterionic 3-[(3-cholamidopropyl)dimethylammonio]-1-propanesulfonate (CHAPS) for use in MALDI IMS of analytes above m/z 4000. These detergents were found to be compatible with MALDI MS and did not cause signal suppression relative to non-detergent applications and did not produce interfering background signals. In general, these detergents enhanced signal acquisition within the mass range m/z 4–40 000. Adding detergents into the matrix was comparable with the separate application of detergent and matrix. Evaluation of spectra collected from organ-specific regions of a whole mouse pup section showed that different detergents perform optimally with different organs, indicating that detergent selection should be optimized on the specific tissue for maximum gain. These data show the utility of detergents towards enhancement of protein signals for on-tissue MALDI IMS analysis.
Matrix-assisted laser desorption/ionization (MALDI) imaging mass spectrometry (IMS) allows the simultaneous investigation of the content and spatial distribution of small molecules, lipids, peptides, and proteins directly from tissue sections.[1] The technology is especially powerful for the discovery of tissue and cellular specific proteins since it does not require knowledge of the identity of any of the molecular constituents prior to analysis. In this aspect, protein analysis of thin tissue sections by MALDI IMS has been used to elucidate new molecular information on a wide variety of developmental and disease processes.[2–5]
One challenge for this technology is to further enhance the sensitivity and to increase the number of protein signals obtained from tissue. Much work has been performed towards the optimization of sample handling to define the influence of tissue collection, storage, sectioning and mounting, on the detection of protein signals from tissue. Several protocols targeting matrix concentration, solvent composition, and matrix deposition have been investigated towards optimizing protein signals.[6–8] However, in comparison with in-solution analysis, on-tissue analysis of proteins is less robust in terms of peak resolution, sensitivity, and reproducibility. This is thought to be largely due to issues in solubilizing proteins from within the tissue structure.
One strategy to improve protein solubilization from thin tissue sections involves the use of detergents during sample preparation. The efficacy of surfactants on MALDI mass spectrometry (MS) has been of interest since the first application of this technology to biological macromolecules.[9,10] Previous studies focused on the in-solution analysis of proteins and peptides and many reported that the use of detergents degrades the quality of spectra in terms of both the signal-to-noise ratio and the peak resolution. However, other reports showed that some detergents were beneficial for MALDI MS and were even able to improve protein signal intensities from samples in solution.[11–13] Detergents have been used to improve the MALDI MS of membrane proteins, as well as of hydrophobic peptides.[14,15] One application involving MALDI IMS has shown improved signal intensity of proteins above m/z 25 000 by applying Triton X-100 and matrix using a modified ‘sandwich’ approach.[16] Together, these investigations indicate a potential general utility of detergents towards enhancing signals from complex mixtures of proteins for MALDI time-of-flight (TOF) MS analysis.
Initial exploration in our laboratory using SDS or Triton X-100 for on-tissue analysis indicated that the use of these detergents did not degrade the quality of the spectra, as indicated by peak number and peak shape. We therefore set about characterizing a panel of detergents for the analysis of thin tissue sections by MALDI IMS. Our results show that judicious selection of detergents results in a significant enhancement of on-tissue protein signals.
EXPERIMENTAL
Materials
Acetonitrile, eosin, Triton X-100 and Tween 20 were purchased from Fisher Scientific Inc. (Fairlawn, NJ, USA); trifluoroacetic acid (TFA) was purchased from Acros Organics (Morris Plains, NJ, USA); SDS, Tween 80, CHAPS, sinapinic acid (SA) and hematoxylin were purchased from Sigma-Aldrich (St. Louis, MO, USA). SA was purified through recrystallization.
Tissue preparation
ICR mice at postnatal day 1 (P1) and 12 weeks were euthanized by CO2 asphyxiation following the Institutional Animal Care and Use Committee (IACUC) guidelines. Whole body pups (P1) were snap frozen, cryosectioned with thickness of 12 μm, thaw-mounted onto indium-tin oxide (ITO)-coated glass squares (Delta Technologies, Stillwater, MN, USA) and vacuum dehydrated for 2 h. Adult mouse liver tissue was submitted to the same preparation but mounted onto gold-plated MALDI targets (Applied Biosystems, Foster City, CA, USA). Serial sections of all tissue types were collected onto microscope slides and subjected to hematoxylin and eosin (H&E) staining. Sections for imaging analysis were washed sequentially with 70, 90 and 95% ethanol for 30 s, allowed to dry in a vacuum desiccator 1 h and then stored at −80°C.
MALDI matrix preparation
For manual profiling, the matrix solutions were freshly prepared at a concentration of 20 mg/mL 50/0.25 (% v/v) acetonitrile/TFA. Detergents were added to the matrix solvent solution at concentrations of 0.01%, 0.03%, 0.05% and 0.1% (v/v) to define the optimal concentration for MALDI-TOF analysis.
Automated spotting was performed using an acoustic robotic spotter (Portrait 630, Labcyte, Sunnyvale, CA, USA). The matrix was prepared at 18 mg/mL SA in 50/0.25% (v/v) acetonitrile/TFA solvent. Matrices with detergent were prepared by adding concentrations of selected detergent to the matrix at the specified ratio (% v/v). Matrices with and without detergent were spotted onto tissue sections with a 200 μm center-to-center spot distance over 30 cycles of one droplet per cycle using the Fly-by setting.
MALDI-TOF data acquisition
Imaging and profiling data were acquired using a linear mode MALDI-TOF mass spectrometer (Autoflex II, Bruker Daltonics, Bremen, Germany) in positive ion mode with a range extending from m/z 4000 to 40 000. The source was set to an accelerating voltage of 20 kV with an extraction voltage of 18.55 kV, a lens voltage of 6.80 kV and a pulsed ion extraction time of 400 ns. Matrix suppression was achieved with a medium gating set to 1100 Da. Ionization was performed with a Nd:YAG laser/355 nm set at 200 Hz frequency and the laser fluency was set at about 90%. External calibration utilized a set of standard proteins: bovine insulin ([M+H] =m/z 5734.5), equine cytochrome C ([M+H] =m/z 12361.2), equine apomyoglobin ([M+H] =m/z 16952.5), bovine trypsinogen([M+H] =m/z 23982.0). Imaging data were automatically acquired by summing up 640 shots in 40 shot steps with a random walk pattern. Manually spotted samples spectra were acquired by summing 700 shots in 100 shots/step.
Data analysis
For liver tissue from adult animals, 350 spectra were selected from similar regions in serial sections. For the whole body pup sections, spectra from specific organ tissues were selected by co-registering the serial H & E staining over the spotted section. A total of 100 spectra were selected for the heart area while 250 were selected from the brain region. Statistical analysis and multiple spectra comparison were performed by ClinProTools 2.2 software (Bruker Daltonics) in the range between m/z 4000 and 40 000. Spectra were first normalized to total ion current, then recalibrated with 1000 parts per million (ppm) as the maximal peak shift with a 30% match to calibrant peaks. The spectra were baseline subtracted using the ‘Top Hat’ algorithm with a minimum baseline width of 10% and smoothed using the Savitsky-Golay smoothing filter set at 2 Da width over five cycles. Peak calculation was based on peak intensity and was performed with a signal-to-noise (S/N) ratio of 5 on the total average spectrum of each class. The peak intensities considered statistically significant between classes were based on a combination of ANOVA test (p-value <0.05) and ROC curves analysis (AUC >0.8); peak detection was set at S/N ratio of 5. The imaging data were processed using the FlexImaging software package (version 2.1; Bruker Daltonics).
RESULTS
Based on preliminary studies indicating compatibility of detergents with on-tissue analysis, we assessed the use of detergents for MALDI imaging and profiling studies. Table 1 summarizes the detergents selected for examination based on previous reports of compatibility with in-solution protein analysis by MALDI MS and broad use across biological applications.
Table 1.
Molecular characteristics of selected detergents characterized on thin tissue sections by MALDI MS. Optimal concentration determined on liver tissue diluted in matrix solution
| Detergent | Molecular formula | Molecular weight (g/mol) | Headgroup | Critical micelle concentration (mM at 25°C) | Optimal concentration
|
|
|---|---|---|---|---|---|---|
| (% v/v) | mM | |||||
| SDS | C12H25O4NaS | 288.38 | Anionic | 10 | 0.05 | 0.17 |
| CHAPS | C32H58N2O7S | 614.88 | Zwitterionic | 6.0 | - | - |
| Triton X-100 | C14H22O(OC2H4)n | 602.81, n =9 646.43, n =10 |
Nonionic | 0.2 | 0.05 | 0.08 0.07 |
| Tween 20 | C58H114O26 (avg) | 1227.53 | Nonionic | 0.06 | 0.1 | 0.08 |
| Tween 80 | C64H124O26 (avg) | 1309.68 | Nonionic | 0.012 | 0.03 | 0.022 |
Using liver for our initial study, we investigated a range of concentrations from each detergent. The optimal concentration for on-tissue MALDI MS analysis was determined based on the intensity of the total ion current and the peak shape (0.05% for SDS and Triton X-100, 0.1% for Tween 20 and 0.03% for Tween 80). For each tested detergent, the control (off-tissue matrix spotting) demonstrated a null baseline over m/z 4–40 000, indicating no interference due to the use of the detergent. The CHAPS detergent produced high variability both in crystal formation and subsequently spectral acquisition so was not evaluated further for tissue analysis. For other detergents, specific differences in spectral quality were observed. Triton X-100, Tween 20 and Tween 80 showed a remarkable increase in sensitivity over matrix without detergent, especially in the mass range between m/z 8000 and 14 000; of these, Tween 20 appeared to produce the most improvement based on peak intensity and peak number within the range m/z 4000–40 000. Another interesting observation was that between m/z 6000 and 7000, peaks of low intensity in protocols without detergent were enhanced in the detergent-treated samples. Although we expected that detergents would enhance higher mass protein signal, using instrument methods optimized for higher mass analysis (m/z 40 000–80 000), we did not observe a significant improvement in the higher mass range. Overall, with the exception of CHAPS, the selected detergents demonstrated an increased performance for on-tissue analysis by MALDI MS.
Application strategies were tested both by detergent addition into the matrix and by spotting the detergent onto the tissue, letting the spot dry and then depositing the matrix without detergent on top of the dried detergent spot. Adding detergents into the matrix would be particularly useful with strategies that involve manual spraying or robotic spotting of samples prior to MALDI imaging studies. No statistically significant differences were observed by comparison of mass spectra generated using detergents added into the matrix or spotted with detergents prior to matrix application. Thus, either approach would be suitable for including detergents in the application of matrix to thin tissue sections.
In order to limit potential variability and further explore the improvement of sensitivity in protein detection, matrices with detergents added were applied using a robotic acoustic spotter. Compatibility with acoustic spotting depends largely on the surface tension of the solution and although Tween 20 and Tween 80 showed a noticeable enhancement of peak intensity during manual profiling, these detergents were not compatible with acoustic spotting. However, the anionic detergent SDS and the nonionic detergent Triton X-100 worked well with acoustic deposition of matrix, allowing detailed comparison of two broadly utilized detergents with MALDI matrix prepared without detergent.
Section-to-section variability for each matrix preparation was examined by comparing peak intensities from three consecutive adult mouse liver sections. Each of the selected matrices demonstrated high reproducibility in the number of peaks (SDS 162 ± 5; Triton X-100 123 ± 7; matrix without detergent 147 ± 9) with no significant difference in peak intensities found between consecutive mouse liver sections spotted with the same matrix. These data indicate that the selected matrices could be automatically spotted with high reproducibility across multiple sections of tissue.
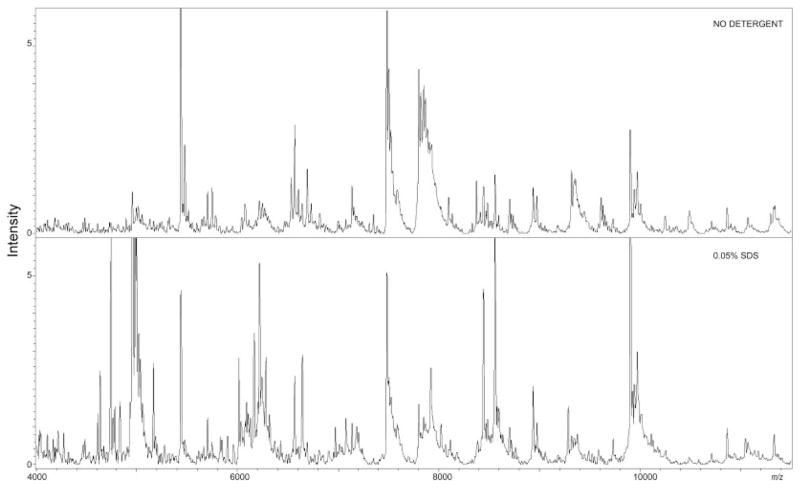
We also assessed differences related to the detergents on liver tissue sections, comparing consecutive sections alternatively spotted with or without detergent added to the matrix. The results, reported in Fig. 1, show that automated spotting of SDS performed better on liver tissue and produced large improvements in peak intensity. For the matrix with SDS, 35% of peaks showed a significant improvement in signal intensity, whereas Triton X-100 added to the matrix showed an increase in intensity of 16% relative to no detergent. These results suggest a complementary enhancement of signal that varied with detergent selection.
Figure 1. Liver tissue.
Left panel: mass range between m/z 4000 and 11 000 of the average protein profile of liver tissue sections from automated acoustic spotting of matrix without detergent or with 0.05% SDS added. Detergent-added matrix leads to a significant enhancement in peak sensitivity. Statistical evaluation across the mass range showed 0.05% SDS to be the best detergent for liver tissue with 35% of the peaks having a significant enhancement in peak intensity.
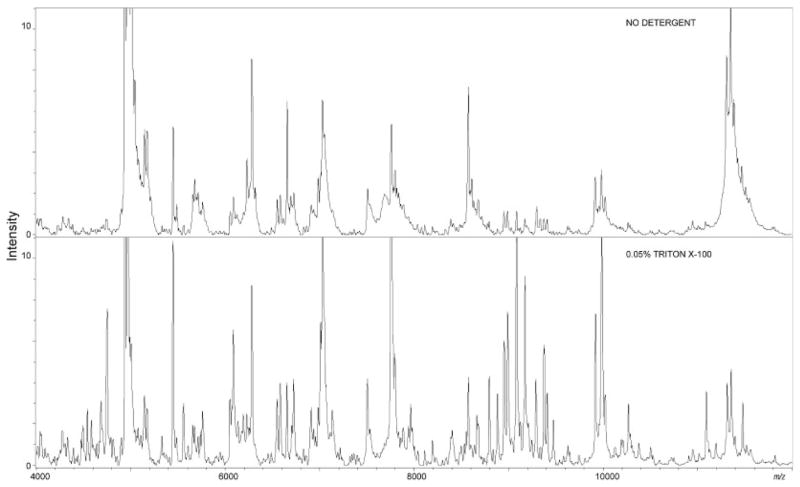
To explore the effects of detergent across a variety of organs, consecutive whole mouse pup sections were spotted with no detergent, 0.05% SDS or 0.05% Triton X-100 added into the matrices. Interestingly, different detergents appeared to perform optimally on different organs. Figures 2 and 3, respectively, show spectral comparison between the matrices on brain and heart tissue. On brain tissue, many peaks were detected only with the nonionic Triton X-100. The use of Triton X-100 also produced a large increase in peak intensity for many analytes from brain tissue that were observed with low intensity when no detergent was used. SDS added to the matrix did not show improvement relative to the matrix without detergent.
Figure 2. Brain tissue.
Left panel: mass range between m/z 4000 and 12 000 of the average protein profile of brain tissue sections obtained from automated acoustic spotting of matrix without detergent or with 0.05% Triton X-100 added. Addition of detergent to the matrix leads to a significant enhancement in peak sensitivity. Statistical evaluation showed Triton X-100 to be the best detergent for brain tissue with an increase in intensity of 42% of the peaks compared with the sample without detergent added to the matrix.
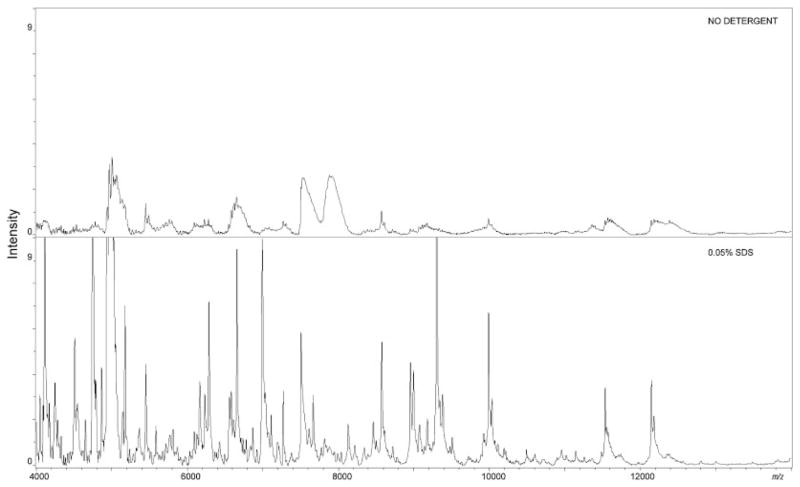
Figure 3. Heart tissue.
Left panel: mass range between m/z 4000 and 14 000 of the average protein profile of heart sections obtained from automated acoustic spotting of matrix without detergent or added with 0.05% SDS. Statistical evaluation showed that SDS detergent was optimal for heart tissue analysis.
For heart tissue both SDS and Triton X-100 showed improvement over matrix without detergent, but SDS produced the largest improvement in spectral quality and peak detection. Statistical evaluation indicated that 50% of the peaks were enhanced in intensity due to the use of SDS, whereas 20% of the peaks were improved by the use of Triton X-100. We noted that within the heart area the matrix without detergent crystallized poorly in blood fields that were rich in hemoglobin (m/z 14 900 and 15 600). This appeared to cause suppression of other proteins. We observed that in these areas, the use of Triton X-100 and SDS detergents produced a more uniform crystallization of the matrix and enhanced sensitivity in areas of high blood content. We believe that the differential enhancement is a result of the inherently different tissue structure and molecular composition of each organ. For example, brain tissue has a high lipid content and the nonionic detergent Triton X-100 preferentially enhances signal in the brain over the anionic SDS. Conversely, heart tissue is continually bathed in blood and has a high ionic content due to potassium and calcium, crucial for muscle contraction. This may explain why the anionic SDS produces optimal signal of proteins from this tissue and other tissue such as liver, that have a high blood content. From these data, it appears that in addition to a complementary extraction of analytes as observed in liver tissue, the detergent selection influences peak enhancement from differing organs during on-tissue MALDI MS analysis.
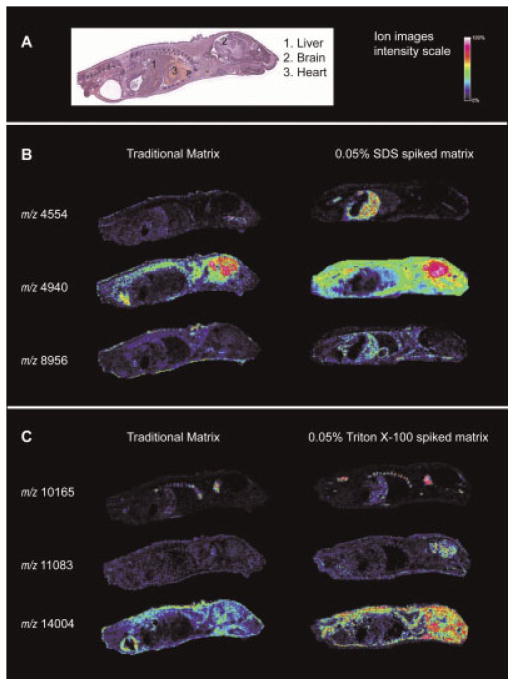
The use of detergents improved many ion images from various organs across the whole body pup section. Figure 4 shows examples of ion images enhanced by the addition of detergent to matrix. Images of ions at m/z 4554, 10165 and 11083 demonstrate an improvement in sensitivity in specific organs over matrix without detergent. Images related to the spatial distribution of m/z 8956, 4940 and 14004 show a more ubiquitous ion distribution that clearly establishes an improved sensitivity of detection during MALDI MS due to the use of detergents.
Figure 4. Imaging mass spectrometry of the whole mouse pups.
(A) H & E staining; (B) comparison between matrix without detergent and with 0.05% SDS added; (C) comparison between matrix without detergent and with 0.05% Triton X-100 added. Ion images show an increased intensity of some of the protein signals detected in the whole mouse experiment. In the case of peaks at m/z 4554, 11 083 and 10 165, the signal intensity is improved in a specific organ region. In the other cases, there is a broad increase in sensitivity in multiple regions for the selected proteins.
CONCLUSIONS
The use of detergents can produce significant signal enhancement to analytes within the range m/z 4–40 000. Over a range of detergent types, we found that most of the selected detergents did not cause a significant suppression of signal for on-tissue analysis, nor it did produce interfering signals. Adding detergents into the matrix was comparable with separately spotting the detergent prior to application of matrix, demonstrating that detergents may be applied simultaneously with matrix application during manual spraying or robotic spotting. On liver tissue, we found that the different detergents required different concentrations for optimal spectral quality. MALDI MS spectra from thin tissue sections of specific organs were optimized through careful selection of detergent type. Overall, this study demonstrates a significant advantage in the use of detergents for investigations using MALDI IMS.
Acknowledgments
V.M. was supported by FIRB n. RBRN07BMCT-011 of the Italian Ministry of Research. P.M. A. was supported by an Interdisciplinary Postdoctoral Fellowship through the Systems-based Consortium for Organ Design and Engineering (5RL1 HL092551-02). Funding for research was provided by NIH Grant No. 1-UL1-RR024920-01.
References
- 1.Cornett DS, Reyzer ML, Chaurand P, Caprioli RM. Nat Methods. 2007;4:828. doi: 10.1038/nmeth1094. [DOI] [PubMed] [Google Scholar]
- 2.Herring KD, Oppenheimer SR, Caprioli RM. Semin Nephrol. 2007;27:597. doi: 10.1016/j.semnephrol.2007.09.002. [DOI] [PMC free article] [PubMed] [Google Scholar]
- 3.Hardesty WM, Caprioli RM. Anal Bioanal Chem. 2008;391:899. doi: 10.1007/s00216-008-1972-5. [DOI] [PMC free article] [PubMed] [Google Scholar]
- 4.Grey AC, Chaurand P, Caprioli RM, Schey KL. J Proteome Res. 2009;8:3278. doi: 10.1021/pr800956y. [DOI] [PMC free article] [PubMed] [Google Scholar]
- 5.Burnum KE, Tranguch S, Mi D, Daikoku T, Dey SK, Caprioli RM. Endocrinology. 2008;149:3274. doi: 10.1210/en.2008-0309. [DOI] [PMC free article] [PubMed] [Google Scholar]
- 6.Schwartz SA, Reyzer ML, Caprioli RM. J Mass Spectrom. 2003;38:699. doi: 10.1002/jms.505. [DOI] [PubMed] [Google Scholar]
- 7.Sugiura Y, Shimma S, Setou M. J Mass Spectrom Soc Jpn. 2006;54:45. [Google Scholar]
- 8.Seeley EH, Oppenheimer SR, Mi D, Chaurand P, Caprioli RM. J Am Soc Mass Spectrom. 2008;19:1069. doi: 10.1016/j.jasms.2008.03.016. [DOI] [PMC free article] [PubMed] [Google Scholar]
- 9.Cohen SL, Chait BT. Anal Chem. 1996;68:31. doi: 10.1021/ac9507956. [DOI] [PubMed] [Google Scholar]
- 10.Xiang F, Beavis RC. Org Mass Spectrom. 1993;28:1424. [Google Scholar]
- 11.Rosinke B, Strupat K, Hillenkamp F, Rosenbush J, Dencher N, Kruger U, Galla HJ. J Mass Spectrom. 1995;30:1462. [Google Scholar]
- 12.Bornsen OK, Gass MAS, Bruin GJM, Adrichem JHM, Biro MC, Kresbach GM, Ehrat M. Rapid Commun Mass Spectrom. 1997;11:603. doi: 10.1002/(SICI)1097-0231(199704)11:6<603::AID-RCM879>3.0.CO;2-U. [DOI] [PubMed] [Google Scholar]
- 13.Amado FML, Santana-Marques M, Ferrer-Correia AJ, Tomer KB. Anal Chem. 1997;69:1102. [Google Scholar]
- 14.Cadene M, Chait BT. Anal Chem. 2000;72:5655. doi: 10.1021/ac000811l. [DOI] [PubMed] [Google Scholar]
- 15.Breaux GA, Green-Church KB, France A, Limbach PA. Anal Chem. 2000;72:1169. doi: 10.1021/ac9907282. [DOI] [PubMed] [Google Scholar]
- 16.Leinweber BD, Tsaprailis G, Monks TJ, Lau SS. J Am Soc Mass Spectrom. 2009;20:89. doi: 10.1016/j.jasms.2008.09.008. [DOI] [PMC free article] [PubMed] [Google Scholar]


