

Abstract
While osteoporosis is known to alter bone tissue composition, the effects of such compositional changes on tissue material properties have not yet been examined. The natural gradient in tissue mineral content arising from skeletal appositional growth provides a basic model for investigation of relationships between tissue composition and mechanical properties. The purpose of this study was to examine the effects of tissue age on bone tissue composition and nanomechanical properties. The nanomechanical properties and composition of regions of differing tissue age were characterized in the femoral cortices of growing rats using nanoindentation and Raman spectroscopy. In addition, spatial maps of the properties of periosteal tissue were examined to investigate in detail the spatial gradients in the properties of newly formed tissue. Newly formed tissue (0–4 d) was 84% less stiff and had 79% lower mineral:matrix ratio than older intracortical (15–70 d) tissue. Tissue modulus, hardness, mineral:matrix ratio, and carbonate:phosphate ratio increased sharply with distance from the periosteum and attained the modulus and mineral content of intracortical tissue within four days of formation. The mineral:matrix ratio explained 54% and 62% of the variation in tissue indentation modulus and hardness, respectively. Our data demonstrate significant variations in tissue mechanical properties with tissue age and relate mechanical properties to composition at the microscale.
Keywords: bone mineralization, mechanical properties, nanoindentation, Raman spectroscopy, rat
INTRODUCTION
Skeletal fracture resistance depends on bone mass, geometry, and tissue material properties. While osteoporosis has long been associated with low bone mass,1 this pathology has more recently been shown not only to reduce bone quantity but also to alter tissue distribution and composition.2,3 The osteoporosis treatment paradox highlights the potential importance of tissue material properties to fracture resistance. Antiresorptive treatments reduce fracture risk by 30–50% while increasing bone mineral density (BMD) by 0–8%.4–6 These modest increases in BMD are insufficient to explain the substantial decrease in fracture risk; thus, other factors must also contribute to fracture risk.4–6 Improved tissue “quality” may be a key factor in the efficacy of these therapies.
Nanoscale heterogeneity of bone tissue properties has emerged as a key aspect of bone quality associated with fracture resistance. Regions of varying elastic modulus are known to hinder crack propagation and toughen bone tissue on the nanoscale.7,8 Healthy bone is also compositionally heterogeneous and possesses a characteristic bone mineral density distribution (BMDD).9 Postmenopausal osteoporosis slightly broadens and reduces the mean of the BMDD of iliac crest biopsies, while bisphosphonate treatment largely reverses these effects, bringing the BMDD of osteoporotic bone closer to that of healthy bone.10–12 Recent Fourier transform infrared (FTIR) spectroscopic studies have also demonstrated that osteoporosis alters the mean and the distribution of bone tissue properties such as mineral:matrix ratio, mineral crystallinity, and matrix maturity.3,13–15 Paralleling the results of the BMDD studies,10–12 alendronate treatment of osteoporotic tissue increased the mean and sharpened the distribution of the mineral:matrix ratio assessed by IR spectroscopy.16 These changes in tissue composition are expected to change the properties of the tissue at the material level.
Bone tissue microstructure comprises molecular constituents such as collagen, mineral, and noncollagenous proteins, as well as micro-scale features such as lamellae. The arrangement of and interactions among of these microstructural constituents determine tissue material properties. However, changes in tissue composition have not been related directly to changes in tissue material properties or whole-bone behavior.
Investigation of microstructure-property relationships in bone tissue will improve our current understanding of normal and pathological bone function and may lead to development of improved therapies for bone diseases. While the relationship between bulk bone composition and mechanical properties has been characterized extensively,17–20 information about microstructure-property relationships at the level of the constituent material is just beginning to emerge. To date, tissue material composition and nanomechanical properties have primarily been examined independently.3,15,21–24 However, a number of recent investigations of relationships between these factors have demonstrated systematic variations in bone tissue nanomechanical properties and composition in both normal and diseased tissue.25–29
Here we examine microstructure-property relationships in bone tissue material at the micro- to nanoscale. The natural gradient in tissue mineral content arising from skeletal appositional growth provides a basic model in which relationships between tissue composition and mechanical properties can be established. The purpose of this study was to examine the effects of tissue age on bone tissue material composition and nanomechanical properties. We hypothesized that the nanoscale tissue modulus and hardness of bone material would vary with local differences in tissue mineral content arising from differing tissue ages. In particular, older, highly mineralized tissue was expected to be stiffer and harder than younger, less mineralized tissue, as characterized by nanoindentation and Raman spectroscopy.
MATERIALS AND METHODS
Study Design
To understand the effect of variations in mineral content on bone tissue nanomechanical properties, tissue of different ages was examined in the femoral cortices of growing rats. In the rat, the majority of appositional growth occurs at the periosteal surface, with newly formed tissue at the periosteum and older tissue in the interior of the cortex.30 Therefore, this model was selected for two key attributes: 1) the large volume of tissue formed in a rapidly growing animal, ensuring sufficient tissue of various ages for microscale characterization and 2) the monotonic increase in tissue age and mineral content produced in a cortex that grows appositionally without remodeling,30 allowing straightforward analysis of tissue of varying ages within each animal.25 The rate of tissue mineralization varies with time, from the initial rapid primary mineralization phase to the longer and more gradual secondary mineralization phase; therefore, the tissue mineral content increases nonuniformly but monotonically with time.
Variation in tissue properties with tissue age was analyzed over two length scales: across the entire cortex and within the newly formed tissue at the periosteum. Differences in tissue composition and mechanical properties throughout the entire cortex were examined first. Then, the property gradients within the newly formed tissue at the periosteum were characterized in detail. Raman microspectroscopy and nanoindentation were used to measure tissue composition and mechanical properties, respectively.
Sample Preparation
Four 42-day-old male Sprague-Dawley rats were administered fluorochrome labels over a 28-day experimental period. Demeclocycline, calcein, and demeclocycline (Sigma-Aldrich) labels were administered IP (15 mg/kg) at 28, 14, and 4 days, respectively, before euthanasia by CO2 inhalation. This protocol was approved by the Cornell University Institutional Animal Care and Use Committee. The right femora were then harvested and prepared for mechanical and compositional characterization. Femora were dehydrated in absolute ethanol and propylene oxide, and embedded in Spurr’s resin. One 3-mm-thick transverse section was cut from the mid-diaphysis of each femur with a low-speed diamond saw and mounted on an atomic force microscope (AFM) stub. All specimens were polished anhydrously through a series of graded SiC and Al2O3 abrasives, as described previously,31 to avoid demineralization and mineral solid phase transformations.32,33 Likewise, specimens were not rehydrated prior to testing to avoid demineralization and solid phase transformations that occur in bone tissue exposed to aqueous solutions.32,33 The final root mean square (RMS) roughness of the specimen surfaces was ~10 nm, as assessed by several 5 × 5-μm2 contact AFM scans.
Compositional Characterization
Raman spectroscopy was used to characterize tissue composition. Spectra over the range 800–1800 cm−1 were collected using a Raman microprobe (Renishaw, Inc.) with a 785-nm laser (Renishaw, Inc.) and a 50×, 0.75 numerical aperture objective (Zeiss), producing a beam with a diameter of ~1 μm at the specimen surface. Baseline corrections were made to all peaks before calculation of peak heights of the phosphate (959 cm−1), carbonate (1070 cm−1), and amide I (1675 cm−1) bands. Ratios of the peak heights of the phosphate/amide I bands were calculated to give the mineral:matrix ratio, a measure of the extent of mineralization of the collagen matrix, and the carbonate/phosphate peak height ratios were calculated to give the carbonate:phosphate ratio (CO3:PO4), an indicator of the extent of carbonate substitution in the mineral lattice.
In the first set of experiments examining the variation in tissue composition across the entire cortex, four regions of tissue in the antero-lateral cortex were examined. These regions, demarcated by the fluorochrome labels, corresponded to tissue ages of 0–4, 5–14, 15–28, and 29–70 d (Figure 1a,b). For each sample, five spectra were collected near the center of each of the four regions within the cortex, along a line parallel to the periosteum (Figure 1b). The spacing between the five points at which the spectra were collected was ~3 μm. For each spectrum, three cosmic-ray-corrected, 10-s exposures were acquired and averaged.
Figure 1.
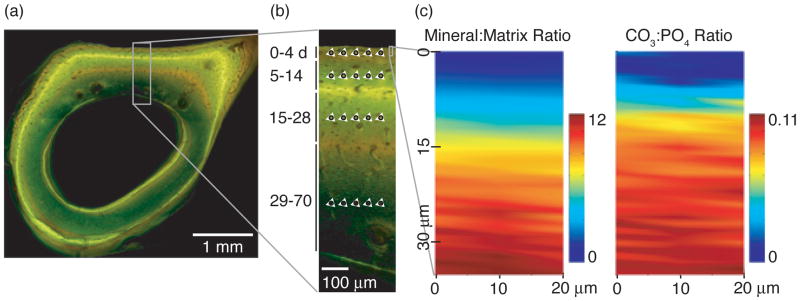
(a) A combined fluorescence and brightfield image of a femoral mid-diaphyseal cross-section. The demeclocycline labels appear orange, and the calcein label appears green. The rectangle indicates the cortical analysis region shown at higher magnification in (b). (b) Schematic of analysis region in posterior cortex. Black circles and white triangles indicate Raman spectra collection points and nanoindentation locations, respectively, in each of the four tissue age regions. The small rectangle near the top right of the micrograph indicates the periosteal analysis area characterized by detailed Raman mapping and nanoindentation experiments. (c) Typical spatial maps of mineral:matrix ratio and carbonate:phosphate ratio in the periosteal analysis area.
A second set of spectroscopic measurements was made to examine the gradient in tissue composition within the 0–4-day-old tissue at the periosteum. In each sample, detailed compositional characterization using Raman “mapping” was performed on a 20 × 60-μm2 (x × y) area near the periosteal edge, adjacent to but not encompassing the site where the five individual spectra had been collected previously (Figure 1b). In each area, Raman spectra were collected in a grid with 10- and 1-μm steps in the x- and y-directions, which were parallel and perpendicular to the periosteal edge, respectively. The grid was centered at a y-position 5 μm from the periosteum. Two 10-s exposures were acquired at each x-y position, with a total acquisition time of ~5 h per map. Analysis locations for all Raman spectroscopy experiments were recorded on high-magnification (100×) optical micrographs.
Nanomechanical Characterization
Nanoindentation was used to measure the mechanical properties of the tissue in the same regions previously characterized by Raman spectroscopy. A scanning nanoindenter (Hysitron, Inc.) was employed to image the sample topography and obtain force-displacement data. The analysis locations recorded in optical micrographs from the Raman microprobe were identified in the optical objective of the nanoindenter. Fiducial markers such as lacunae, which were visible both in optical micrographs and in scanning nanoindenter AFM topography scans, were used to place the indenter tip in the same locations that were characterized previously with Raman spectroscopy. The Berkovich indenter was loaded into the sample at 50 μN/s, held at a load of 500 μN for 10 s, and unloaded at 50 μN/s, producing indentations with contact depths hc ranging from 50 to 250 nm. These indentations were sufficiently small to distinguish local differences in tissue properties but sufficiently deep to minimize the contribution of surface roughness artifacts to the measured mechanical properties.31 The indentation modulus E and hardness H were calculated from the load-displacement curves using the Oliver-Pharr method.34
In the first set of experiments examining property variations over the entire cortex, in each sample five indentations were made were made near the center of each of the four tissue age regions. Indentations were made along the same line parallel to the periosteum along which Raman spectra were collected (Figure 1b). The spacing between indentations was ~3 μm to avoid overlap of the plastically deformed regions of neighboring indentations.22,35,36
In the second set of experiments examining property gradients at the periosteal edge, eight indentations were made along each of two lines perpendicular to the periosteal edge. The lines of indentations were made within the 0–4-day-old tissue at the periosteum previously characterized with Raman mapping (Figure 1b, c). The spacing between lines was ~10 μm, and the spacing between indentations was ~3 μm. Because the embedding resin is quite smooth (RMS roughness < 1 μm), and the osteoid at the edge of the cortex is relatively rough (RMS roughness ~ 30 μm), the edge of the bone specimen is topologically distinct from the resin and easily identifiable in the scanning nanoindenter AFM topography scans. The deformed volume beneath the indenter tip has a radius of ~3.5hc,22,35,36 corresponding to ~70–875 nm for the values of hc observed here. The first indentation was placed a minimum of 2 μm from the specimen edge to avoid sampling the embedding resin (E ~3 GPa).
Data Analysis
Nonparametric statistical analyses were used to examine the compostional and nanomechanical properties. For the compositional and nanomechanical data characterizing the entire cortex, the five values of mineral:matrix ratio, carbonate:phosphate ratio, indentation modulus, and hardness measured within each tissue age region were averaged to obtain a mean property value for each region. Friedman’s two-way analysis of variance (ANOVA) (Statview, SAS), a nonparametric equivalent of a repeated-measures ANOVA,37 was performed on the mean mineral:matrix ratio, carbonate:phosphate ratio, indentation modulus, and hardness for each of the four regions sampled in each specimen. A nonparametric post-hoc test was used for multiple comparisons between tissue ages.37,38 For all analyses p < 0.05 was considered significant.
For the Raman mapping data, the three compositional values at a given distance from the periosteum were averaged to obtain mean property values as a function of distance from the periosteal edge. The periosteal edge was defined as the first location at which the phosphate peak had a signal-to-noise ratio of 10. Raman spectra and nanoindentation force-displacement curves collected from locations that did not meet this criterion were discarded to ensure that only mineralized tissue was analyzed.39
Linear regressions (Statview, SAS) were used to examine relationships between compositional and mechanical parameters. The data from the whole-cortex and periosteal analyses were combined for the regression analyses. The whole-cortex analyses comprised nanomechanical and compositional measurements in identical locations, producing paired data points. In contrast, the periosteal analyses comprised Raman measurements made at 1-μm intervals and nanoindentation measurements made at 3-μm intervals; therefore, each nanoindentation measurement was matched with the closest Raman measurement, based on distance from the periosteal edge. This pooled data set was used only for the regression analysis, to maximize the number of intermediate values of mechanical and compositional parameters.
RESULTS
When the variation in tissue properties across the antero-lateral cortex was examined, the youngest tissue had a lower mineral content and CO3:PO4 ratio than the older tissue. The 0–4-day-old tissue had a significantly lower mineral:matrix ratio (−79%) and CO3:PO4 ratio (−63%) than the 29–70-day-old and the 15–28-day-old tissue, respectively (Figure 2a,b). The mineral:matrix and CO3:PO4 ratios of the three older tissue age groups (5–70 d) were not significantly different, approximately 14:1 and 0.11:1, respectively.
Figure 2.
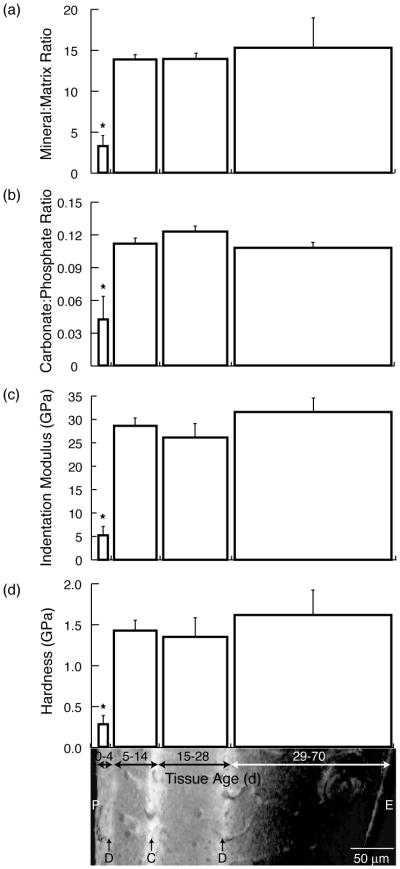
Mean (a) mineral:matrix ratio, (b) carbonate:phosphate ratio, (c) indentation modulus, and (d) hardness vs. tissue age superimposed on a combined optical and fluorescence micrograph of a cortical region showing the periosteal edge (P) and the endosteal edge (E) as well as the demeclocycline labels (D) and calcein label (C). The widths of the bars on the plot are scaled with the width of the corresponding tissue shown in the micrograph. Error bars indicate standard deviations. The overall effect of tissue age was significant for all properties examined (p < 0.05 by Friedman’s two-way ANOVA), and multiple comparison (α =0.05) showed significant differences vs. 29–70 d (*), and 15–28 d (**).
The variation in the mechanical properties paralleled that of the compositional parameters. The youngest tissue (0–4 d) was significantly less stiff (−84%) and hard (−83%) than the oldest tissue (29–70 d), while the indentation moduli and hardnesses of the three older tissue age groups (5–70 d) were not significantly different (Figure 2c,d). The 0–4-day-old tissue had an indentation modulus of ~5 GPa, compared to ~30 GPa for the older, 5–70-day-old tissue (Figure 2c). The hardness data showed analogous trends, with hardness values of ~0.3 GPa for the 0–4-day-old tissue and ~1.5 GPa for the older 5–70-day-old tissue (Figure 2d).
When the gradient in tissue properties within the 0–4-day-old tissue at the periosteum was examined, the mineral:matrix and carbonate:phosphate ratios increased with radial distance from the periosteal edge (Figure 1a,b, Figure 3a, b). Mineral:matrix ratio increased sharply with distance from the periosteum for the first 15–25 μm and increased somewhat more gradually thereafter. Similar initial rates of increase in mineral:matrix ratio, approximately 0.8 μm−1, were observed for all specimens (Figure 3a). The gradients in carbonate:phosphate ratio exhibited greater variability across samples (Figure 3b).
Figure 3.

Mean values vs. distance from periosteal edge for (a) mineral:matrix ratio, (b) carbonate:phosphate ratio, (c) indentation modulus, and (d) hardness.
Similar to the mineral:matrix and carbonate:phosphate ratios, the tissue modulus increased with radial distance from the periosteum, with a spatial gradient of approximately 1–2 GPa/μm (Figure 3c); similar trends were observed for hardness (Figure 3d). The tissue 1.2–5 μm from the periosteal edge had an indentation modulus and hardness of approximately 5 GPa and 0.25 GPa, respectively. The mechanical properties of the tissue 15–25 μm from the periosteum were more variable, with a modulus range of 5–35 GPa and a hardness range of 0.25–1.60 GPa.
When relationships between nanomechanical and compositional variables were examined, indentation modulus E and hardness H correlated moderately well with mineral:matrix ratio (E: r2=0.54, p<0.001; H: r2=0.62, p<0.001) and somewhat less strongly with carbonate:phosphate ratio (E: r2=0.36, p<0.001; H: r2=0.40, p<0.001) (Figure 4).
Figure 4.

Correlations between nanomechanical and compositional properties: (a) indentation modulus vs. mineral:matrix ratio, (b) hardness vs. mineral:matrix ratio, (c) indentation modulus vs. carbonate:phosphate ratio, and (d) hardness vs. carbonate:phosphate ratio. Solid lines show best fit linear regressions (p<0.001).
DISCUSSION
As hypothesized, local tissue modulus and hardness varied systematically with tissue composition. The values of the compositional parameters and mechanical properties examined in this study increased similarly with tissue age. When the entire cortex was examined, the mineral:matrix and CO3:PO4 ratios of the regions of tissue older than 4 days were similar, whereas the youngest tissue had a 79% lower mineral:matrix ratio and 63% lower CO3:PO4 ratio than the 29–70-day-old and the 15–28-day-old tissue, respectively. Similarly, the indentation modulus and hardness of the regions of tissue older than 4 days were similar, while the youngest tissue was 84% less stiff and 83% less hard than the oldest (29–70 d) tissue. Thus, all measured tissue properties increased rapidly in the first several days of bone formation and thereafter increased only slightly through 70 days of age in the growing rat.
Our detailed characterization of the chemical and mechanical properties of the newly formed tissue near the periosteal edge was essential to detecting these rapid initial changes in tissue composition and mechanical properties. The tissue 20 μm from the periosteum attained 50–100% of the mineral:matrix ratio, CO3:PO4 ratio, modulus, and hardness of the older intracortical tissue. Thus, not only did tissue mineral content increase quickly, as expected, but the extent of carbonate substitution into the mineral lattice likewise increased with age, although the values of the CO3:PO4 ratio were somewhat more variable than those for mineral:matrix ratio. Similar increases were observed in modulus and hardness, indicating that the bone tissue’s intrinsic resistance to both elastic and plastic deformation also increased sharply in the first days of new bone formation.40 The presence of these steep property gradients was evident from prior studies,25 and our combination of spatial and temporal parameters allowed them to be characterized.
The mineral:matrix ratio increased with tissue age in parallel with indentation modulus and hardness. The mineral:matrix ratio explained 54% and 62%, respectively, of the variation in indentation modulus and hardness. The correlation between mineral:matrix ratio and indentation modulus is similar to that observed in a previous study showing that 59% of the variation in elastic modulus was explained by FTIR mineral:matrix ratio.29 Carbonate:phosphate ratio was less predictive of indentation modulus and hardness, explaining 36% and 40% of the variation, respectively. The trends in these nanomechanical properties with carbonate:phosphate ratio appeared less linear than those observed with mineral:matrix ratio, and other types of functional forms (polynomial, exponential) did not improve the fit. Nonetheless, the relationships between composition and mechanical properties reported at the bulk level 18–20,41 also appear to extend to the material level.
In the newly formed tissue closest to the periosteum, tissue mineral content tended to increase more rapidly than modulus and hardness, suggesting that other microstructural factors also contribute to tissue mechanical properties. Woven bone was observed exclusively throughout the femoral cortices of rats the same age as those used in the current study (70 d), using second harmonic generation microscopy to characterize the extent of collagen organization in the tissue [unpublished observation]. Thus, the observed differences in mechanical properties were likely not attributable to systematic variations in collagen orientation. A variety of other factors, including mineral crystal size, composition, and orientation, as well as noncollagenous matrix proteins may also influence local tissue material properties.26,42–44
To relate tissue compositional and mechanical properties, we chose an animal model with the intent of producing a wide range of properties over which to examine these relationships. Local variations in tissue composition with tissue age have also been examined in a murine calvarial model39 and in rat25 and murine29 tibial models. In our study, tissue mineral:matrix ratio and carbonate:phosphate ratio both increased 5-fold over a tissue age range from 0–4 d to 5–70 d. In a murine calvarial model, the mineral:matrix ratio and carbonate:phosphate ratio increased 11-fold and 1.5-fold, respectively, from the fetal period to 6 months of age.39 In the tibial models, the range of tissue compositional properties was smaller than ours. In the mouse tibia, the mineral:matrix ratio of 40-day-old tissue was only 50% greater than that of 1-day-old tissue,29 while in the rat tibia, the mineral:matrix ratio of 22–70-day-old tissue was 30% greater than that of 2–6-day-old tissue.25 While the developing murine calvaria exhibited the greatest reported range of tissue compositional properties, the small size of the fetal and postnatal murine skeleton may complicate mechanical characterization. A number of factors, such as anatomic location, species, age, and sex, can affect tissue composition and mechanical properties.45–47 Investigation of other genotypes, anatomic sites, or species, such as a recent study of baboon osteonal properties as a function of tissue age,48 may provide an improved model system for correlation of these properties.
Our results are in agreement with previous measurements of local composition in bone tissue of growing rodents. The mineral:matrix ratios of the older intracortical tissue examined in this study (5–70 d) correspond closely to the FTIR mineral:matrix ratios measured in intracortical tissue (10–70 d) in rat tibiae.25 The range of mineral:matrix ratios observed here also correspond closely to those assessed by FTIR spectroscopy in the cortices of tibiae from mice ranging in age from 1 to 450 days.29 The mineral:matrix ratio of the youngest tissue examined in the current study (0–4 d) is comparable to that of 1–7-day-old murine calvarial tissue.39 The corresponding values of carbonate:phosphate ratio measured in the current study are somewhat lower than the murine calvarial values,39 which reflects less carbonate substitution in the mineral lattice, perhaps due to a relative deficiency of carbonate ions in the local mineral environment, or, alternatively, increased phosphate content of the matrix.48
The observed rapid increase in tissue properties is also consistent with previous mineralization studies of rat long bones. A density fractionation study of homogenized bone from 84-day-old rat femora found the tissue to be highly mineralized, with only 15% of the tissue having a density less than 80% of the maximum.49 In a study of 70-day-old female rat tibiae similar to the current one, newly formed bone attained intracortical mechanical and compositional properties within 10 days of formation.25 However, in contrast to our findings, the modulus of the youngest tissue age examined (2–6 d) was not significantly different from that of the older intracortical tissue (10–70 d). The mineral:matrix ratio of the youngest tissue was ~20% lower than that of the intracortical tissue. Finally, electron microprobe analysis of local bone formation demonstrated that tissue density and Ca:P ratio increased rapidly during the initial hours of mineralization, reaching 90% maximum possible mineral density within 4–5 days.50 Thus, primary mineralization occurring over the first several days of bone formation provides sufficient mineral to achieve the mechanical properties of intracortical tissue in the rat cortex.
Precise differentiation of local tissue properties in this study was enabled by mechanical and compositional techniques with resolution ~1 μm. Although the sample size used in this study is relatively small, significant differences were detected in mechanical properties and compositional parameters as a function of tissue age. Tissue properties were measured in dehydrated tissue, and the absolute values of indentation modulus and hardness are likely elevated relative to hydrated or in vivo values. The indentation modulus of dehydrated bone tissue has been reported to be 10–75% greater than that of hydrated tissue.22,36,51 However, dehydration and embedding were essential to achieving the low sample surface roughness necessary for making sub-micron-sized indentations capable of detecting local differences in material properties.
In this study, relationships between tissue composition and mechanical properties were investigated with a growing rat model. The growing rat cortex rapidly forms large quantities of tissue, and tissue age determination is facilitated by the lack of intracortical remodeling. Our data demonstrate significant variations in tissue-level nanomechanical properties with tissue age. Future investigation of tissue from aged animals as well as tissue that undergoes intracortical remodeling48 will help to determine whether these relationships persist in elderly individuals and in remodeled tissue. Newly formed tissue is characterized by considerably reduced mineral content, stiffness, and hardness. Because very young tissue possesses reduced intrinsic resistance to both elastic and plastic deformation, high turnover disease states producing large volumes of very soft and compliant tissue may contribute to skeletal fragility. Combined analyses of tissue material properties, along with microarchitecture and bone mass, may help to provide a more complete picture of the origins of skeletal fragility in pathologic tissue.
Acknowledgments
This work was supported in part by the Cornell Center for Materials Research (CCMR) with funding from the National Science Foundation (DMR 0520404). Particular acknowledgment is made of the use of the Molecular and Cellular Surface Imaging Facility of CCMR. In addition, the authors acknowledge support from NIH (R01-AR053571, P30-AR046121, R01-AR043125), and the American Association of University Women Educational Foundation (Selected Professions Fellowship). We thank Dr. Stephen Doty for tissue preparation, Dr. Stephen Schwager for assistance with statistical analyses, Dr. Junghyun Cho and Andy Zhang for assistance with nanoindentation data collection, Dr. Christopher Umbach for assistance with Raman spectroscopy, and Bryan Richey for assistance with sample preparation.
References
- 1.Cummings SR, Melton LJ. Epidemiology and outcomes of osteoporotic fractures. Lancet. 2002;359(9319):1761–7. doi: 10.1016/S0140-6736(02)08657-9. [DOI] [PubMed] [Google Scholar]
- 2.Laib A, Kumer JL, Majumdar S, Lane NE. The temporal changes of trabecular architecture in ovariectomized rats assessed by MicroCT. Osteoporosis International. 2001;12(11):936–41. doi: 10.1007/s001980170022. [DOI] [PubMed] [Google Scholar]
- 3.Paschalis EP, Betts F, DiCarlo E, Mendelsohn R, Boskey AL. FTIR microspectroscopic analysis of human iliac crest biopsies from untreated osteoporotic bone. Calcified Tissue International. 1997;61(6):487–92. doi: 10.1007/s002239900372. [DOI] [PubMed] [Google Scholar]
- 4.Cummings SR, Karpf DB, Harris F, Genant HK, Ensrud K, LaCroix AZ, Black DM. Improvement in spine bone density and reduction in risk of vertebral fractures during treatment with antiresorptive drugs. Am J Med. 2002;112(4):281–9. doi: 10.1016/s0002-9343(01)01124-x. [DOI] [PubMed] [Google Scholar]
- 5.Ettinger B, Black DM, Mitlak BH, Knickerbocker RK, Nickelsen T, Genant HK, Christiansen C, Delmas PD, Zanchetta JR, Stakkestad J, et al. Reduction of vertebral fracture risk in postmenopausal women with osteoporosis treated with raloxifene: results from a 3-year randomized clinical trial. Multiple Outcomes of Raloxifene Evaluation (MORE) Investigators. Journal of the American Medical Association. 1999;282(7):637–45. doi: 10.1001/jama.282.7.637. [DOI] [PubMed] [Google Scholar]
- 6.Liberman UA, Weiss SR, Broll J, Minne HW, Quan H, Bell NH, Rodriguez-Portales J, Downs RW, Jr, Dequeker J, Favus M. Effect of oral alendronate on bone mineral density and the incidence of fractures in postmenopausal osteoporosis. The Alendronate Phase III Osteoporosis Treatment Study Group. N Engl J Med. 1995;333(22):1437–43. doi: 10.1056/NEJM199511303332201. [DOI] [PubMed] [Google Scholar]
- 7.Tai K, Dao M, Suresh S, Palazoglu A, Ortiz C. Nanoscale heterogeneity promotes energy dissipation in bone. Nat Mater. 2007;6(6):454–62. doi: 10.1038/nmat1911. [DOI] [PubMed] [Google Scholar]
- 8.Fratzl P, Gupta HS, Fischer FD, Kolednik O. Hindered crack propagation in materials with periodically varying Young’s modulus--Lessons from biological materials. Adv Mater. 2007;19:2657–2661. [Google Scholar]
- 9.Roschger P, Gupta HS, Berzlanovich A, Ittner G, Dempster DW, Fratzl P, Cosman F, Parisien M, Lindsay R, Nieves JW, et al. Constant mineralization density distribution in cancellous human bone. Bone. 2003;32(3):316–23. doi: 10.1016/s8756-3282(02)00973-0. [DOI] [PubMed] [Google Scholar]
- 10.Roschger P, Paschalis EP, Fratzl P, Klaushofer K. Bone mineralization density distribution in health and disease. Bone. 2007 doi: 10.1016/j.bone.2007.10.021. [DOI] [PubMed] [Google Scholar]
- 11.Boivin GY, Chavassieux PM, Santora AC, Yates J, Meunier PJ. Alendronate increases bone strength by increasing the mean degree of mineralization of bone tissue in osteoporotic women. Bone. 2000;27(5):687–94. doi: 10.1016/s8756-3282(00)00376-8. [DOI] [PubMed] [Google Scholar]
- 12.Nuzzo S, Lafage-Proust MH, Martin-Badosa E, Boivin G, Thomas T, Alexandre C, Peyrin F. Synchrotron radiation microtomography allows the analysis of three-dimensional microarchitecture and degree of mineralization of human iliac crest biopsy specimens: effects of etidronate treatment. J Bone Miner Res. 2002;17(8):1372–82. doi: 10.1359/jbmr.2002.17.8.1372. [DOI] [PubMed] [Google Scholar]
- 13.Boskey A, Mendelsohn R. Infrared analysis of bone in health and disease. J Biomed Opt. 2005;10(3):031102. doi: 10.1117/1.1922927. [DOI] [PubMed] [Google Scholar]
- 14.Faibish D, Ott SM, Boskey AL. Mineral changes in osteoporosis: a review. Clin Orthop Relat Res. 2006;443:28–38. doi: 10.1097/01.blo.0000200241.14684.4e. [DOI] [PMC free article] [PubMed] [Google Scholar]
- 15.Gadeleta SJ, Boskey AL, Paschalis E, Carlson C, Menschik F, Baldini T, Peterson M, Rimnac CM. A physical, chemical, and mechanical study of lumbar vertebrae from normal, ovariectomized, and nandrolone decanoate-treated cynomolgus monkeys (Macaca fascicularis) Bone. 2000;27(4):541–50. doi: 10.1016/s8756-3282(00)00362-8. [DOI] [PubMed] [Google Scholar]
- 16.Boskey A, Spevak M, Weinstein RS. Transiliac bone biopsies of postmenopausal women treated with alendraonate show increased cotical bone mineral content but no other improvement in spectroscopic markers of “bone quality”: a pilot study. Trans Orthop Res Soc. 2007;32:1414. [Google Scholar]
- 17.Burstein AH, Zika JM, Heiple KG, Klein L. Contribution of collagen and mineral to the elastic-plastic properties of bone. J Bone Joint Surg Am. 1975;57(7):956–61. [PubMed] [Google Scholar]
- 18.Currey JD. The relationship between the stiffness and the mineral content of bone. J Biomech. 1969;2(4):477–80. doi: 10.1016/0021-9290(69)90023-2. [DOI] [PubMed] [Google Scholar]
- 19.Currey JD. The mechanical consequences of variation in the mineral content of bone. J Biomech. 1969;2(1):1–11. doi: 10.1016/0021-9290(69)90036-0. [DOI] [PubMed] [Google Scholar]
- 20.Currey JD. The effect of porosity and mineral content on the Young’s modulus of elasticity of compact bone. J Biomech. 1988;21(2):131–9. doi: 10.1016/0021-9290(88)90006-1. [DOI] [PubMed] [Google Scholar]
- 21.Guo XE, Goldstein SA. Vertebral trabecular bone microscopic tissue elastic modulus and hardness do not change in ovariectomized rats. Journal of Orthopaedic Research. 2000;18:333–336. doi: 10.1002/jor.1100180224. [DOI] [PubMed] [Google Scholar]
- 22.Hengsberger S, Kulik A, Zysset P. Nanoindentation discriminates the elastic properties of individual human bone lamellae under dry and physiological conditions. Bone. 2002;30:178–184. doi: 10.1016/s8756-3282(01)00624-x. [DOI] [PubMed] [Google Scholar]
- 23.Rho J-Y, Zioupos P, Currey JD, Pharr GM. Variations in the individual thick lamellar properties within osteons by nanoindentation. Bone. 1999;25:295–300. doi: 10.1016/s8756-3282(99)00163-5. [DOI] [PubMed] [Google Scholar]
- 24.Kazanci M, Roschger P, Paschalis EP, Klaushofer K, Fratzl P. Bone osteonal tissues by Raman spectral mapping: orientation-composition. J Struct Biol. 2006;156(3):489–96. doi: 10.1016/j.jsb.2006.06.011. [DOI] [PubMed] [Google Scholar]
- 25.Busa B, Miller LM, Rubin CT, Qin YX, Judex S. Rapid establishment of chemical and mechanical properties during lamellar bone formation. Calcified Tissue International. 2005;77(6):386–94. doi: 10.1007/s00223-005-0148-y. [DOI] [PubMed] [Google Scholar]
- 26.Donnelly E, Williams RM, Downs SA, Dickinson ME, Baker SP, van der Meulen MCH. Quasistatic and dynamic nanomechanical properties of cancellous bone tissue relate to collagen content and organization. Journal of Materials Research. 2006;21:2106–2117. [Google Scholar]
- 27.Lane NE, Yao W, Balooch M, Nalla RK, Balooch G, Habelitz S, Kinney JH, Bonewald LF. Glucocorticoid-treated mice have localized changes in trabecular bone material properties and osteocyte lacunar size that are not observed in placebo-treated or estrogen-deficient mice. J Bone Miner Res. 2006;21(3):466–76. doi: 10.1359/JBMR.051103. [DOI] [PMC free article] [PubMed] [Google Scholar]
- 28.Gupta HS, Stachewicz U, Wagermaier W, Roschger P, Wagner HD, Fratzl P. Mechanical moduluation at the lamellar level in osteonal Bone. J Mater Res. 2006;21(8):1913–1921. [Google Scholar]
- 29.Miller LM, Little W, Schirmer A, Sheik F, Busa B, Judex S. Accretion of bone quantity and quality in the developing mouse skeleton. J Bone Miner Res. 2007;22(7):1037–45. doi: 10.1359/jbmr.070402. [DOI] [PubMed] [Google Scholar]
- 30.Frost HM, Jee WS. On the rat model of human osteopenias and osteoporoses. Bone Miner. 1992;18(3):227–36. doi: 10.1016/0169-6009(92)90809-r. [DOI] [PubMed] [Google Scholar]
- 31.Donnelly E, Baker SP, Boskey AL, van der Meulen MCH. Effects of surface roughness and maximum load on the mechanical properties of cancellous bone measured by nanoindentation. Journal of Biomedical Materials Research. 2006;77A:426–435. doi: 10.1002/jbm.a.30633. [DOI] [PMC free article] [PubMed] [Google Scholar]
- 32.Boothroyd B. The problem of demineralization in thin sections of fully calcified bone. Journal of Cell Biology. 1964;20:165–173. doi: 10.1083/jcb.20.1.165. [DOI] [PMC free article] [PubMed] [Google Scholar]
- 33.Termine JD. Mineral chemistry and skeletal biology. Clinical Orthopaedics. 1972;85:207–239. doi: 10.1097/00003086-197206000-00036. [DOI] [PubMed] [Google Scholar]
- 34.Oliver WC, Pharr GM. Improved technique for determining hardness and elastic modulus using load and displacement sensing indentation experiments. Journal of Materials Research. 1992;7:1564–1583. [Google Scholar]
- 35.Johnson KL. Contact Mechanics. Cambridge: Cambridge University Press; 1985. p. 452. [Google Scholar]
- 36.Bushby AJ, Ferguson VL, Boyde A. Nanoindentation of bone: comparison of specimens tested in liquid and embedded in polymethylmethacrylate. Journal of Materials Research. 2004;19(1):249–259. [Google Scholar]
- 37.Daniel WW. Applied Nonparametric Statistics. Boston: PWS-KENT; 1990. [Google Scholar]
- 38.Sheldon MR, Fillyaw MJ, Thompson WD. The use and interpretation of the Friedman test in the analysis of ordinal-scale data in repeated measures designs. Physiother Res Int. 1996;1(4):221–8. doi: 10.1002/pri.66. [DOI] [PubMed] [Google Scholar]
- 39.Tarnowski CP, Ignelzi MA, Jr, Morris MD. Mineralization of developing mouse calvaria as revealed by Raman microspectroscopy. J Bone Miner Res. 2002;17(6):1118–26. doi: 10.1359/jbmr.2002.17.6.1118. [DOI] [PubMed] [Google Scholar]
- 40.Baker SP. Between nanoindentation and scanning force microscopy: measuring mechanical properties in the nanometer regime. Thin Solid Films. 1997;408–409:289–296. [Google Scholar]
- 41.Currey JD. Role of collagen and other organics in the mechanical properties of bone. Osteoporosis International. 2003;14(S5):S29–S36. doi: 10.1007/s00198-003-1470-8. [DOI] [PubMed] [Google Scholar]
- 42.Akiva U, Wagner HD, Weiner S. Modelling the three-dimensional elastic constants of parallel-fibered and lamellar bone. Journal of Materials Science. 1998;33:1497–1509. [Google Scholar]
- 43.Ziv V, Wagner HD, Weiner S. Microstructure-microhardness relations in parallel-fibered and lamellar bone. Bone. 1996;18(5):417–28. doi: 10.1016/8756-3282(96)00049-x. [DOI] [PubMed] [Google Scholar]
- 44.Boskey AL. Mineral-matrix interactions in bone and cartilage. Clin Orthop Relat Res. 1992;(281):244–74. [PubMed] [Google Scholar]
- 45.Iida H, Fukuda S. Age-related changes in bone mineral density, cross-sectional area and strength at different skeletal sites in male rats. J Vet Med Sci. 2002;64(1):29–34. doi: 10.1292/jvms.64.29. [DOI] [PubMed] [Google Scholar]
- 46.Kiebzak GM, Smith R, Gundberg CC, Howe JC, Sacktor B. Bone status of senescent male rats: chemical, morphometric, and mechanical analysis. J Bone Miner Res. 1988;3(1):37–45. doi: 10.1002/jbmr.5650030107. [DOI] [PubMed] [Google Scholar]
- 47.Kiebzak GM, Smith R, Howe JC, Gundberg CM, Sacktor B. Bone status of senescent female rats: chemical, morphometric, and biomechanical analyses. J Bone Miner Res. 1988;3(4):439–46. doi: 10.1002/jbmr.5650030411. [DOI] [PubMed] [Google Scholar]
- 48.Gourion-Arsiquaud S, Havill LM, Boskey AL. Within osteons infrared parameters linked to specific bone properties vary as a function of tissue and animal age. J Bone Miner Res. 2007;22(S1):S258. [Google Scholar]
- 49.Grynpas MD, Hamilton E, Cheung R, Tsouderos Y, Deloffre P, Hott M, Marie PJ. Strontium increases vertebral bone volume in rats at a low dose that does not induce detectable mineralization defect. Bone. 1996;18(3):253–9. doi: 10.1016/8756-3282(95)00484-x. [DOI] [PubMed] [Google Scholar]
- 50.Wergedal JE, Baylink DJ. Electron microprobe measurements of bone mineralization rate in vivo. American Journal of Physiology. 1974;226(2):345–52. doi: 10.1152/ajplegacy.1974.226.2.345. [DOI] [PubMed] [Google Scholar]
- 51.Rho J-Y, Pharr GM. Effects of drying on the mechanical properties of bovine femur measured by nanoindentation. Journal of Materials Science: Materials in Medicine. 1999;10:485–488. doi: 10.1023/a:1008901109705. [DOI] [PubMed] [Google Scholar]