Abstract
The correlation of carbonate content with enamel microstructure (chemical and crystal structure) and mechanical properties was evaluated via linear mapping analyses using Raman microspectroscopy and nanoindentation. Mappings started at the outer enamel surface and ended in the inner enamel near the dentin-enamel junction (DEJ) in lingual and buccal cervical and cuspal regions. The carbonate peak intensity at 1070 cm−1 gradually increased from outer to inner enamel. Moreover, the phosphate peak width, as measured by the full width at half maximum (FWHM) of the peak at 960 cm−1, also increased, going from ~9 cm−1 in outer enamel to ~13 cm−1 in enamel adjacent to the DEJ, indicating a decrease in the degree of crystallinity of hydroxyapatite from outer to inner enamel. In contrast, Young’s modulus decreased from 119±12 to 80±19 GPa across outer to inner enamel with a concomitant decrease in enamel hardness from 5.9±1.4 to 3.5±1.3 GPa. There were also significant correlations between carbonate content and associated crystallinity with mechanical properties. As carbonate content increased, there was an associated decrease in crystallinity and both of these changes correlated with decreased modulus and hardness. Collectively, these results suggest that enamel carbonate content and the associated change in the crystal structure of hydroxyapatite, i.e. degree of crystallinity, may have a direct effect on enamel mechanical properties. The combination of Raman microspectroscopy and nanoindentation proved to be an effective approach for evaluating the microstructure of enamel and its associated properties.
Keywords: enamel, carbonate distribution, mechanical properties, Raman microspectroscopy, nanoindentation
Introduction
Enamel, the hardest mineralized tissue in the human body, is comprised of approximately 96% (weight %) inorganic mineral, 3% water, and less than 1% organic matter (non-collagenous proteins, such as enamelins and amelogenins) [1, 2]. The inorganic mineral is non-stoichiometric carbonate-substituted hydroxyapatite (Ca10(PO4)6-x(OH)2-y)(CO3)x+y, where 0 ≤ × ≤ 6, 0 ≤ y ≤ 2) containing trace amounts of fluoride (F), sodium (Na), magnesium (Mg), zinc (Zn) and strontium (Sr) [3]. The hydroxyapatite (HA) crystallites naturally assemble into nanorods with a cross-sectional diameter of 25–50 nm and a length of up to 1 mm. Furthermore, these nanorods form enamel prisms, which are approximately 3–6 μm in diameter and may be up to several mm in length [4]. The majority of these prisms are arranged with their long axes nearly perpendicular to the tooth surface. The chemical composition, predominantly mineral, and the hierarchical structure of the mineral contribute considerably to enamel’s mechanical properties and its functions [5].
Nanoindentation has been widely used to characterize the mechanical properties of mineralized tissues [6, 7]. Based on nanoindentation measurements, the mechanical properties of enamel have been previously reported to be position dependent: Young’s modulus (E) and hardness (H) in the enamel region close to the dentin-enamel junction (DEJ) are lower than that in the outer enamel [8–12]. Some investigations have tried to explain the mechanical property gradient based on enamel composition. One reported that the gradient of enamel mechanical properties is associated with increased organic matter content in enamel near the DEJ [8]. Another reported that the mechanical property gradient was related to differences in the chemical/elemental content of enamel as measured by electron-microprobe analysis [10]. In conjunction with a decrease of modulus and hardness from outer to inner enamel, there was an associated decrease in calcium (Ca) and phosphorus (P), while magnesium (Mg) and sodium (Na) content increased. Their results suggest that the mechanical properties of enamel are directly dependent on its elemental composition.
Besides those factors mentioned above, however, another key component of enamel, carbonate (CO32−), should also be considered, because it makes up from 2–5 weight% of enamel which is higher than the content of organic matter and magnesium [1, 2, 10], and is a significant substituent in the crystal structure of biological hydroxyapatite (HA) [13–15]. An infrared (IR) method [15] has been used to measure the carbonate content in enamel, and it was reported that carbonate content is higher in inner enamel than outer enamel based on the intensity ratio of the carbonate to phosphate peaks. In addition, x-ray diffraction [15, 16] has been used to study the crystal size (crystallinity) of enamel HA. By measuring the width of the diffraction peak, it was found that the crystal size was larger, i.e. higher crystallinity, in outer enamel as compared to inner enamel.
Even though the previous investigations provide useful information, confocal Raman microspectroscopy has not been used as part of an enamel structure/property mapping analysis, to date. Besides advantages such as minimal specimen preparation and non-invasive sampling, Raman microspectroscopy is used to obtain chemical/molecular structure information from various materials and tissues with little interference from water [17–19]. Thus, Raman microspectroscopy is a potential valuable tool for measuring both carbonate distribution and hydroxyapatite crystallinity in enamel across the tooth. Moreover, despite previous investigations of carbonate content [15, 20], there has been no subsequent evaluation that links carbonate distribution with the associated effects on crystal structure and enamel mechanical properties. Because Raman microspectroscopy is a non-destructive procedure, the same specimens and sites evaluated for carbonate content and crystallinity can also be evaluated to measure the mechanical properties across enamel. Therefore, the objective of this study was to investigate the relationship between enamel carbonate content, crystallinity and mechanical properties by means of Raman microspectroscopy and nanoindentation.
Material and methods
Specimen preparation
Five non-carious, extracted human third molars were collected according to the protocol approved by the University of Missouri-Kansas City adult health sciences institutional review board. Teeth were from adults within the age range of 20–30 years. After removing any remaining soft tissues, the extracted teeth were stored at 4°C in phosphate-buffered saline (PBS) with 0.002% sodium azide to inhibit bacterial and fungal contamination (pH 7.4). A slow-speed water-cooled diamond saw (Buehler Ltd, Lake Bluff, IL, USA), was used to remove the roots from the molars. The remaining crowns were then sectioned buccolingually to generate a 2-mm-thick cross-sectional slice centered on the mesiobuccal and mesiolingual cusps. The sections were then sequentially polished under water with 600- and 1200-grit SiC paper and a ChemoMet polishing cloth (Buehler Ltd).
Nanoindentation
Polished tooth sections were analyzed at four sites, cervical and cuspal areas on the lingual and buccal aspects, as labeled in Fig. 1. Nanoindentation linear mappings were performed starting ~10 μm from the outer enamel surface and going toward the DEJ by means of a nanoindenter (Triboscope, Hysitron Inc., Minneapolis, MN, USA) attached to a Nanoscope IIIa atomic force microscope (AFM, Digital Instruments Inc, Santa Barbara, CA, USA). Two linear mappings (50 μm apart) were done across each site for each tooth section. A calibrated diamond-tipped indenter with an equilateral triangular base (Berkovich geometry) was used during mechanical data collection. A peak force of 2500 μN, loading and unloading rates of 250 μN/s and a holding segment time of 3 s were utilized with nanoindentations spaced at approximately 160-μm intervals. To prevent specimen drying, distilled water was deposited onto the tooth section surface throughout the nanoindentation mapping.
Fig. 1.
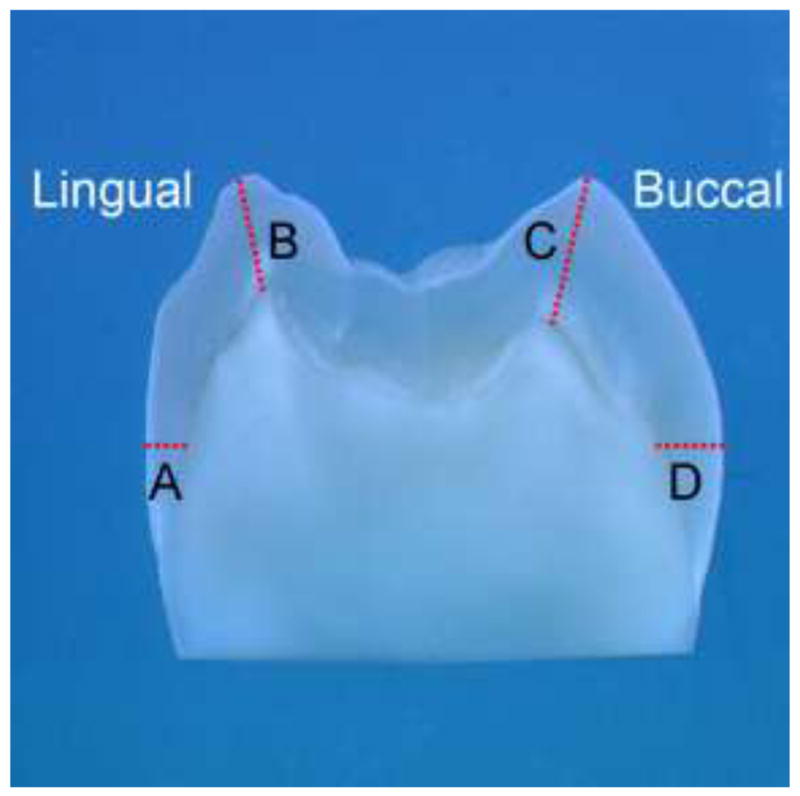
Photograph of tooth section showing the sites where mechanical properties and chemical structures were mapped (A) Lingual Cervical; (B) Lingual Cusp; (C) Buccal Cusp; (D) Buccal Cervical
Using the generated force-displacement curves from nanoindentation testing, the initial part of the unloading curve was analyzed based on the Oliver-Pharr method [6] to provide elastic modulus (E) and hardness (H) values for each nanoindentation. The values of Young’s modulus (Er, reduced modulus) and hardness of enamel were obtained via the Hysitron software based on the following equations:
Young’s modulus:
Where vm and Em are Poisson’s ratio and the elastic modulus of the material, respectively. In addition, vi and Ei are Poisson’s ratio and elastic modulus, respectively, for the indenter.
Hardness:
Where P is the load (applied force during indentation), k1 is a constant representing indenter geometry parameter, which is 24.5 for the Berkovich indenter ( , where θ = 65.3), and hp is the plastic penetration component.
Using the nanoindentation mappings, trend lines of modulus and hardness values were calculated across enamel from outer to inner at each of the four measurement sites within each tooth.
Raman microspectroscopy
A LabRam HR 800 Raman spectrometer (Horiba Jobin Yvon, Edison, NJ, USA) with monochromatic radiation emitted by a He-Ne laser (632.8 nm) and operating at an excitation power of 20 mW was used. The Raman unit is also equipped with a confocal microscope (Olympus BX41), a piezoelectric (PI) XYZ stage with a minimum step width of 50 nm, and an air-cooled CCD detector of 1024×256 pixels. During Raman mapping, the following parameters were used: 600 groove/mm grating, 400-μm confocal hole, and 150-μm slit width. Spectra were Raman-shift-frequency-calibrated using known lines of silicon.
Raman linear mapping of enamel was done at the same 4 sites (lingual cervical, lingual cusp, buccal cervical, buccal cusp) that were analyzed with nanoindentation. Micro-Raman spectra were collected using a 50X objective (Olympus, 1.00w) focused on the specimens. Spectra over the region of 50 to 4000 cm−1 were acquired at 100-μm intervals starting at the outer enamel surface and ending in the inner enamel near the DEJ using a 60-s integration time. An imaging system and high-resolution monitor enabled visual identification of the position at which the Raman spectra were obtained.
Spectral Data Analysis
Labspec 5 software (Horiba Jobin Yvon) was used to analyze the acquired Raman mapping data. After spectral smoothing, the mapping spectra were adjusted by multiple point baseline correction. A typical Raman linear mapping in the range of 200 cm−1 to 1500 cm−1 is presented in Fig. 2 with spectra acquired from outer to inner enamel at 100-μm intervals. The peak at 960 cm−1 is assigned to ν1 vibration peak of the phosphate group in enamel and the peak at 1070 cm−1 is assigned to ν1 vibration of the carbonate group (B type of carbonate) in enamel. The ν1 vibration peak of phosphate at 960 cm−1 was selected as the inner standard for the normalization adjustment.
Fig. 2.
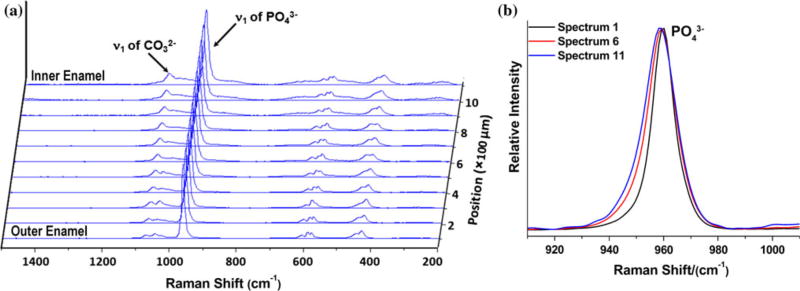
(a) Typical Raman linear mapping across outer to inner enamel. (b) Comparison of representative PO43− peaks across outer to inner enamel (from spectra 1, 6, 11).
Based on the Raman spectral maps, the ratio of carbonate at 1070 cm−1 to phosphate at 960 cm−1 was obtained to analyze differences in mineral composition across outer to inner enamel. In addition, the peak width of the phosphate band at 960 cm−1, as measured by full-width at half-maximum (FWHM), was calculated across each spectral map to reflect the amount of crystallinity across enamel. As peak width increases, crystallinity decreases [21–23].
Statistical Analyses
The outer and inner enamel mean modulus and hardness values and mean 1070/960 cm−1 ratios and FWMH for 960 cm−1 were calculated for the four measurement sites across tooth sections and compared using an analysis of variance (ANOVA). A Pearson’s correlation was also used to determine if there was a significant association between mechanical property measurements (modulus, hardness) and chemical structure (carbonate content: 1070/960 cm−1 ratio, crystallinity: 960 cm−1 FWMH) across enamel. The probability level for statistical significance was set at α = 0.05.
Results
Nanoindentation
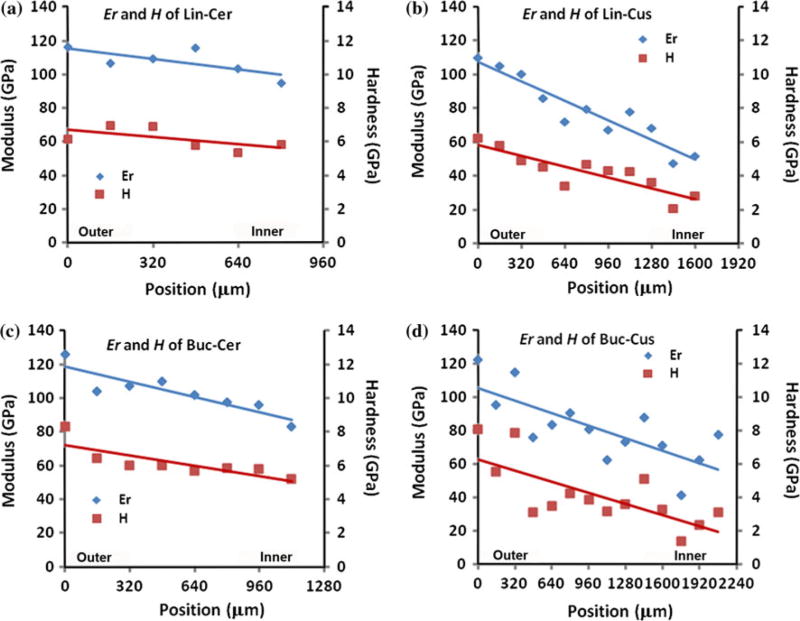
Representative linear mappings of Young’s modulus and hardness from nanoindentation at the four measurement sites are presented in Fig. 3. The X-axis designates the position in enamel going from outer (0 μm) to inner enamel near the DEJ with the X-axis length varying depending on the thickness of the enamel. The left Y-axis shows the values for Young’s modulus, while the right Y-axis shows that for hardness. Trend lines for modulus and hardness are included in each graph and indicate there was a decrease in Young’s modulus and hardness across enamel. For example in Fig. 3b (lingual cusp site), Young’s modulus of the outer enamel is approximately 110 GPa, and decreases to 60 GPa at the inner enamel near the DEJ, while the hardness values decrease from 6 to 3 GPa.
Fig. 3.
Representative linear mappings of modulus (Er) and hardness (H) across outer to inner enamel at four tooth sites (a) Lingual Cervical (Lin-Cer); (b) Lingual Cusp (Lin-Cus); (c) Buccal Cervical (Buc-Cer); (d) Buccal Cusp (Buc-Cus).
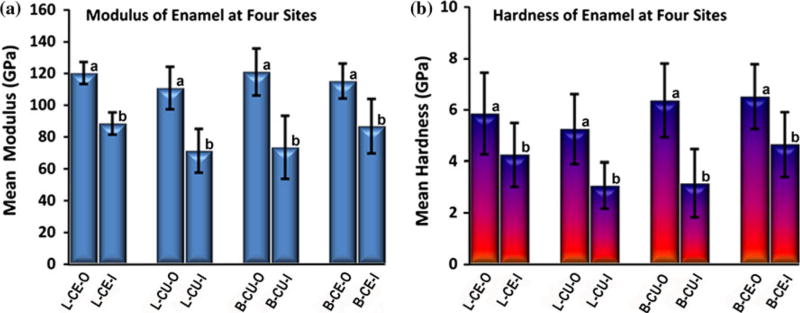
The modulus means and standard deviation (SD) of the two ends of the mapping (outer and inner measurements) at the four sites/tooth (n=5 teeth) are presented in Fig. 4a. Similarly, the hardness means and SD of outer and inner enamel measurements are presented in Fig. 4b. An ANOVA indicated that across the four tooth sites, outer measurements of modulus and hardness were significantly higher (P<0.05) than inner measurements as indicated by subsets (a and b) in each graph. However, there were no significant differences among the four sites.
Fig. 4.
Mean modulus (a) and hardness (b) of outer and inner enamel at four sites/tooth (n=5 teeth): Lingual cervical outer/inner (L-CE-O/L-CE-I); Lingual cusp outer/inner (L-CU-O/L-CU-I); Buccal cusp outer/inner (B-CU-O/B-CU-I); Buccal cervical outer/inner (B-CE-O/B-CE-I). Error bars represent SD. Modulus and hardness are significantly higher (P<0.05) in outer enamel at each site (similar subsets indicated as a or b in each graph)
Raman microspectroscopy
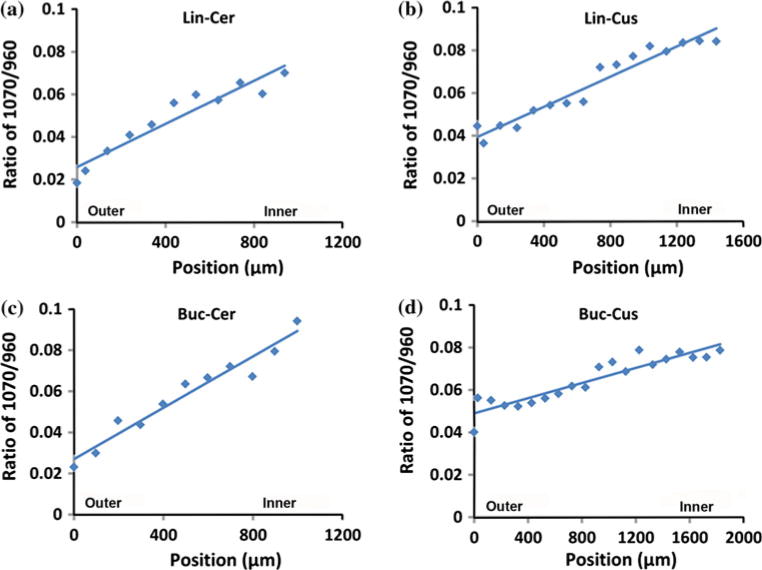
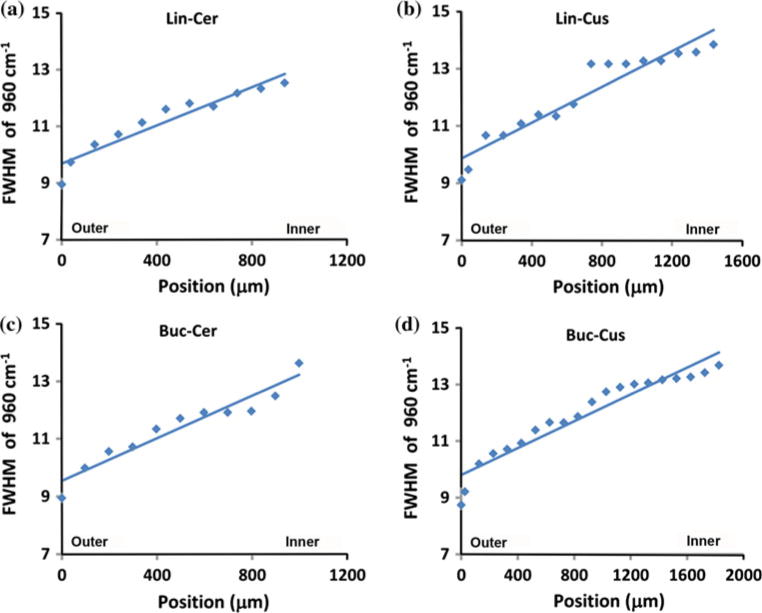
Comparing the spectra in the range of 1000 cm−1 to 1150 cm−1, it was found that the peak intensity of carbonate at 1070 cm−1 increased from outer enamel to inner enamel near the DEJ at all four sites across tooth sections. Representative mappings of the peak intensity ratios (height) of 1070 cm−1 to 960 cm−1 across outer to inner enamel from the four sites are presented in Fig. 5 with ratios ranging from ~0.02 (outer) up to ~0.09 (inner). Likewise, there was an increase in the peak width (FWHM) of the phosphate ν1 peak at 960 cm−1 from outer to inner enamel at the four sites as illustrated in Fig. 6. Across sites, the FWMH ranged from 9.3 cm−1 (outer) to 13.7 cm−1 (inner).
Fig. 5.
Representative linear mappings of 1070 cm−1/960 cm−1 (carbonate/phosphate) ratios across enamel at four sites (a) Lingual Cervical (Lin-Cer); (b) Lingual Cusp (Lin-Cus); (c) Buccal Cervical (Buc-Cer); (d) Buccal Cusp (Buc-Cus)
Fig. 6.
Representative linear mappings of 960 cm−1 (phosphate) peak width, full width at half maximum (FWHM), across enamel at four sites (a) Lingual Cervical (Lin-Cer); (b) Lingual Cusp (Lin-Cus); (c) Buccal Cervical (Buc-Cer); (d) Buccal Cusp (Buc-Cus)
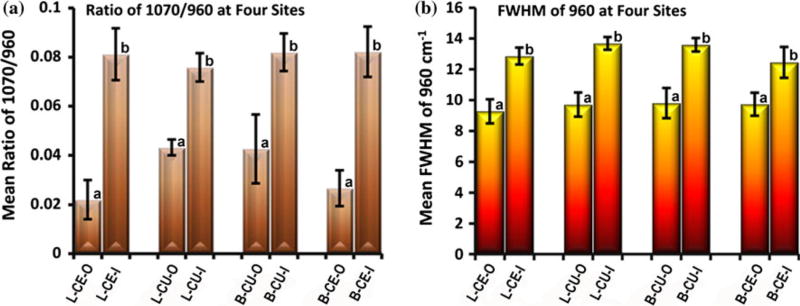
The mean and SD of the ratios of 1070 cm−1/960 cm−1 and the mean and SD of FWHM at 960 cm−1 at the outer and inner aspects of enamel at the four sites/tooth (n=5 teeth) are presented in Fig. 7a and b, respectively. Based on the ANOVA, the carbonate to phosphate ratio (1070/960 cm−1) and the FWHM at 960 cm−1 were significantly lower (P<0.05) in outer enamel as compared to inner enamel at all four sites. However, there were no significant differences among sites.
Fig. 7.
(a) Mean ratios of 1070 cm−1/960 cm−1 (carbonate/phosphate) and (b) mean FWHM of 960 cm−1 (phosphate peak width) in outer and inner enamel at four sites/tooth (n=5 teeth): Lingual cervical outer/inner (L-CE-O/L-CE-I); Lingual cusp outer/inner (L-CU-O/L-CU-I); Buccal cusp outer/inner (B-CU-O/B-CU-I); Buccal cervical outer/inner (B-CE-O/B-CE-I). Error bars represent SD. The ratio and peak width are significantly lower (P<0.05) in outer enamel at each site (similar subsets indicated as a or b in each graph)
There was also a significant negative correlation (P<0.05) between both the carbonate/phosphate peak ratio and the phosphate peak width (FWHM) and modulus and hardness measurements across outer to inner enamel. Modulus to carbonate/phosphate ratio and modulus to phosphate peak width correlations were both −0.72, while hardness to carbonate/phosphate ratio and hardness to phosphate peak width correlations were −0.62 and −0.73, respectively. Moreover, there was a significant positive correlation between the carbonate/phosphate ratio and the phosphate peak width (0.89). Collectively, these correlations indicate that as carbonate content increases there is an associated decrease in crystallinity and both of these factors are associated with decreased modulus and hardness.
Discussion
The results of this study indicate there is a mechanical property gradient across enamel with modulus and hardness significantly higher in outer enamel as compared to inner enamel near the DEJ, which is in agreement with previous reports [8–12]. In the current study, the overall mean modulus across the four tooth measurement sites ranged from 119±12 to 80±19 GPa from outer to inner enamel, respectively (Fig. 4a); whereas, overall mean hardness across the four sites ranged from 5.9±1.4 to 3.5±1.3 GPa from outer to inner (Fig. 4b). While it has been reported that the DEJ is considered a functionally graded interphase that is critical for maintaining the integrity of enamel to dentin [24–27], based on our results and those of others, it appears that enamel itself is a functionally graded material. Because materials with spatial gradients are more damage resistant [28], it is not surprising that enamel is such a material considering that teeth must withstand a lifetime of cyclic loading associated with chewing (~106 loading cycles/year) [29]. Maximum chewing/masticatory forces on the posterior teeth (premolars and molars) can range from 400 to 1200 N [30] with resultant high stresses due to the small occlusal contact area.
In terms of enamel differences based on tooth site, Cuy and colleagues [10] compared buccal and lingual cusp modulus and hardness via nanoindentation and reported that the lingual cusp values were higher; however, it is important to note that those differences were not statistically significant and only 3 maxillary molars were evaluated. In our study, although there were significant differences between outer and inner enamel modulus and hardness at all four tooth sites, there were no significant differences between buccal and lingual or cervical and cuspal sites, which is similar to what was reported by Park and colleagues [9].
To help explain the mechanical property gradient of enamel, potential associations with the orientation of enamel rods/prisms and enamel mechanical properties have been evaluated previously [4, 10]. The effect of crystal orientation on enamel mechanical properties is seemingly supported by the results from a three-dimensional finite element model of prismatic enamel that predicts higher modulus values along the direction of the enamel prism (60–110 GPa) as compared to horizontally across the prism (20–90 GPa) depending on the assumed degree of crystallinity [31]. Similarly, the results from a single crystal of Durango HA [32] with a higher modulus and hardness (150.4 and 7.1 GPa) at the base of the crystal compared to the side of the crystal (143.6 and 6.4 GPa) would also support the premise of crystal orientation effect on properties. However, neither Cuy et al. [10] nor Braly et al. [4] found that prism orientation had a significant influence on modulus and hardness enamel nanoindentation measurements. Both investigations agreed that enamel chemical composition is more important in relation to the nano-mechanical property gradient.
For example, Ca and P were reported to decrease as mechanical properties decreased from the outer to inner enamel; conversely, Na and Mg increased towards the DEJ [10]. In 2010, Darnell et al. [33] reported similar results when they investigated the mechanical properties of Alouatta palliata molar enamel. While these reports support the fact that chemical composition of enamel is important to its mechanical properties, the potential effects of carbonate on enamel mechanical properties should not be overlooked given that carbonate content ranges from 2–5 weight% [13–15]. Moreover, carbonate is a critical component as a substitute for phosphate groups in the HA crystal resulting in changes in the HA lattice parameters [15, 34] and associated physical properties such as increased solubility [35–37].
The current study is the first investigation to use Raman microspectroscopy to evaluate enamel carbonate content and crystallinity. Our results indicate a significant increase in carbonate content going from outer to inner enamel, similar to what has been previously reported as measured by chemical analysis techniques such as IR [15, 20]. Based on the carbonate to phosphate (1070/960 cm−1) ratios generated via Raman spectra (Fig. 7a), the overall mean carbonate/phosphate ratios across the four tooth sites ranged from 0.03±0.01 to 0.08±0.01 from outer to inner. Based on the FWHM of the ν1 vibration band of phosphate at 960 cm−1 [22, 23, 38], there was also a significant increase in FWHM from outer to inner enamel at all four tooth sites. By averaging the mean peak width of outer and inner enamel across the four sites (Fig. 7b), peak widths ranged from 9.7±0.8 cm−1 to 13.1±0.4 cm−1 from outer to inner. Because increased peak width reflects decreased crystallinity [21–23], our results indicate that there is a decrease in crystallinity going from outer to inner enamel, which is in agreement with previous investigations using x-ray diffraction [15, 16]. By using the previously reported Raman peak width of pure HA (7.1 cm−1) [38], we are also able to calculate associated crystallinity of our specimens based on the outer and inner enamel/HA peak width ratios. Thus, crystallinity values based on the overall mean peak width of outer and inner enamel would be 0.74±0.01 and 0.54±0.03, respectively. Altogether our results indicate that as carbonate content increased, there was an associated decrease in crystallinity. Similar to the mechanical property results of this study, while there were significant differences in carbonate content and crystallinity between outer and inner enamel at the four measurements sites, there were not significant differences between sites.
Based on our analyses, as both the carbonate to phosphate ratio (1070/960 cm−1) and FWHM of 960 cm−1 (i.e. crystallinity) increase from outer to inner enamel, modulus and hardness decrease. This suggests that in addition to the previously reported effects of enamel organic matter content [8] and other mineral changes [10, 33], increasing carbonate distribution and the associated decreased crystallinity of hydroxyapatite also contribute to the mechanical property gradient across outer to inner enamel. As previously reported, as carbonate is substituted for phosphate, incorporation of carbonate into apatite results in changes in the lattice parameters: contraction in the a-axis and expansion of the c-axis dimensions [15, 39]. Consequently, carbonate content also influences crystal shape and size with the tendency for carbonate apatites to be more equiaxed than needle-like and smaller in size [39]. In addition, the strength of a single HA crystal after immersion in water was reported to significantly decrease by 23–43% in proportion to carbonate content [40]. This information provides additional evidence that carbonate is an important factor that influences the mechanical properties of enamel as shown in the present work. To our knowledge, this is the first study in which carbonate content and associated crystallinity have been correlated with enamel mechanical properties.
The functional benefits of the mechanical property gradient associated with carbonate distribution across enamel in relation to mastication and associated cyclic loading have already been described. There are additional benefits related to the carbonate distribution pattern of enamel. For example, because outer enamel contains low carbonate, the outer tooth surface is less soluble and more resistant to attack from acidic by-products produced in dental plaque that lead to dental decay [35, 36].
To further understand the carbonate distribution pattern, the enamel formation process, which has been studied extensively, must be considered [1, 41, 42]. This complex biological formation process involves enamel matrix secretion, assembly of protein for enamel’s hierarchical structure, and inorganic component deposition on the enamel matrix. It has been reported that carbonate content is higher in immature teeth, especially at the outer surface, and decreases with time [13, 14, 41]. However, the position-dependent distribution of carbonate across enamel in mature teeth has not been clearly elucidated within the enamel formation and maturation process and thus, requires further research.
Conclusions
In summary, Raman microspectroscopy proved to be useful for measuring the carbonate content and crystallinity across enamel. Based on the results combining nanoindentation and Raman microspectroscopy, Young’s modulus and hardness are higher at the outer enamel surface than within enamel near the DEJ, which can potentially be explained, at least in part, by the contributory effect of increased carbonate content that is associated with decreased crystallinity across outer to inner enamel.
Acknowledgments
This investigation was supported by USPHS research grant DE021462 from the National Institute of Dental and Craniofacial Research, National Institutes of Health, Bethesda, MD, USA. We also want to thank Dr. Ying Liu for her assistance with the statistical analyses.
References
- 1.Nanci A. Enamel: Composition, formation, and structure. In: Nanci A, editor. Ten cate’s oral histology-development, structure, and function. Mosby; St Louis: 2003. [Google Scholar]
- 2.Driessens FCM, Verbeeck RMH. The mineral in tooth enamel and dental caries. In: Driessens FCM, Verbeeck RMH, editors. Biominerals. CRC Press; Boca Raton, Fl: 1990. [Google Scholar]
- 3.Brudevold F, Reda A, Aasenden R, Bakhos Y. Arch Oral Biol. 1975;20:667. doi: 10.1016/0003-9969(75)90135-1. [DOI] [PubMed] [Google Scholar]
- 4.Braly A, Darnell LA, Mann AB, Teaford MF, Weihs TP. Arch Oral Biol. 2007;52:856. doi: 10.1016/j.archoralbio.2007.03.005. [DOI] [PMC free article] [PubMed] [Google Scholar]
- 5.He LH, Swain MV. J Mechan Behav Biomed Mater. 2008;1:18. doi: 10.1016/j.jmbbm.2007.05.001. [DOI] [PubMed] [Google Scholar]
- 6.Lewis G, Nyman JS. J Biomed Mater Res B Appl Biomater. 2008;87:286. doi: 10.1002/jbm.b.31092. [DOI] [PubMed] [Google Scholar]
- 7.Angker L, Swain MV. J Mater Res. 2006;21:1893. doi: 10.1557/jmr.2006.0257. [DOI] [Google Scholar]
- 8.He LH, Swain MV. J Dent. 2009;37:596. doi: 10.1016/j.jdent.2009.03.019. [DOI] [PubMed] [Google Scholar]
- 9.Park S, Wang DH, Zhang D, Romberg E, Arola D. J Mater Sci Mater Med. 2008;19:2317. doi: 10.1007/s10856-007-3340-y. [DOI] [PubMed] [Google Scholar]
- 10.Cuy JL, Mann AB, Livi KJ, Teaford MF, Weihs TP. Arch Oral Biol. 2002;47:281. doi: 10.1016/S0003-9969(02)00006-7. [DOI] [PubMed] [Google Scholar]
- 11.Lee JJW, Morris D, Constantino PJ, Lucas PW, Smith TM, Lawn BR. Acta Biomater. 2010;6:4560. doi: 10.1016/j.actbio.2010.07.023. [DOI] [PubMed] [Google Scholar]
- 12.An B, Wang R, Arola D, Zhang D. J Mechan Behav Biomed Mater. 2012;9:63. doi: 10.1016/j.jmbbm.2012.01.009. [DOI] [PubMed] [Google Scholar]
- 13.Sydney-Zax M, Mayer I, Deutsch D. J Dent Res. 1991;70:913. doi: 10.1177/00220345910700051001. [DOI] [PubMed] [Google Scholar]
- 14.SonJu Clasen AB, Ruyter IE. Adv Dent Res. 1997;11:523. doi: 10.1177/08959374970110042101. [DOI] [PubMed] [Google Scholar]
- 15.LeGeros RZ, Sakae T, Bautista C, Retino M, LeGeros JP. Adv Dent Res. 1996;10:225. doi: 10.1177/08959374960100021801. [DOI] [PubMed] [Google Scholar]
- 16.Sakae T. Arch Oral Biol. 1988;33:707. doi: 10.1016/0003-9969(88)90003-9. 0003–9969(88)90003–9 [pii] [DOI] [PubMed] [Google Scholar]
- 17.Baena JR, Lendl B. Curr Opin Chem Biol. 2004;8:534. doi: 10.1016/j.cbpa.2004.08.014. [DOI] [PubMed] [Google Scholar]
- 18.Pappas D, Smith BW, Winefordner JD. Talanta. 2000;51:131. doi: 10.1016/s0039-9140(99)00254-4. [DOI] [PubMed] [Google Scholar]
- 19.Tsuda H, Arends J. Adv Dent Res. 1997;11:539. doi: 10.1177/08959374970110042301. [DOI] [PubMed] [Google Scholar]
- 20.Weatherell JA, Robinson C, Hiller CR. Caries Res. 1968;2:1. doi: 10.1159/000259538. [DOI] [PubMed] [Google Scholar]
- 21.Parayanthal P, Pollak FH. Phys Rev Lett. 1984;52:1822. doi: 10.1103/PhysRevLett.52.1822. [DOI] [Google Scholar]
- 22.Pucéat E, Reynard B, Lécuyer C. Chem Geol. 2004;205:83. doi: 10.1016/j.chemgeo.2003.12.014. [DOI] [Google Scholar]
- 23.Freeman JJ, Wopenka B, Silva MJ, Pasteris JD. Calcif Tissue Int. 2001;68:156. doi: 10.1007/s002230001206. [DOI] [PubMed] [Google Scholar]
- 24.Tesch W, Eidelman N, Roschger P, Goldenberg F, Klaushofer K, Fratzl P. Calcif Tissue Int. 2001;69:147. doi: 10.1007/s00223-001-2012-z. [DOI] [PubMed] [Google Scholar]
- 25.Walker MP, Fricke BA. Dentin-enamel junction of human teeth. In: Akay M, editor. Wiley encyclopedia of biomedical engineering. John Wiley & Sons, Inc; Hoboken, NJ: 2006. [Google Scholar]
- 26.White SN, Paine ML, Luo W, Sarikaya M, Fong H, Yu Z, et al. J Am Ceram Soc. 2000;83:238. doi: 10.1111/j.1151-2916.2000.tb01181.x. [DOI] [Google Scholar]
- 27.Zaslansky P, Friesem AA, Weiner S. J Struct Biol. 2006;153:188. doi: 10.1016/j.jsb.2005.10.010. [DOI] [PubMed] [Google Scholar]
- 28.Suresh S. Science. 2001;292:2447. doi: 10.1126/science.1059716. [DOI] [PubMed] [Google Scholar]
- 29.Yurkstas AA. J Prosthet Dent. 1965;15:248. doi: 10.1016/0022-3913(65)90094-6. [DOI] [PubMed] [Google Scholar]
- 30.Ferrario VF, Sforza C, Zanotti G, Tartaglia GM. J Dent. 2004;32:451. doi: 10.1016/j.jdent.2004.02.009. [DOI] [PubMed] [Google Scholar]
- 31.Spears IR. J Dent Res. 1997;76:1690. doi: 10.1177/00220345970760101101. [DOI] [PubMed] [Google Scholar]
- 32.Saber-Samandari S, Gross KA. Acta Biomater. 2009;5:2206. doi: 10.1016/j.actbio.2009.02.009. [DOI] [PubMed] [Google Scholar]
- 33.Darnell LA, Teaford MF, Livi KJT, Weihs TP. Amer J Phys Anthropol. 2010;141:7. doi: 10.1002/ajpa.21126. [DOI] [PubMed] [Google Scholar]
- 34.Zapanta-Legeros R. Nature. 1965;206:403. doi: 10.1038/206403a0. [DOI] [PubMed] [Google Scholar]
- 35.Gron P, Spinelli M, Trautz O, Brudevold F. Arch Oral Biol. 1963;8:251. doi: 10.1016/0003-9969(63)90016-5. [DOI] [PubMed] [Google Scholar]
- 36.Pan H, Darvell BW. Cryst Growth Des. 2010;10:845. doi: 10.1021/cg901199h. [DOI] [Google Scholar]
- 37.Sternlieb MP, Pasteris JD, Williams BR, Krol KA, Yoder CH. Polyhedron. 2010;29:2364. doi: 10.1016/j.poly.2010.05.001. [DOI] [Google Scholar]
- 38.Xu C, Karan K, Yao X, Wang Y. J Raman Spectrosc. 2009;40:1780. doi: 10.1002/jrs.2320. [DOI] [Google Scholar]
- 39.LeGeros RZ, Trautz OR, LeGeros JP, Klein E, Shirra WP. Science. 1967;155:1409. doi: 10.1126/science.155.3768.1409. [DOI] [PubMed] [Google Scholar]
- 40.Teraoka K, Ito A, Maekawa K, Onuma K, Tateishi T, Tsutsumi S. J Dent Res. 1998;77:1560. doi: 10.1177/00220345980770071201. [DOI] [PubMed] [Google Scholar]
- 41.Robinson C, Kirkham J, Brookes SJ, Bonass WA, Shore RC. Int J Dev Biol. 1995;39:145. [PubMed] [Google Scholar]
- 42.Margolis HC, Beniash E, Fowler CE. J Dent Res. 2006;85:775. doi: 10.1177/154405910608500902. [DOI] [PubMed] [Google Scholar]


