Abstract
Background
In 2009, the Center for Medicare & Medicaid Services (CMS) began penalizing hospitals with high rates of 30-day readmissions after hospitalizations for certain conditions. This policy will expand to include TKA in 2015.
Questions/purposes
What are the median profits and contribution margins of: (1) Medicare-reimbursed TKA, (2) 30-day TKA readmission, and (3) entire episode of care for readmitted TKA patients within 30 days compared to nonreadmitted patients? (4) Under new CMS guidelines, what financial penalty will the authors’ institution face if its arthroplasty readmission rate exceeds the national average?
Methods
A retrospective review of 3218 primary TKAs performed during 2 years at a large urban academic hospital network was conducted using administrative and financial data.
Results
The median profit and contribution margins, respectively, were as follows: TKA episode, USD 5209 and USD 11,726; 30-day readmission, USD 608 and USD 3814; TKA visit with readmission, USD 2855 and USD 13,901; TKA visit without readmission, USD 5300 and USD 11,652. Readmission penalties could reach USD 6.21 million per year for the authors’ institution.
Discussion
If our results are generalizable, unplanned TKA readmissions lead to diminished total profit. Although associated with a positive contribution margin, this is likely to be a short-term phenomenon as the new CMS policy will result in readmissions coming at a steep cost to referral centers.
Level of Evidence
Level IV, economic and decision analyses. See Instructions for Authors for a complete description of levels of evidence.
Introduction
With growing national attention on cost containment, unplanned readmissions have become a focus of healthcare payers, policy makers, and providers. The Centers for Medicare & Medicaid Services (CMS) initially began penalizing providers in 2008; the focus at that time was on certain hospital-caused diseases, such as central line-acquired infections [7, 10, 35]. Under the Patient Protection and Affordable Care Act of 2009, CMS has begun instituting reimbursement penalties for 30-day readmissions after hospitalizations for heart failure, acute myocardial infarction, and pneumonia [9, 33]. In August of 2013, the CMS announced the expansion of this policy to include patients admitted for elective THA and TKA for fiscal year 2015 [9]. Furthermore, because private insurers often emulate Medicare’s payment methods, we can expect many insurers to follow suit [4].
This new policy is not surprising, as Medicare is the primary payer for approximately 75% of all TKAs [27], and elective TKAs are among the most common surgeries in the Medicare-age population [15, 26]. In time, with increasing readmission rates [21] and decreasing reimbursements for arthroplasty [20, 25], TKA readmissions will have increasingly significant financial implications, even without an extension of CMS penalties to orthopaedics. Furthermore, other reimbursement changes are appearing on the horizon, including Accountable Care Organizations and “bundled payments”, which will further encourage cost containment and focus attention on unplanned readmissions.
In anticipation of this change in policy, we sought to answer the following questions: (1) What is the median profit and contribution margin on a Medicare-reimbursed TKA in a tertiary-care academic setting, (2) What is the median profit and contribution margin of a readmission TKA within 30 days, (3) What is the median profit and contribution margin of an entire episode of care for TKA patients who were readmitted within 30 days, how do those values compare with patients who are not readmitted, and (4) What would be the estimated penalty to the hospital if those readmissions were not paid for under the new CMS guidelines?
Patients and Methods
Study Design and Setting
This is a retrospective review of all 3218 patients who underwent primary TKA between July 1, 2009, and June 30, 2011, using administrative and financial data. Patients were admitted to our home institution, a large urban tertiary care academic center with more than 1700 beds distributed between three hospitals and with over 78,000 admissions annually.
Data Sources
Data for eligible TKA hospitalizations under review between 2009 and 2011 were obtained from the health system’s finance department. All readmissions to the institution were captured, regardless of department. Financial cost data for each hospitalization, including readmissions, were obtained from the health system’s cost accounting database, which is collected and maintained using Horizon Performance Manager software (McKesson Corp, San Francisco, CA, USA) [32]. This is a standard costing system used by many entities in the healthcare industry that functions to assign, as accurately as possible, all hospital expenses to specific services provided, ultimately deriving the cost of each patient encounter.
In this accounting system, for example, all hospital cost centers down to the level of individual nursing stations, CT scanning, or a building’s depreciation, are defined as individual accounting units. Each unit is defined as either patient care or overhead. The overhead units are allocated to various patient care units based on statistics that generally match the items on the annual Medicare Cost Report submitted annually by providers and as defined by CMS [6]. For example, building depreciation costs are assigned to patient care units based on square feet of facility utilization and accounting costs are assigned based on the patient charges generated through the care provided by each unit.
The nonoverhead costs of patients are units based on a running tab of the patient’s consumption during an encounter. Various inputs are calculated differently. For example, pharmaceutical costs are based on wholesale drug prices, procedure costs are often based on the associated Relative Value Units (RVUs) and historical data about the associated resource and staff requirements to perform the procedure, and the costs of implants are typically based on the exact price paid to the supplier. Hospital charges are only used in rare circumstances such as poorly studied procedures where a running tab of required resources is not available. In these circumstances, charges are adjusted based on historical data to estimate the actual cost as accurately as possible. Ultimately, all costs are assigned to a specific patient encounter and are defined as either variable or fixed, allowing useful analyses (the sum of variable and fixed costs necessarily equals total costs).
Total revenue for each visit, including readmissions, was calculated under the hypothetical assumption that the study subjects comprised a Medicare-only population, demonstrating the overall effect of on arthroplasty reimbursement under the assumption that private insurers would emulate Medicare’s reimbursement penalties. That is, Medicare reimbursement was calculated for each patient as a function of the Medicare Severity-Diagnosis Related Group associated with the visit in accordance with CMS policy, and actual reimbursement from non-Medicare payers were ignored. This assumption constitutes a worst-case scenario as Medicare typically reimburses at lower levels than commercial payers but, more importantly, this method improves generalizability as commercial reimbursement rates vary between institutions and geographic areas.
Patients
For this study, we used a sample of convenience composed of patients admitted to the institution under review. Patients who had undergone TKA during the study period were identified on the basis of the ICD-9 procedure code for primary TKA (81.54). Readmissions were included only if occurring for unforeseen causes; planned readmissions for inpatient rehabilitation or skilled nursing care were excluded from the analysis. Revision TKA procedures were not included. Thus, only primary TKA procedures and their related readmissions were included; readmissions that included a revision procedure were not included.
Identification of Outcomes
An episode of care was defined to encompass an initial hospital visit when a primary TKA was performed and any associated unplanned 30-day readmission(s). The economic outcomes examined were the median costs, Medicare reimbursements, profits, and contribution margins generated by TKA, and, when applicable, by subsequent unplanned 30-day readmission(s). Hospital profit and contribution margin were determined for each patient as reimbursement less total cost and reimbursement less variable cost, respectively. Reimbursement was calculated using Medical Severity-Diagnosis Related Group weights in accordance with CMS policy. Calculations assumed a Medicare-only population regardless of the actual insurer to maximize generalizability, as private reimbursement rates vary widely based on geography and bargaining power in local markets. Total cost was calculated as the sum of direct and indirect costs, both of which were determined through the robust cost accounting system maintained by the health system’s finance department. The maximum potential impact of reimbursement penalties, which is set as 3% of all annual operating diagnosis-related group reimbursement from the CMS to a hospital, was determined by summing all such payments across the departments and facilities of the hospital network under review.
Statistical Analysis
The Mann-Whitney U test was used to analyze differences between continuous nonparametric variables for all financial calculations. For all calculations, statistical significance was defined by p values of less than 0.05. Results are reported as median with associated interquartile range and, when applicable, mean values.
Results
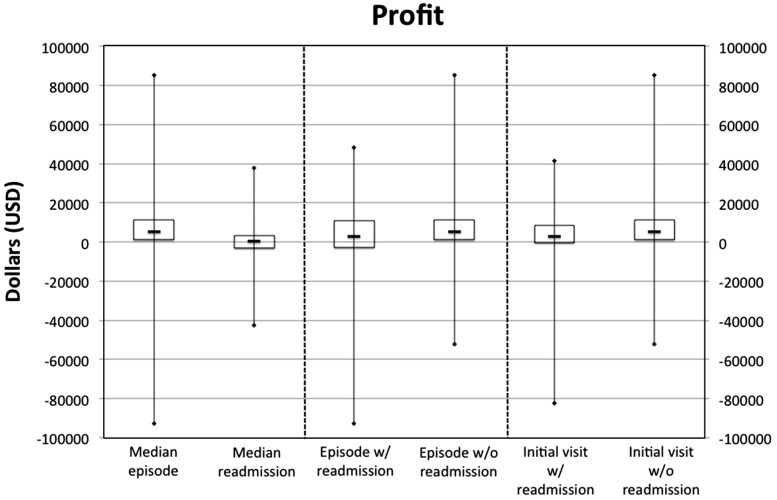
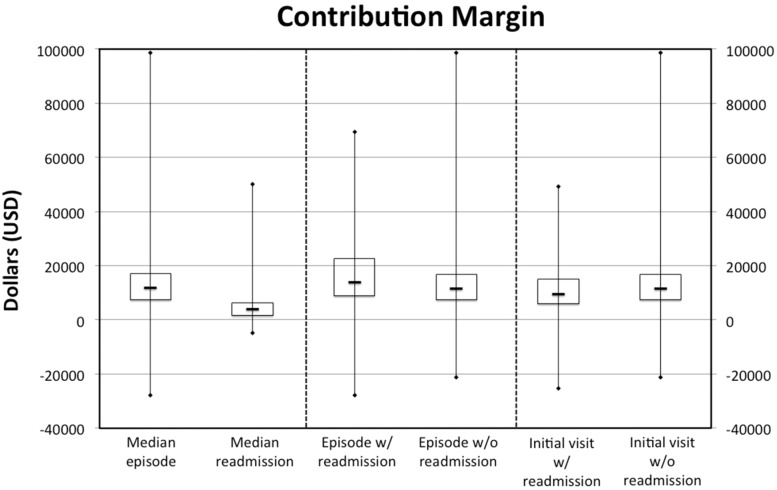
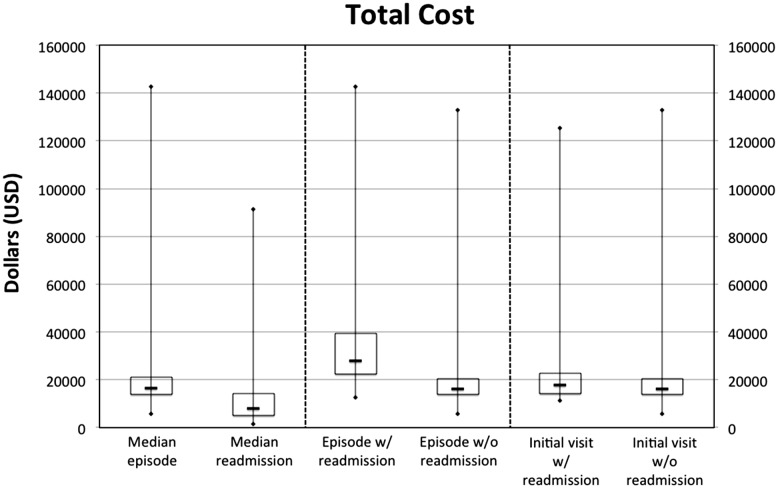
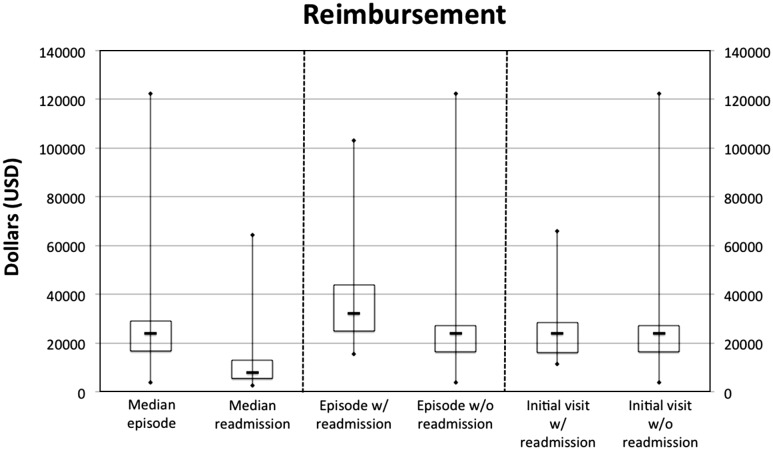
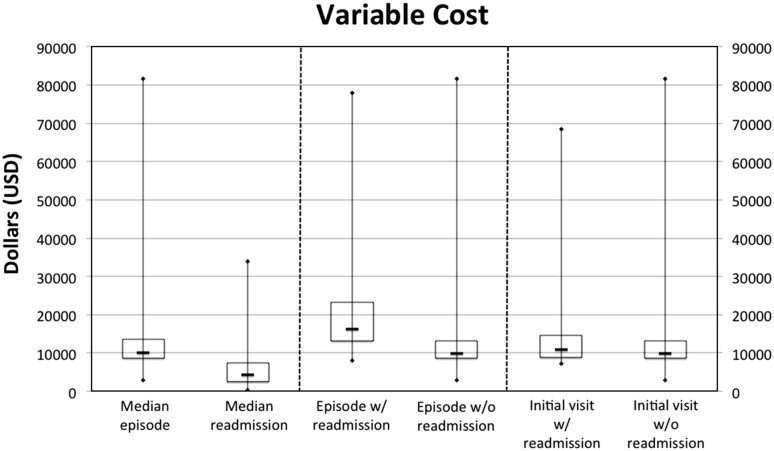
In the existing reimbursement system, a TKA episode generated a median profit of USD 5209 (Fig. 1) and contribution margin of USD 11,726 (Fig. 2). In calculating the profit, we found the median cost to the hospital network under review to be USD 16,361 (Fig. 3) and the reimbursement was USD 24,149 (Fig. 4). In calculating the contribution margin, we found the median variable cost of such an episode to be USD 10,190 (Fig. 5). Many outliers with high Medicare Severity-Diagnosis Related Group scores and high resultant reimbursements were present in this nonparametric population.
Fig. 1.
This box plot depicts profits for different types of visits.
Fig. 2.
This box plot depicts the contribution margins for different types of visits.
Fig. 3.
This box plot depicts the total costs for different types of visits.
Fig. 4.
This box plot depicts reimbursements for different types of visits.
Fig. 5.
This box plot depicts variable costs for different types of visits.
The median unplanned 30-day readmission cost the hospital USD 8027 and was reimbursed USD 7824, generating a profit of USD 608. The corresponding variable cost was USD 4380. This generated a contribution margin of USD 3814 (Table 1).
Table 1.
Impact of unplanned TKA readmissions on hospital finances for all visits
| Reimbursement (USD) | Total cost (USD) | Profit (USD) | Variable cost (USD) | Contribution margin (USD) | |
|---|---|---|---|---|---|
| Median episode of TKA care (Interquartile range) | 24,149 (16,600; 29,189) Range, 3718 to 122,503 |
16,361 (13,987; 21,013) Range, 5740 to 142,789 |
5209 (1319; 11,127) Range, −92,769 to 85,415 |
10,190 (8695; 13,514) Range: 2998 to 81,558 |
11,726 (7361; 16,957) Range, −27,836 to 98,657 |
| Median unplanned readmission (Interquartile range) | 7824 (5495; 12,910) Range, 2583 to 64,323 |
8027 (4959; 14,121) Range, 1345 to 91,457 |
608 (−3084; 3424) Range, −42,415 to 37,886 |
4380 (2540; 7418) Range, 320 to 33,877 |
3814 (1660; 6374) Range, −4875 to 50,126 |
When considering entire episodes of care including both the initial TKA visit and any subsequent readmissions, we found that episodes with unplanned readmissions generated a median profit of USD 2855 and contribution margin of USD 13,901 while nonreadmitted patients generated a profit of USD 5300 and contribution margin of USD 11,652. We found that readmitted patients were USD 4130 less profitable (p < 0.001), generated USD 2997 greater contribution margin, were USD 15,701 more expensive (p < 0.001), and were better reimbursed by USD 11,571 (p < 0.001) compared to episodes without readmissions (Table 2). Additionally, initial TKA visits that were associated with subsequent unplanned readmissions were USD 3223 less profitable (p < 0.001) and generated USD 1,917 lower contribution margins (p = 0.008) than those without associated readmissions. In calculating these values, these initial TKA visits were USD 3250 more expensive (p < 0.001), reimbursed approximately equally (p = 0.973), and generated higher variable costs (p < 0.001) (Table 3). We estimated that the readmission penalties could reach USD 6.21 million per year for our institution if the health system’s arthroplasty readmission rate exceeds the national average.
Table 2.
Impact of unplanned TKA readmissions on hospital finances for the entire episode of care
| Reimbursement (USD) | Total cost (USD) | Profit (USD) | Variable cost (USD) | Contribution margin (USD) | |
|---|---|---|---|---|---|
| Median episode of care with unplanned readmission(s) (Interquartile range) | 32,348 (24,854; 43,996) Range, 15,386 to 103,140 |
27,813 (22,451; 39,288) Range, 12,684 to 142,789 |
2855 (−2981; $10,888) Range, −92,769 to 48,419 |
16,319 (13,143; 23,286) Range, 7992 to 77,856 |
13,901 (8796; 22,729) Range, −27,836 to 69,501 |
| Median episode of care without unplanned readmission (Interquartile range) | 24,149 (16,471; 27,153) Range, 3718 to 122,503 |
16,018 (13,893; 20,562) Range, 5740 to 132,957 |
5300 (1420; 11,141) Range, −52,057 to 85,415 |
9964 (8635; 13,195) Range, 2998 to 81,558 |
11,652 (7319; 16,795) Range, −21,361 to 98,657 |
| p Value | < 0.001 | < 0.001 | < 0.001 | < 0.001 | < 0.001 |
| Linear regression coefficient* (95% CI) | 11,571 (9983 to 13,159) | 15,701 (14,481 to 16,921) | −4130 (−5679 to −2581) | 8574 (7821 to 9327) | 2997 (1561 to 4434) |
* Linear regression coefficient is a measure of effect size. CI = Confidence interval.
Table 3.
Impact of unplanned TKA readmissions on hospital finances for initial visits
| Reimbursement (USD) | Total cost (USD) | Profit (USD) | Variable cost (USD) | Contribution margin (USD) | |
|---|---|---|---|---|---|
| Initial TKA visit for patients who had subsequent unplanned readmission(s) (Interquartile range) | 24,149 (16,257; 28,283) Range, 11,238 to 65,834 |
17,728 (14,328; 22,831) Range, 11,340 to 125,528 |
2979 (−465; 8,470) Range, −82,332 to 41,444 |
11,019 (8892; 14,588) Range, 7259 to 68,428 |
9380 (6024; 15,091) Range, −25,233 to 49,387 |
| Initial TKA visit for patients who did not have subsequent unplanned readmission (Interquartile range) | 24,149 (16,471; 27,153) Range, 3718 to 122,503 |
16,018 (13,893; 20,562) Range, 5740 to 132,957 |
5300 (1420; 11,141) Range, 52,057 to 85,415 |
964 (8635; 13,195) Range, 2998 to 81,558 |
11,652 (7319; 16,795) Range, −21,361 to 98,657 |
| p Value | 0.973 | < 0.001 | < 0.001 | < 0.001 | 0.008 |
| Linear regression coefficient* (95% CI) | 27 (−1514 to 1568) | 3250 (2124 to 4377) | −3223 (−4731 to −1715) | 1,944 (1238 to 2650) | −1917 (−3327 to −507) |
* Linear regression coefficient is a measure of effect size. CI = Confidence interval.
Discussion
Given the large and growing volume of annual TKAs, this procedure as well as its associated complications and readmissions plays an important role in modern healthcare spending. With reimbursement penalties from CMS on the horizon, a better understanding of the financial implications of unplanned readmissions after TKA will be instrumental as hospitals determine what, if any, interventions should be implemented to eliminate readmissions. The purpose of this study was to elucidate the financial impact of unplanned TKA readmissions on hospitals, both in the current reimbursement environment and under the planned CMS readmission penalties. We found that the median TKA episode generates a large positive contribution margin and profit, making it desirable in both the short and long term to continue providing this care. Readmissions within 30 days were slightly profitable and generated a large contribution margin, making them financially attractive in the short run and slightly so in the long run. TKA patients with unplanned readmissions were significantly less profitable than their counterparts who were not readmitted, not due to the actual readmission but because their initial hospitalizations were more expensive but reimbursed at the same level. Finally, readmission penalties could potentially reach millions of dollars per year for the institution under review.
A limitation to this study is the potential inaccuracy of our cost estimates. They were generated by the hospital’s cost accounting system, which is relatively robust. Of note, it minimizes reliance on hospital charges, which are a notoriously inaccurate means of accounting for costs [17, 31, 36]. However, any cost accounting system in a complex institution relies on estimates and thus is not perfectly accurate. Furthermore, since readmissions were only slightly profitable in our findings, if cost data was inaccurate, then readmissions could actually be unprofitable. Another limitation to this study is the use of a single institution’s data. While the hospital system under review is large and offers most of the care for the local community, in the event that a patient required postoperative readmission and presented to an outside facility, this would not be captured in our results. If future changes to CMS policies discourage hospitals from admitting postoperative complications from other facilities, our results could change and a reanalysis would be merited. Lastly, it should be noted that financial terms are variable across centers – what we denote as “profit” and “contribution margin” in this study may be identified as “operating income” or “operating margin”, respectively, at other institutions.
Our findings demonstrate a positive contribution margin and profit generated by the median primary TKA episode. Contribution margin is typically considered a good representation of an organization’s short-term incentives because it is calculated based on variable costs, which can generally be changed relatively quickly. By contrast, profit is a reflection of both variable and fixed costs. The latter typically includes overhead and administrative costs that cannot be rapidly altered. Thus, profit is generally considered a good representation of an organization’s longer-term incentives. Since our results demonstrate a large positive contribution margin and profit generated by the median primary TKA episode, it suggests that the hospital network under review has both a short- and long-term financial interest in continuing to provide TKAs, which is not surprising.
The picture is more complex when considering unplanned readmissions. Such hospitalizations tend to generate a large contribution margin but are associated with a relatively small profit. This incentive pattern suggests hospitals have a financial motivation to permit unplanned post-TKA readmissions in the short-term. Thus, our results do not demonstrate that unplanned readmissions are currently financially detrimental. In the longer-term, this incentive to readmit patients with post-TKA is much weaker, and hospitals with limited capacity could be motivated to transition the resources currently spent on unplanned TKA readmissions to more profitable service lines.
Our financial analysis also reveals that patients who underwent TKA and were readmitted to the hospital network under review tended to generate significantly less profit and contribution margin than their counterparts who were not readmitted. However, the lost gains occurred during the initial TKA hospitalization; they typically were not a result of the readmission. This is not entirely surprising as previous literature has suggested that readmitted patients are sicker and, on average, spend more time in the hospital during their arthroplasty hospitalization [11, 37]. If our results are generalizable, readmitted patients after TKA are financially attractive, but less so than their nonreadmitted counterparts. Recent literature by Eappen et al. [16] has demonstrated a detrimental effect of numerous surgical complications on hospital finances. A subtle but important difference in our findings is that readmission visits themselves were profitable (slightly) and generated a substantial contribution margin; readmitted patients were less profitable due to the high costs of their initial TKA hospitalization, which adds a new consideration for arthroplasty surgeons. While it is likely impractical and arguably unethical to eliminate care for such patients, it may well benefit hospitals to identify this population and institute interventions that shorten lengths of stay and ensure preoperative optimization of all comorbid conditions.
The entire annual CMS operating diagnosis-related group reimbursement to the institution under review was USD 207.3 million, which translates into USD 6.21 million at risk for penalization if the health system’s arthroplasty readmission rate exceeds the national average. This data was provided by the health system’s finance department, and reflects the maximum possible penalty (3%), which would represent a major impact on the arthroplasty program under review [8]. In fact, a full penalty of 3% of all annual CMS operating diagnosis-related group payments would likely constitute a substantial financial blow to even the largest arthroplasty program. This threat may be strong enough to motivate hospitals’ to invest in efforts that reduce unplanned readmissions after TKA and the other disease conditions eligible for CMS reimbursement penalties. This penalty may affect this institution as the readmission rate found here approximates the national average reported in recent literature [12]. However, while only hospitals with the highest readmission rates will be vulnerable to the full 3% penalty, if hospitals respond by implementing successful readmission prevention programs as CMS intends, the national average readmission rate can be expected to fall, incentivizing more, or possibly even most, hospitals to strive to eliminate unplanned post-TKA readmissions.
In conclusion, we found that TKA patients with unplanned readmissions generate significantly less total profit but higher contribution margins than their counterparts who are not readmitted. The lost profit occurs because the initial hospitalization is more expensive for patients who are later readmitted; it is not a result of the readmission. The actual readmission itself generates a substantial contribution margin and a small profit. As mentioned earlier, contribution margin is considered a better gauge of hospital behavior in the short-term while profit is a better reflection of long-term incentives. Thus, in the current reimbursement environment, hospitals have an incentive to continue tolerating unplanned readmissions in the short-term and will only be motivated to eliminate readmissions in the long-term if they are operating at capacity and believe TKA readmissions can be replaced by more profitable care. However, CMS readmission penalties could potentially reach millions of dollars per year for a large institution similar to the one examined in this study. This will likely be sufficient to create both short- and long-term incentivizes for hospitals with above-average readmission rates to invest in efforts to eliminate post-TKA readmissions. Further research is still needed to establish pathways of care to reduce costs and readmissions; considering consolidation of care at a single hospital network [5, 18, 19, 22, 26, 28–30], tailored discharge disposition [3, 34], accelerated care pathways [2, 24], and nonmedical interventions such as interdisciplinary home care programs [1, 13, 14, 23] may lead to a change in current practice.
Acknowledgments
The authors thank Theresa Larivee, the Office of Financial Operations and Budget at the University of Pennsylvania Health System, and the staff at the Penn Data Store.
Footnotes
Each author certifies that he or she, or a member of his or her immediate family, has no funding or commercial associations (eg, consultancies, stock ownership, equity interest, patent/licensing arrangements, etc) that might pose a conflict of interest in connection with the submitted article.
All ICMJE Conflict of Interest Forms for authors and Clinical Orthopaedics and Related Research ® editors and board members are on file with the publication and can be viewed on request.
Each author certifies that his or her institution approved the human protocol for this investigation that all investigations were conducted in conformity with ethical principles of research, and that informed consent for participation in the study was obtained.
The work was performed at the Hospital of the University of Pennsylvania, Philadelphia, PA, USA.
References
- 1.Aimonino Ricauda N, Tibaldi V, Leff B, Scarafiotti C, Marinello R, Zanocchi M, Molaschi M. Substitutive “hospital at home” versus inpatient care for elderly patients with exacerbations of chronic obstructive pulmonary disease: a prospective randomized, controlled trial. J Am Geriatr Soc. 2008;56:493–500. [DOI] [PubMed]
- 2.Andersen SH, Husted H, Kehlet H. [Economic consequences of accelerated care pathways in total knee-arthroplasty] [in Danish] Ugeskr Laeg. 2009;171:3276–3280. [PubMed] [Google Scholar]
- 3.Bini SA, Fithian DC, Paxton LW, Khatod MX, Inacio MC, Namba RS. Does discharge disposition after primary total joint arthroplasty affect readmission rates? J Arthroplasty. 2010;25:114–117. doi: 10.1016/j.arth.2008.11.007. [DOI] [PubMed] [Google Scholar]
- 4.Bodenheimer T, Wagner EH, Grumback K. Improving primary care for patients with chronic illness: the chronic care model. Part 2. J Am Med Assoc. 2002;288:1909–1914. doi: 10.1001/jama.288.15.1909. [DOI] [PubMed] [Google Scholar]
- 5.Bozic KJ, Maselli J, Pekow PS, Lindenauer PK, Vail TP, Auerbach AD. The influence of procedure volumes and standardization of care on quality and efficiency in total joint replacement surgery. J Bone Joint Surg Am. 2010;92:2643–2652. doi: 10.2106/JBJS.I.01477. [DOI] [PubMed] [Google Scholar]
- 6.Centers for Medicare & Medicaid Services. Cost reports by fiscal year. Available at: http://www.cms.gov/Research-Statistics-Data-and-Systems/Files-for-Order/CostReports/Cost-Reports-by-Fiscal-Year.html. Accessed May 3, 2014.
- 7.Centers for Medicare & Medicaid Services. Hospital-acquired conditions (present on admission indicator). Available at: http://www.cms.gov/Medicare/Medicare-Fee-for-Service-Payment/HospitalAcqCond/index.html?redirect=/HospitalAcqCond/01_Overview.asp. Accessed November 21, 2013.
- 8.Centers for Medicare & Medicaid Services. Press release: CMS issues proposed hospital inpatient payment regulation. 2014. Available at: http://www.cms.gov/Newsroom/MediaReleaseDatabase/Press-releases/2014-Press-releases-items/2014-04-30.html. Accessed May 2, 2014.
- 9.Centers for Medicare & Medicaid Services. Readmissions reduction program. 2013. Available at: http://www.cms.gov/Medicare/Medicare-Fee-for-Service-Payment/AcuteInpatientPPS/Readmissions-Reduction-Program.html. Accessed November 27, 2013.
- 10.Centers for Medicare & Medicaid Services, United States Department of Health and Human Services Medicare program: Changes to the hospital inpatient prospective payment systems and fiscal year 2008 rates. Fed Regist. 2007;72:47379–47428. [PubMed] [Google Scholar]
- 11.Clement RC, Derman PB, Graham DS, Speck RM, Flynn DN, Levin LS, Fleisher LA. Risk factors, causes, and the economic implications of unplanned readmissions following total hip arthroplasty. J Arthroplasty. 2013;28:7–10. doi: 10.1016/j.arth.2013.04.055. [DOI] [PubMed] [Google Scholar]
- 12.Cram P, Lu X, Kates SL, Singh JA, Li Y, Wolf BR. Total knee arthroplasty volume, utilization, and outcomes among Medicare beneficiaries. JAMA. 2012;308:1227–1236. doi: 10.1001/2012.jama.11153. [DOI] [PMC free article] [PubMed] [Google Scholar]
- 13.Cryer L, Shannon SB, Van Amsterdam M, Leff B. Costs for “hospital at home” patients were 19 percent lower, with equal or better outcomes compared to similar inpatients. Health Aff (Millwood). 2012;31:1237–1243. doi: 10.1377/hlthaff.2011.1132. [DOI] [PubMed] [Google Scholar]
- 14.Cummings JE, Hughes SL, Weaver FM, Manheim LM, Conrad KJ, Nash K, Braun B, Adelman J. Cost-effectiveness of Veterans Administration hospital-based home care: a randomized controlled trial. Arch Int Med. 1990;150:1274–1280. doi: 10.1001/archinte.1990.00390180092017. [DOI] [PubMed] [Google Scholar]
- 15.DeFrances CJ, Hall MJ. 2002 National hospital discharge survey. Adv Data Vital Health Stat. 2004;342:1–29. [PubMed] [Google Scholar]
- 16.Eappen S, Lane BH, Rosenberg B, Lipsitz SA, Sadoff D, Matheson D, Berry WR, Lester M, Gawande AA. Relationship between occurrence of surgical complications and hospital finances. JAMA. 2013;309:1599–1606. doi: 10.1001/jama.2013.2773. [DOI] [PubMed] [Google Scholar]
- 17.Finkler SA. The distinction between cost and charges. Ann Intern Med. 1982;96:102–109. doi: 10.7326/0003-4819-96-1-102. [DOI] [PubMed] [Google Scholar]
- 18.Hannan EL, Kilburn H, Jr, Bernard H, O’Donnell JF, Lukacik G, Shields EP. Coronary artery bypass surgery: the relationship between inhospital mortality rate and surgical volume after controlling for clinical risk factors. Med Care. 1991;29:1094–1107. doi: 10.1097/00005650-199111000-00003. [DOI] [PubMed] [Google Scholar]
- 19.Hannan EL, O’Donnell JF, Kilburn H, Jr, Bernard HR, Yazici A. Investigation of the relationship between volume and mortality for surgical procedures performed in New York State. J Am Med Assoc. 1989;7:503–510. doi: 10.1001/jama.1989.03430040075029. [DOI] [PubMed] [Google Scholar]
- 20.Hariri S, Bozic KJ, Lavernia C, Prestipino A, Rubash H. Medicare physician reimbursement: past, present, and future. J Bone Joint Surg Am. 2007;89:2536–2546. doi: 10.2106/JBJS.F.00697. [DOI] [PubMed] [Google Scholar]
- 21.Huddleston JI, Maloney WJ, Wang Y, Verzier N, Hunt DR, Herndon JH. Adverse events after total knee arthroplasty: a national Medicare study. J Arthroplasty. 2009;24(6 suppl):95–100. doi: 10.1016/j.arth.2009.05.001. [DOI] [PubMed] [Google Scholar]
- 22.Hughes RG, Hunt SS, Luft HS. Effects of surgeon volume and hospital volume on quality of care in hospitals. Med Care. 1987;25:489–503. doi: 10.1097/00005650-198706000-00004. [DOI] [PubMed] [Google Scholar]
- 23.Hughes SL, Weaver FM, Giobbie-Hurder A, Manheim L, Henderson W, Kubal JD, Ulasevich A, Cummings J, Department of Veterans Affairs Cooperative Study Group on Home-Based Primary Care Effectiveness of team-managed home-based primary care: a randomized multicenter trial. J Am Med Assoc. 2000;284:2877–2885. doi: 10.1001/jama.284.22.2877. [DOI] [PubMed] [Google Scholar]
- 24.Husted H, Otte KS, Kristensen BB, Orsnes T, Kehlet H. Readmissions after fast-track hip and knee arthroplasty. Arch Orthop Trauma Surg. 2010;130:1185–1191. doi: 10.1007/s00402-010-1131-2. [DOI] [PubMed] [Google Scholar]
- 25.Iglehart JK. Medicare’s declining payments to physicians. N Engl J Med. 2002;346:1924–1930. doi: 10.1056/NEJMhpr020324. [DOI] [PubMed] [Google Scholar]
- 26.Judge A, Chard J, Learmonth I, Dieppe P. The effects of surgical volumes and training centre status on outcomes following total joint replacement: Analysis of the Hospital Episode Statistics for England. J Public Health (Oxf). 2006;28:116–124. doi: 10.1093/pubmed/fdl003. [DOI] [PubMed] [Google Scholar]
- 27.Katz BP, Freund DA, Heck DA, Dittus RS, Paul JE, Wright J, Coyte P, Holleman E, Hawker G. Demographic variation in the rate of knee replacement: A multi-year analysis. Health Serv Res. 1996;31:125–140. [PMC free article] [PubMed] [Google Scholar]
- 28.Luft HS. The relation between surgical volume and mortality: An exploration of causal factors and alternative models. Med Care. 1980;18:940–959. doi: 10.1097/00005650-198009000-00006. [DOI] [PubMed] [Google Scholar]
- 29.Luft HS, Bunker JP, Enthoven AC. Should operations be regionalized? The empirical relation between surgical volume and mortality. N Engl J Med. 1979;301:1364–1369. doi: 10.1056/NEJM197912203012503. [DOI] [PubMed] [Google Scholar]
- 30.Luft HS, Hunt SS, Maerki SC. The volume-outcome relationship: Practice-makes-perfect or selective-referral patterns? Health Serv Res. 1987;22:157–182. [PMC free article] [PubMed] [Google Scholar]
- 31.Macario A, Vitez TS, Dunn B, McDonald T. Where are the costs in perioperative care? Analysis of hospital costs and charges for inpatient surgical care. Anesthesiology. 1995;83:1138–1144. doi: 10.1097/00000542-199512000-00002. [DOI] [PubMed] [Google Scholar]
- 32.McKesson. McKesson performance management solution helps hospitals assess and improve quality of care. Available at: http://www.mckesson.com/about-mckesson/newsroom/press-releases/2004/mckesson-performance-management-solution-helps-hospitals-assess-and-improve-quality-of-care. Accessed May 3, 2014.
- 33.Medicare Payment Advisory Commission. Report to the congress: Promoting greater efficiency in medicare. Chapter 5: Payment policy for inpatient readmissions. Available at: www.medpac.gov/documents/Jun07_EntireReport.pdf. Accessed July 24, 2012.
- 34.Riggs RV, Roberts PS, Aronow H, Younan T. Joint replacement and hip fracture readmission rates: impact of discharge destination. Phys Med Rehabil. 2010;2:806–810. doi: 10.1016/j.pmrj.2010.05.008. [DOI] [PubMed] [Google Scholar]
- 35.Rosenthal MB. Nonpayment for performance? Medicare’s new reimbursement rule. N Engl J Med. 2007;357:1573–1575. doi: 10.1056/NEJMp078184. [DOI] [PubMed] [Google Scholar]
- 36.Shwartz M, Young DW, Siegrist R. The ratio of costs to charges: How good a basis for estimating costs? Inquiry. 1995;32:476–481. [PubMed] [Google Scholar]
- 37.Zmistowski B, Restrepo C, Hess J, Adibi D, Cangoz S, Parvizi J. Unplanned readmission after total joint arthroplasty: rates, reasons, and risk factors. J Bone Joint Surg Am. 2013;95:1869–1876. doi: 10.2106/JBJS.L.00679. [DOI] [PubMed] [Google Scholar]


