

Abstract
Recent studies have shown that lysine side-chain NH3+ groups are excellent probes for NMR investigations of dynamics involving hydrogen bonds and ion pairs relevant to protein function. However, due to rapid hydrogen exchange, observation of 1H-15N NMR cross peaks from lysine NH3+ groups often requires use of a relatively low temperature, which renders difficulty in resonance assignment. Here we present an effective strategy to assign 1H and 15N resonances of NH3+ groups at low temperatures. This strategy involves two new 1H/13C/15N triple-resonance experiments for lysine side chains. Application to a protein-DNA complex is demonstrated.
Keywords: Proteins, side chains, Lysine, NH3+ groups, 1H/13C/15N resonances
Hydrogen bonds and ion pairs involving protein side chains are of fundamental importance in protein functions such as molecular recognition and catalysis. Recently it was demonstrated that lysine (Lys) side-chain NH3+ groups are very useful probes for NMR studies of protein dynamics involving hydrogen bonds and ion pairs (Anderson et al. 2013; Esadze et al. 2011; Zandarashvili et al. 2013; Zandarashvili et al. 2011). Heteronuclear 1H-15N cross peaks from Lys NH3+ groups are also useful for identifying molecular interfaces between protein and ligand (Blaum et al. 2010; Poon et al. 2006). Resonance assignment for Lys NH3+ groups typically requires not only standard experiments such as (H)C(CO)NH, H(CCO)NH, and HCCH-TOCSY, which correlate side-chain and backbone resonances, but also Lys-selective NMR experiments (Andre et al. 2007; Iwahara et al. 2007). This assignment process is not trivial because rapid hydrogen exchange renders difficulty in 1H detection of NH3+ groups. To mitigate this problem, observation of 1H signals from Lys NH3+ groups often requires the use of relatively low pH and temperature. However, the use of a low temperature can substantially reduce sensitivity of most triple-resonance experiments due to a longer molecular rotational correlation time, and thereby hamper resonance assignment.
Resonance assignment for Lys side-chain NH3+ groups requires long-range correlation spectra because these amino groups are located at the fifth positions (i.e., ζ position) from Cα atoms. Short-range correlations between NH3+ and 1Hε/13Cε resonances are typically insufficient for unambiguous assignment due to poor dispersion of their chemical shifts. While long-range correlation NMR methods such as the 3D (H)CCENH3 (Iwahara et al. 2007) may in principle allow for assignment of Lys NH3+ resonances, this approach can be impractical at low temperatures due to rapid 13C transverse relaxation. In fact, it is well known that rapid 13C transverse relaxation can diminish the efficiency of 13C-13C Hartmann-Hahn cross polarization if a molecular rotational correlation time τr is relatively long (Fischer et al. 1996).
In this paper, we present two distinct approaches to assign Lys side-chain NH3+ groups at a low temperature. One of the approaches is to obtain long-range 15N-13C correlations by taking advantage of very slow 15N transverse relaxation of NH3+ groups. Due to bond rotations along the symmetry axis and cross correlation between three 15N-1H dipole-dipole interactions, NMR relaxation of the in-phase single-quantum term Nx for NH3+ groups is extremely slow and occurs in a bi-exponential manner (Esadze et al. 2011; Zandarashvili et al. 2013). In our previous studies, initial transverse relaxation rates R2,ini for NH3+ groups were in the range between 0.9 and 4.5 s−1 for the systems with τr = 8.5 and 10.8 ns (Anderson et al. 2013; Esadze et al. 2011); the average R2,ini for the Lys side-chain NH3+ groups that directly interact with DNA phosphate groups in the HoxD9 homeodomain-DNA complex was 1.7 s−1 (Anderson et al. 2013), which corresponds to a transverse relaxation time of ~580 ms. Therefore, even a time over one hundred milliseconds can readily be used for15N-13C coherence transfer via J-evoluation between Nx and 2NyCz terms for a relatively small scalar coupling. This coherence transfer is substantially more efficient than coherence transfer via J-evolution from Cx to 2CyNz, because the 15N transverse relaxation of NH3+ groups is far slower than relevant 13C transverse relaxation of CH2 groups.
From this perspective, we have developed the 3D H3NCG experiment (Figure 1), which provides a long-range correlation between 1H/15N resonances of the NH3+ groups and 13Cγ resonance for Lys side chains. This 3D experiment relies on relatively small scalar coupling constants 3JNC between the 15Nζ and 13Cγ nuclei. Absolute values of the 3JNC constants are in a range of 1 – 3 Hz, and depend on Lys χ4 torsion angles, which can undergo dynamic transitions between gauch and trans conformers (Huang and MacKerell 2013; Zandarashvili et al. 2011). Owing to the slow 15N transverse relaxation of NH3+ groups during the coherence transfers between the Nx and 2NyCz terms, the magnetizations of interest survive a total of 200 ms for the evolution of the small 3JNC couplings between the 15Nζ and 13Cγ nuclei in the 3D H3NCG experiment. Because 15N chemical shifts of lysine side-chain NH3+ groups are unique (~33ppm), 15N r-SNOB pulses (Kupče et al. 1995) selective to 15Nζ are used to suppress potentially aliased signals from arginine and backbone 15N nuclei. In this experiment, undesirable coherence transfer between 15Nζ and 13Cε nuclei is avoided by using 13C I-BURP2 pulses (Geen and Freeman 1991) that invert 13Cγ (~25 ppm) but do not affect 13Cε (~42 ppm) nuclei. Although these I-BURP2 pulses also invert 13Cδ (~28 ppm), 2JNCδ coupling constants are undetectably small in lysine side chains (Zandarashvili et al. 2011). Thus, these 15N and 13C shaped pulses permit selective observation of 1Hζ/15Nζ/13Cγ cross peaks from lysine side chains. Using the 3D H3NCECD (Iwahara et al. 2007) and 3D H3NCG spectra, three resonances of 13Cγ, 13Cδ, and 13Cε nuclei can be obtained for each lysine side-chain NH3+ group. Because the 13C-15N coherence transfer in the H3NCG and H3NCECD experiments is not exposed to rapid 13C transverse relaxation, these experiments are more sensitive than the (H)CCENH3 experiment that involves coherence transfer via J-evolution from Cx to 2CyNz. It should also be noted that the H3NCG and H3NCECD experiments with 2H decoupling can be readily performed for perdeuterated proteins. Although deuteration should substantially slow 13C transverse relaxation and therefore improve 13C-13C coherence transfer (Yamazaki et al. 1994), the lack of side-chain 1H nuclei in perdeuterated proteins makes the (H)CCENH3 experiment impractical.
Figure 1.
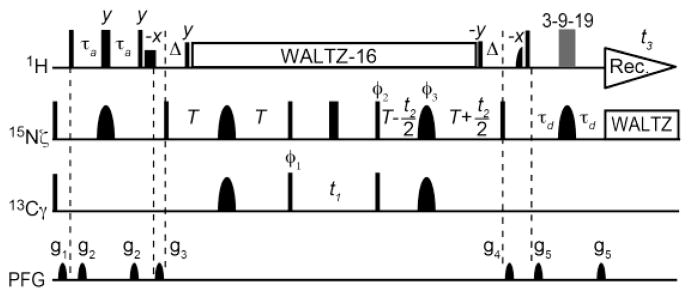
Pulse sequences for the 3D H3NCG experiment for Lys side-chain NH3+ resonance assignment. Thin and bold bars in black represent hard rectangular 90° and 180° pulses, respectively. Unless indicated otherwise, pulse phases are along x. Carrier positions: 1H, the position of the water resonance; 15N, 33 ppm; and 13C, 20 ppm. Short-bold bars represent water-selective soft-rectangular 1H 90° pulses (1.2 ms). The 3-9-19 pulse train-based WATERGATE scheme (Piotto et al. 1992) was used to suppress the water signal. The 13Cγ-selective pulses should not affect 13Cε nuclei (~42ppm). RF strengths for 1H and 15N WALTZ-16 composite pulses (Shaka et al. 1983) were 3.3 kHz and 1.0 kHz, respectively. Shaped pulses: 1H half-Gaussian 90° pulse (2.1 ms); 13C I-BURP2 180° pulse (1.2 ms); and 15N r-SNOB 180° pulse (1.03 ms). Delays: τa = 2.7 ms; δ = 2.6 ms; and T = 50 ms. Phase cycles: ϕ1 = [2x, 2(−x)], ϕ2 = [x, −x], ϕ3 = [4x, 4y], and receiver = [x, −x,−x, x, −x, x, x, −x]. Quadrature detections for indirect 13C and 15N dimensions were achieved using States-TPPI (Marion et al. 1989) for ϕ1 and ϕ2, respectively.
Using a 750-MHz spectrometer, we recorded 3D H3NCG and 3D H3NCECD spectra for the Egr-1 – DNA complex at 10 °C. This complex contains the Egr-1 zinc-finger protein (90 amino acids) and 12-bp DNA with Egr-1’s target sequence. Our group uses the complex to study dynamics in DNA scanning and recognition by Egr-1 (Esadze et al. 2014; Zandarashvili et al. 2012). The Egr-1 zinc-finger protein and 12-bp DNA were purified as previously described (Esadze and Iwahara 2014; Takayama et al. 2010). A 280-μl solution of 0.8 mM complex in a buffer of 20 mM potassium succinate (pH 5.8), 2 mM ZnCl2, and 20 mM KCl was sealed into an inner tube of co-axial NMR tube. To avoid deuterated species of NH3+ groups, D2O for NMR lock was separately sealed in a thin outer layer of the co-axial NMR tube (Iwahara et al. 2007). The relatively low temperature, 10 °C, was required to observed 1H-15N HISQC (Iwahara et al. 2007) cross peaks from all 6 Lys side-chain NH3+ groups of the Egr-1 – DNA complex under these solution conditions. 3D (H)CCENH3 spectrum (Iwahara et al. 2007) recorded at this temperature did not show signals from any Lys residues other than Lys89, which is located at the disordered C-terminal tail (data not shown). Because the (H)CCENH3 experiment involves the 13C-15N coherence transfer schemes via J-evolution from Cx to 2CyNz terms and the 13C-13C cross polarization scheme, rapid 13C transverse relaxation can severely reduce sensitivity at low temperatures. In contrast, the 3D H3NCECD and 3D H3NCG spectra clearly show signals from all Lys side-chain NH3+ groups (Figure 2). As described above, higher sensitivity of these experiments can be attributed largely to efficient 13C-15N coherence transfer via J-evolution from Nx to 2NyCz terms.
Figure 2.

Strips of the 3D H3NCG and H3CECD spectra for all Lys side-chain NH3+ groups of the Egr-1 – DNA complex at 10 °C. Negative contours are shown in green. The 1H and 15N spectral widths for were 18.0 ppm and 4.7 ppm, respectively, in both experiments. The 13C spectral widths were 20.7 ppm in H3NCG and 26.0 ppm in H3NCECD. In each experiment, 32 scans were accumulated per FID, and numbers of complex points for 1H, 13C, and 15N dimensions were 810, 32, and 32, respectively. The total experimental time was 60 hours each. These spectra were recorded at the 1H frequency of 750 MHz using a Bruker Avance III spectrometer equipped with a non-cryogenic TXI probe.
Our second approach to assign lysine side-chain NH3+ resonances at low temperatures is to observe 15Nζ resonances through 1H detection of lysine side-chain CH2 groups at higher temperatures. In this approach, we use a new 2D heteronuclear long-range correlation spectrum, (H2C)N(CC)H-TOCSY, which shows cross peaks of lysine side-chain 15Nζ and CH2 proton resonances. Figure 3 illustrates the pulse sequence for this experiment. Owing to the detection of carbon-attached 1H nuclei, this experiment is not hindered by rapid hydrogen exchange of NH3+ groups, and therefore can be performed using a high temperature at which 13C-13C Hartmann-Hahn cross polarization can occur efficiently. As described previously (Iwahara et al. 2007; Andre et al. 2007), 15N transverse magnetization is maintained to be in-phase with respect to 1H via 1H-WALTZ-16 decoupling so that scalar relaxation due to hydrogen exchange is avoided. Although this experiment can be implemented as a 3D experiment with a 13C dimension, we used the 2D version to achieve a higher resolution in the 15N dimension as well as a higher sensitivity. Figure 4 shows the 2D (H2C)N(CC)H-TOCSY spectrum recorded for the Egr-1 – DNA complex. While rapid hydrogen exchange makes it impossible to detect 1H signals from the Lys NH3+ groups of the Egr-1 – DNA complex at 35 °C, the (H2C)N(CC)H-TOCSY spectrum for the same sample at this temperature exhibited many 1H-15N cross peaks from Lys side chains (Figure 4C). In this spectrum, there was significant variation in signal intensity, presumably because individual Lys side chains exhibit different degrees of relaxation loss, depending on fast internal motions or slow conformational exchange (Foster et al. 1997). Because multiple side-chain 1H resonances are observed at high resolution along the 1H direct-detection dimension with excellent separation by sharp 15Nζ resonances, the (H2C)N(CC)H-TOCSY spectrum greatly facilitates 15Nζ resonances assignment for lysine NH3+ groups. The temperature dependence of the H2(C)N spectra (Andre et al. 2007) allows us to track the change of 15Nζ resonances as a function of temperature (Figure 4B). These data together with the 3D H3NCG and H3NCECD spectra allowed us to unambiguously assign 1H-15N HISQC signals from the Lys NH3+ groups of the Egr-1 – DNA complex at 10 °C (Figure 4A).
Figure 3.

The pulse sequence of the 2D (H2C)N(CC)H-TOCSY experiment. This experiment provides correlation between Lys side-chain 15Nζ and 1H resonances, and corresponds to a hybrid of the H2CN (Andre et al. 2007) and HCCH-TOCSY (Kay et al. 1993) experiments for H2O samples. 13C shaped pulses are Lys 13Cε-selective r-SNOB pulses (980 us). Length of the 13C- spin lock (SL) was 1 ms. 13C carrier position was 43 ppm. The rf strength of the DIPSI-3 scheme (the total length, 16.9 ms) was 9.6 kHz and that of hard 13C pulses was 20.8 kHz. 15N shaped pulses are Lys 15Nζ-selective r-SNOB pulses (1.0 ms). 15N carrier position was 32 ppm. Delays: τ1 = 1.6 ms; τ2 = 1.1 ms; δ = 1.7 ms; and Tc = 20 ms. Phase cycles: ϕ1 = [x, −x]; ϕ2 = [2x, 2(−x)], ϕ3 = [4x, 4y]; ϕ4 = [4x, 4(−x)]; and receiver = [x, −x, −x, x, −y, y, y, −y]. Quadrature detections for indirect 15N dimensions was achieved using States-TPPI for ϕ1.
Figure 4.

Use of 2D (H2C)N(CCH)-TOCSY spectrum and temperature dependence of 2D H2(C)N spectra for assignment of Lys NH3+ groups. The spectra were recorded for 0.8 mM 13C/15N-labeled Egr-1 – DNA complex at pH 5.8. (A) The lysine NH3+-selective HISQC (Iwahara et al. 2007) spectrum recorded at 10 °C. (B) Lysine side-chain-specific H2(C)N (Andre et al. 2007) spectra recorded at 10 °C (black), 18 °C (blue), 27 °C (magenta), and 35 °C (red). (C) (H2C)N(CC)H-TOCSY spectrum recorded at 35 °C. The spectra widths and numbers of complex points: 13.4 ppm and 400 points for 1H; and 2.2 ppm and 50 points for 15N. The mixing time of the 13C DIPSI-3 scheme (Shaka et al. 1988) was 16.9 ms. 1024 scans were accumulated per FID. The total titme to record the 2D (H2C)N(CC)H-TOCSY spectrum was 56 hours. All spectra shown in this figure were recorded with a Bruker Avance III spectrometer equipped with a QCI cryogenic probe operated at the 1H frequency of 600 MHz.
In conclusion, we have presented an effective strategy for resonance assignment of lysine NH3+ groups that can be observed only at relatively low temperatures. Our new approaches can help expand applicability of the NMR methods for characterizing Lys side-chain NH3+ groups (Anderson et al. 2013; Andre et al. 2007; Esadze et al. 2011; Iwahara et al. 2007; Segawa et al. 2008; Tomlinson et al. 2009; Williamson et al. 2013; Zandarashvili et al. 2013; Zandarashvili et al. 2011). As a consequence, dynamics of hydrogen bonds and ion pairs involving Lys side chains may become more assessable for a larger number of proteins and protein complexes.
Acknowledgments
We thank Tianzhi Wang for maintenance of the spectrometers at UTMB NMR facility and Dan Nguyen for language editing. This work was supported by Grant R01GM105931 from the National Institutes of Health (to J.I.).
References
- Anderson KM, Esadze A, Manoharan M, Bruschweiler R, Gorenstein DG, Iwahara J. Direct Observation of the Ion-Pair Dynamics at a Protein-DNA Interface by NMR Spectroscopy. J Am Chem Soc. 2013;135:3613–3619. doi: 10.1021/ja312314b. [DOI] [PMC free article] [PubMed] [Google Scholar]
- Andre I, Linse S, Mulder FA. Residue-specific pKa determination of lysine and arginine side chains by indirect 15N and 13C NMR spectroscopy: application to apo calmodulin. J Am Chem Soc. 2007;129:15805–15813. doi: 10.1021/ja0721824. [DOI] [PubMed] [Google Scholar]
- Blaum BS, Deakin JA, Johansson CM, Herbert AP, Barlow PN, Lyon M, Uhrín D. Lysine and arginine side chains in glycosaminoglycan-protein complexes investigated by NMR, cross-linking, and mass spectrometry: a case study of the factor H-heparin interaction. J Am Chem Soc. 2010;132:6374–81. doi: 10.1021/ja1000517. [DOI] [PubMed] [Google Scholar]
- Esadze A, Iwahara J. Stopped-flow fluorescence kinetic study of protein sliding and intersegment transfer in the target DNA search process. J Mol Biol. 2014;426:230–244. doi: 10.1016/j.jmb.2013.09.019. [DOI] [PMC free article] [PubMed] [Google Scholar]
- Esadze A, Kemme CA, Kolomeisky AB, Iwahara J. Positive and negative impacts of nonspecific sites during target location by a sequence-specific DNA-binding protein: origin of the optimal search at physiological ionic strength. Nucleic Acids Res. 2014;42:7039–46. doi: 10.1093/nar/gku418. [DOI] [PMC free article] [PubMed] [Google Scholar]
- Esadze A, Li DW, Wang T, Brüschweiler R, Iwahara J. Dynamics of lysine side-chain amino groups in a protein studied by heteronuclear 1H-15N NMR spectroscopy. J Am Chem Soc. 2011;133:909–919. doi: 10.1021/ja107847d. [DOI] [PubMed] [Google Scholar]
- Fischer MWF, Zeng L, Zuiderweg ERP. Use of 13C-13C NOE for the assignment of NMR lines of larger labeled proteins at larger magnetic fields. J Am Chem Soc. 1996;118:12457–12458. [Google Scholar]
- Foster MP, Wuttke DS, Radhakrishnan I, Case DA, Gottesfeld JM, Wright PE. Domain packing and dynamics in the DNA complex of the N-terminal zinc fingers of TFIIIA. Nat Struct Biol. 1997;4:605–8. doi: 10.1038/nsb0897-605. [DOI] [PubMed] [Google Scholar]
- Geen H, Freeman R. Band-selective radiofrequency pulses. J Magn Reson. 1991;93:93–141. [Google Scholar]
- Huang J, MacKerell AD., Jr CHARMM36 all-atom additive protein force field: validation based on comparison to NMR data. J Comput Chem. 2013;34:2135–2145. doi: 10.1002/jcc.23354. [DOI] [PMC free article] [PubMed] [Google Scholar]
- Iwahara J, Jung YS, Clore GM. Heteronuclear NMR spectroscopy for lysine NH3 groups in proteins: unique effect of water exchange on 15N transverse relaxation. J Am Chem Soc. 2007;129:2971–2980. doi: 10.1021/ja0683436. [DOI] [PubMed] [Google Scholar]
- Kay LE, Xu GY, Singer AU, Muhandiram DR, Formankay JD. A Gradient-Enhanced HCCH-TOCSY Experiment for Recording Side-Chain 1H and 13C Correlations in H2O Samples of Proteins. J Magn Reson Ser B. 1993;101:333–337. [Google Scholar]
- Kupče E, Boyd J, Campbell ID. Short selective pulses for biochemical applications. J Magn Reson Ser B. 1995;106:300–303. doi: 10.1006/jmrb.1995.1049. [DOI] [PubMed] [Google Scholar]
- Marion D, Ikura M, Tschudin R, Bax A. Rapid Recording of 2d Nmr-Spectra without Phase Cycling - Application to the Study of Hydrogen-Exchange in Proteins. J Magn Reson. 1989;85:393–399. [Google Scholar]
- Piotto M, Saudek V, Sklenár V. Gradient-tailored excitation for single-quantum NMR spectroscopy of aqueous solutions. J Biomol NMR. 1992;2:661–5. doi: 10.1007/BF02192855. [DOI] [PubMed] [Google Scholar]
- Poon DKY, Schubert M, Au J, Okon M, Withers SG, McIntosh LP. Unambiguous determination of the ionization state of a glycoside hydrolase active site lysine by 1H-15N Heteronuclear Correlation Spectroscopy. J Am Chem Soc. 2006;128:15388–9. doi: 10.1021/ja065766z. [DOI] [PubMed] [Google Scholar]
- Segawa T, Kateb F, Duma L, Bodenhausen G, Pelupessy P. Exchange rate constants of invisible protons in proteins determined by NMR spectroscopy. Chembiochem. 2008;9:537–542. doi: 10.1002/cbic.200700600. [DOI] [PubMed] [Google Scholar]
- Shaka AJ, Keeler J, Freeman R. Evaluation of a New Broad-Band Decoupling Sequence - Waltz-16. J Magn Reson. 1983;53:313–340. [Google Scholar]
- Shaka AJ, Lee CJ, Pines A. Iterative Schemes for Bilinear Operators - Application to Spin Decoupling. J Magn Reson. 1988;77:274–293. [Google Scholar]
- Takayama Y, Sahu D, Iwahara J. NMR studies of translocation of the Zif268 protein between its target DNA Sites. Biochemistry. 2010;49:7998–8005. doi: 10.1021/bi100962h. [DOI] [PubMed] [Google Scholar]
- Tomlinson JH, Ullah S, Hansen PE, Williamson MP. Characterization of salt bridges to lysines in the protein G B1 domain. J Am Chem Soc. 2009;131:4674–4684. doi: 10.1021/ja808223p. [DOI] [PubMed] [Google Scholar]
- Williamson MP, Hounslow AM, Ford J, Fowler K, Hebditch M, Hansen PE. Detection of salt bridges to lysines in solution in barnase. Chem Commun. 2013;49:9824–9826. doi: 10.1039/c3cc45602a. [DOI] [PubMed] [Google Scholar]
- Yamazaki T, Lee W, Arrowsmith CH, Muhandiram DR, Kay LE. A suite of triple resonance NMR experiments for the backbone assignment of 15N, 13C, 2H labeled proteins with high sensitivity. J Am Chem Soc. 1994;116:11655–66. [Google Scholar]
- Zandarashvili L, Esadze A, Iwahara J. NMR studies on the dynamics of hydrogen bonds and ion pairs involving lysine side chains of proteins. Adv Protein Chem Struct Biol. 2013;93:37–80. doi: 10.1016/B978-0-12-416596-0.00002-6. [DOI] [PubMed] [Google Scholar]
- Zandarashvili L, Li DW, Wang T, Brüschweiler R, Iwahara J. Signature of mobile hydrogen bonding of lysine side chains from long-range 15N-13C scalar J-couplings and computation. J Am Chem Soc. 2011;133:9192–9195. doi: 10.1021/ja202219n. [DOI] [PubMed] [Google Scholar]
- Zandarashvili L, Vuzman D, Esadze A, Takayama Y, Sahu D, Levy Y, Iwahara J. Asymmetrical roles of zinc fingers in dynamic DNA-scanning process by the inducible transcription factor Egr-1. Proc Natl Acad Sci U S A. 2012;109:E1724–1732. doi: 10.1073/pnas.1121500109. [DOI] [PMC free article] [PubMed] [Google Scholar]