

Abstract
The human brain demonstrates functional specialization, including strong hemispheric asymmetries. Here specialization was explored using fMRI by examining the degree to which brain networks preferentially interact with ipsilateral as opposed to contralateral networks. Preferential within-hemisphere interaction was prominent in the heteromodal association cortices and minimal in the sensorimotor cortices. The frontoparietal control network exhibited strong within-hemisphere interactions but with distinct patterns in each hemisphere. The frontoparietal control network preferentially coupled to the default network and language-related regions in the left hemisphere but to attention networks in the right hemisphere. This arrangement may facilitate control of processing functions that are lateralized. Moreover, the regions most linked to asymmetric specialization also display the highest degree of evolutionary cortical expansion. Functional specialization that emphasizes processing within a hemisphere may allow the expanded hominin brain to minimize between-hemisphere connectivity and distribute domain-specific processing functions.
Keywords: asymmetry, cognitive control, default mode, fMRI, functional connectivity, lateralization
Introduction
Hemispheric specialization is an organizing principle of the human brain that is hypothesized to contribute to fast, efficient information processing (Levy, 1969; Ringo et al., 1994). The lateralization of brain function has been investigated through study of lateralized brain lesions (Milner, 1971), split-brain patients (Gazzaniga, 2000), sodium amytal injection (Wada and Rasmussen, 1960), intraoperative brain stimulation (Penfield and Jasper, 1954), and neuroimaging (Petersen et al., 1989; Desmond et al., 1995). Brain expansion during evolution may contribute to hemispheric specialization, although direct evidence relating hemispheric specialization to size expansion is lacking. The human brain is triple the size of modern great apes (Preuss, 2011; Sherwood et al., 2012). The cost of maintaining the physical connections and the pressure for speed of signal transmission both increase with brain volume. Hemispheric specialization therefore may be the outcome of “competitive criteria of minimizing wiring cost and maximizing adaptive value,” a mechanism that might have also led to the small-world properties of human brain network, including high clustering and high global efficiency (Achard and Bullmore, 2007; Bullmore and Sporns, 2012).
How brain systems supporting the specialization of functions interact with each other remains an open question (Bishop, 2013; Cai et al., 2013). Insight into these interactions may suggest how specialization arises. Specifically, an open question about hemispheric specialization concerns how distinct processing domains are controlled. Is there an integrated control system that interacts with lateralized systems across both hemispheres? Or does the human brain have multiple control systems that are specialized within the separate hemispheres?
Recent studies suggest that the frontoparietal control network (FPN) might flexibly couple with either the default network or the attention network (Vincent et al., 2008; Spreng et al., 2010), two antagonistic systems (Fox et al., 2005; Fransson, 2005) hypothesized by some to support internally and externally directed cognition (Buckner et al., 2008; Andrews-Hanna, 2012). The role of FPN is particularly intriguing as it is suggested to be an evolutionarily novel (Mantini et al., 2013) or expanded (Buckner and Krienen, 2013) network in humans. Studies examining functional connectivity have observed that the FPN is asymmetrically organized (e.g., Habas et al., 2009).
Characterizing the lateralized functional organization of the FPN may thus provide important insights into understanding the functional lateralization more broadly. One possible arrangement might be for networks involved in cognitive control to become functionally specialized between the two hemispheres by differentially interacting with separate networks. This hypothesis leads to a counterintuitive prediction: functionally dissociable left-lateralized and right-lateralized portions of the FPN may each contribute to a different set of lateralized functions through how they interact with distinct networks. This possibility suggests a specific mechanism by which lateralized function may arise. The idea is that lateralized function may arise by how specific regions, and networks, are embedded within broader distributed arrangements of networks in addition to more local specialization within the regions and networks themselves.
To explore these questions, we quantified hemispheric specialization across the entire brain in the same individuals, enabling the investigation of interactions between asymmetrically organized networks.
Materials and Methods
Participants.
Data were acquired as part of the Brain Genomics Superstruct Project with informed consent. Participants were enrolled by multiple local laboratories all acquiring similar data on four matched 3-Tesla MRI scanners (one at Harvard and three at the Massachusetts General Hospital). Two datasets with a total of 1006 young healthy participants were used in the present study. The first dataset consisted of 1000 individuals (mean age 21.3 ± 3.1 years; 42.7% male; 90.9% right-handed); each performed one or two resting-state fMRI runs (6 m 12 s per run, mean = 1.7 ± 0.46 runs) during eyes open rest. A total of 1000 subjects were divided into two independent subsamples that were matched for age, sex, and MRI scanner (n = 500 for each; labeled as the Discovery and Replication samples). The second dataset was acquired from 55 subjects (mean age 21.1 ± 2.7 years; 45.5% male; 72.7% right-handed, 49 subjects were included in the first dataset) who performed a semantic classification task (Desmond et al., 1995). Among the 1006 participants, 593 were scanned at Harvard and 413 were scanned at Massachusetts General Hospital (269, 124, and 20 subjects were scanned with these three scanners, respectively). These data have been reported previously (Buckner et al., 2011; Yeo et al., 2011; Choi et al., 2012; Wang et al., 2013).
Resting-state fMRI data acquisition and preprocessing.
Resting-state fMRI data were collected on four matched 3T Tim Trio scanners. These scanners were matched in type (Siemens Tim Trio), coil (12-channel phased-array head coil), and run with identical sequences. Images were acquired using a gradient-echo echo-planar pulse sequence sensitive to BOLD contrast (TR = 3000 ms, TE = 30 ms, flip angle = 85°, 3 mm × 3 mm × 3 mm voxels, FOV = 216 and 47 slices collected with interleaved acquisition with no gap between slices). Whole-brain coverage included the entire cerebellum. Subjects were instructed to stay awake, keep their eyes open, and minimize head movement; no other task instruction was provided.
Resting-state fMRI data were processed using previously described procedures (Buckner et al., 2011; Yeo et al., 2011) that were adapted from Fox et al. (2005) and Van Dijk et al. (2010). The following steps were performed: (1) slice timing correction (SPM2, Wellcome Department of Cognitive Neurology, London); (2) rigid body correction for head motion with the FSL package (Jenkinson et al., 2002; Smith et al., 2004); (3) normalization for global mean signal intensity across runs; and (4) low-pass temporal filtering, head motion regression, and ventricular and white matter signal regression. Whole-brain signal regression was also included in the processing stream, which can improve the correction of motion related artifacts (Satterthwaite et al., 2013; Yan et al., 2013). All subjects included in this study had met the quality control criterion of slice-based temporal signal-to-noise ratio >100 (Van Dijk et al., 2012). Head motion is an important issue in resting-state fMRI data processing, which not only causes artifacts but can also reflect a neurobiological trait effect (Zeng et al., 2014). In the present study, we did not remove the image frames based on head motion because our recent exploration indicated that the data scrubbing might cause inflated connectivity estimates in specific regions (Zeng et al., 2014).
The structural data were processed using the FreeSurfer version 4.5.0 software package as described by Yeo et al. (2011). The structural and functional images were aligned using boundary-based registration (Greve and Fischl, 2009) within the FsFast software package (http://surfer.nmr.mgh.harvard.edu/fswiki/FsFast). The resting-state BOLD fMRI data were aligned to a spherical coordinate system via sampling from the cortical ribbon in a single interpolation (Yeo et al., 2011).
The cerebral signal and cerebellar signal were aligned to the FreeSurfer fsaverage5 surface and volumetric templates using a hybrid surface- and volume-based approach (Buckner et al., 2011). The cerebral cortex was modeled as a surface as described by Yeo et al. (2011), and the cerebellum was aligned using nonlinear volumetric registration as described by Buckner et al. (2011). The surface template of the cerebral cortex (FreeSurfer fsaverage5) consists of 10,242 vertices in each hemisphere. The volumetric template has 2 mm isotropic resolution and consists of 14,888 voxels in the left cerebellar hemisphere and 15,250 voxels in the right cerebellar hemisphere.
Hemispheric Autonomy Index (AI).
Functional connectivity was estimated based on the BOLD measures of resting state brain activity acquired by fMRI (Biswal et al., 1995; Fox and Raichle, 2007; for recent discussion of the technique and its limitations, see Buckner et al., 2013 and Murphy et al., 2013). To compute the AI in the cerebral cortex, each vertex on the brain surface was taken as an ROI. To compute the AI in the cerebellum, each voxel in the cerebellum mask was defined as an ROI. The quantification of cerebellar AI was independent of the cerebral cortex.
For each seed ROI, the degree of within-hemisphere connectivity and cross-hemisphere connectivity was first computed by summing up the number of vertices (or voxels) correlated to the seed in the ipsilateral hemisphere and in the contralateral hemisphere, respectively (see Fig. 1). The degree of within- and cross-hemisphere connectivity was then normalized by the total number of vertices (or voxels) in the corresponding hemisphere. This normalization accounts for the influence of potential brain size asymmetry between two hemispheres. AI was calculated as the difference between the normalized within-hemisphere connectivity and the normalized cross-hemisphere connectivity according to Equation 1 as follows:
where Ni and Nc are the numbers of vertices (or voxels) correlated to the seed in the ipsi-lateral hemisphere and contralateral hemisphere, respectively. Hi and Hc are the total number of vertices (or voxels) in the ipsilateral and contralateral hemisphere, respectively. AI was computed for each vertex (or voxel) in the brain. To estimate the specialization of specific functional networks, AI was then averaged within the boundary of each network.
Figure 1.

Degree of within-hemispheric connectivity and cross-hemispheric connectivity estimated in 1000 healthy subjects. The maps were based on the correlation threshold of 0.25. The difference map (the third row) indicates that within-hemispheric connectivity is much stronger than cross-hemispheric connectivity in the association areas.
Estimating language lateralization.
Fifty-five subjects each performed three task-based fMRI runs of an abstract/concrete semantic classification task (Demb et al., 1995; Desmond et al., 1995). Previous studies have indicated that semantic processing of single words, either visually or aurally presented, activates brain regions that are strongly lateralized. Furthermore, lateralization of the task-evoked responses have demonstrated a significant correlation with language lateralization determined by the WADA test (Desmond et al., 1995; Binder et al., 1996), suggesting that this single-word processing task may reflect language lateralization to some extent, although it should be emphasized that this task targets only one component of language processing and not language function as a whole.
Our design manipulated familiarity to isolate regions specifically involved in controlled semantic retrieval. During a prescan familiarization phase, subjects repeatedly classified the same four words (two abstract and two concrete) for five repetitions. During the scan, each run consisted of three 30 s “novel” blocks of task, three 30 s “familiar” blocks, and seven 24 s blocks of passive visual fixation. In each novel block, 10 novel words (five concrete and five abstract words in random order) were presented for 2 s with 1 s interstimulus interval. In the familiar block, the four practiced words were presented repeatedly. The subject's task was to indicate whether each word was concrete or abstract independent of novelty. In total, 60 novel words and 4 familiar words were used. Participants were instructed to respond by pressing a single key with the index finger of each hand. The MRI data acquisition parameters were identical to the resting-state scan described above, except that 124 time points were acquired in each task run. Data were first analyzed using the general linear model in participants' native fMRI space. Brain regions participating in controlled semantic retrieval were isolated by contrasting the novel versus familiar conditions. The language laterality index was calculated for each individual based on the asymmetric activations in two hemispheres using the approach of Binder et al. (1996).
Definition of the functional networks.
The cerebral cortex and the cerebellum have been parcellated into seven functional networks based on the 1000 subjects using a clustering approach (Yeo et al., 2011, 2013; Power et al., 2011). Cortical networks were defined as sets of cortical regions with similar profiles of corticocortical functional connectivity. The connectivity profile of a cortical region was defined as its functional coupling to 1175 ROI vertices. The 1175 ROI vertices were uniformly sampled in FreeSurfer surface space and consisted of single vertices spaced ∼16 mm apart. For each subject, the Pearson's product moment correlation was computed between the fMRI time series at each spatial location (18,715 vertices) and the 1175 ROI vertices. Each spatial location is therefore characterized by its functional coupling to the 1175 ROI vertices. A clustering algorithm was then applied to estimate networks of cortical regions with similar connectivity profiles.
The cerebellar networks were then defined based on the cerebral networks. Each voxel in the cerebellum was labeled as a member of a particular network if it had maximal functional correlation with the cerebral network (Buckner et al., 2011). Using the cerebellar networks defined based on cerebrocerebellar connections allowed us to explore whether the cerebellar regions connected to the cerebral networks possess hemispheric specialization patterns parallel to those observed in cerebral regions. However, it should be noted that the cerebellar cortex, particularly the intermediate zone, is the target of substantial ascending pathways that originate in the spinal cord. The cerebellar network definition based on cerebrocerebellar connections did not include these ascending pathways, and some important features of cerebellar organization might have been missed. This incompleteness and other limitations of the cerebellar parcellation are discussed in Buckner et al. (2011). Nonetheless, it serves as an adequate parcellation of the cerebellum in relation to cerebral zones to be informative for the present analyses.
Correlation to evolutionary cortical expansion.
The map of regional evolutionary cortical expansion between an adult macaque and the average human adult PALS-B12 atlas was provided by Van Essen and Dierker (2007) and Hill et al. (2010a). This map projects data onto the right hemisphere, but the estimate can be considered representative of the two hemispheres.
To produce Figure 9, data in the right hemisphere were projected to the Conte69 164k_fs_LR mesh (Van Essen et al., 2012) (http://sumsdb.wustl.edu/sums/directory.do?id=8291494&dir_name=CONTE69). The data were extracted using the Caret Surface Statistics Toolbox for the correlation analysis. The absolute expansion ratio was normalized by taking the logarithm and subtracted with a constant. Correlations between AI and cortical expansion (see Fig. 9) were computed at the whole hemisphere level. To test the potential impact of spatial dependence between neighboring vertices on these correlation analyses, we performed a repeated (n = 1000) random sampling of 7% of the vertices and computed the correlation coefficient on the subsets of the vertices. For each subset, the Durbin–Watson test was performed to estimate the spatial dependence (DW > 2). Correlation coefficients were averaged across the 1000 iterations. We also computed the Type I error rate of this correlation using the permutation test.
Figure 9.
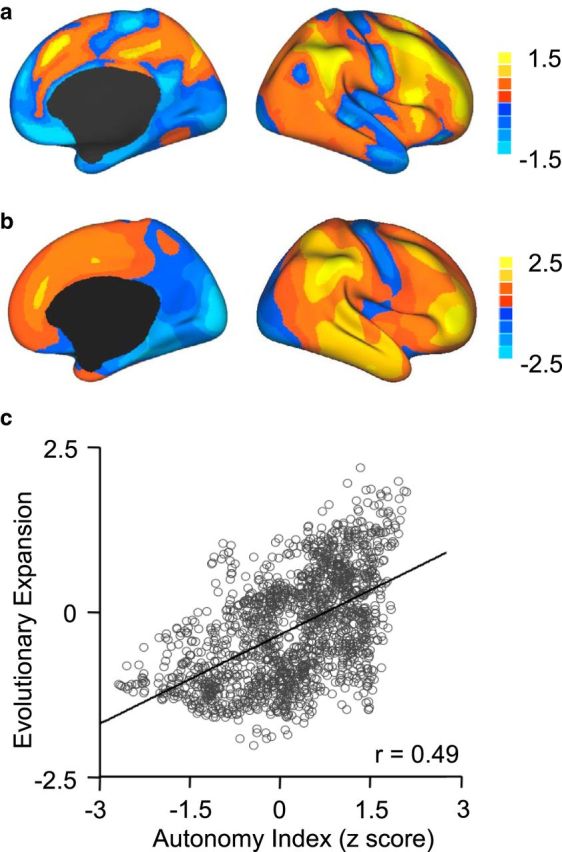
Comparison of hemispheric specialization (a) and evolutionary cortical expansion (b). Evolutionary cortical expansion was estimated from the comparison between an adult macaque and the average human adult PALS-B12 atlas. Data were provided by Van Essen and Dierker (2007) and Hill et al. (2010a). Results are displayed for the right hemisphere. At the whole-brain level, hemispheric specialization tracks evolutionary cortical expansion (Spearman rank correlation r = 0.49, p < 0.001). The correlation between AI and cortical expansion is shown in the scatter plot, where each 100th vertex on the brain surface is represented by a small circle (c).
Results
Prominent hemispheric specialization of association cortices
To quantify functional specialization of the human brain, a functional AI, defined as the difference between the degree of within-hemispheric and cross-hemispheric functional connectivity, was computed at each vertex of the brain surface. Some regions showed particularly strong difference between within-hemispheric and cross-hemispheric connectivity (Fig. 1). For example, based on a correlation threshold of 0.25, a vertex in the left inferior parietal lobule coupled to >1900 vertices within the left hemispheric but only to 1300 vertices in the right hemisphere (each hemisphere has 10,242 vertices). This difference between within-hemispheric and cross-hemispheric connectivity degree is 6% of the entire hemisphere and will correspond to a strong AI value of 6%.
AI was first calculated in the Discovery sample (N = 500) and then replicated in the independent Replication sample (N = 500). The specialization distribution maps derived from these two samples were highly correlated (Spearman rank correlation r > 0.99, p < 0.001 for both hemispheres). Strong hemispheric specialization was observed in the association cortices, including the lateral prefrontal, inferior parietal, and temporal regions (Fig. 2). Visual, somatosensory, and motor cortices exhibited minimal hemispheric specialization.
Figure 2.

Functional autonomy, defined as the difference between within- and cross-hemispheric connectivity, is displayed for the Discovery (N = 500) and Replication (N = 500) samples. Each individual brain was registered nonlinearly to the FreeSurfer surface template, which has 10,242 vertices in each hemisphere. Autonomy indices were computed at each vertex by subtracting the degree of cross-hemisphere connectivity from within-hemisphere connectivity (see Eq. 1) The connectivity degree was normalized by the total number of vertices in each hemisphere; therefore, the AI is denoted as a percentage. Regions with higher within-hemisphere connectivity than cross-hemisphere connectivity are shown in warm colors. Regions with higher cross-hemispheric connectivity are shown in cold colors. In the left hemisphere, strong autonomy was observed in inferior prefrontal and temporal regions overlapping with traditional language processing regions (see arrows). In the right hemisphere, strong autonomy was observed in lateral frontal, insula, and angular gyrus regions that are associated with attention (see arrows). Minimal autonomy was found in the sensorimotor, auditory, and visual cortices. The patterns of hemispheric autonomy largely replicate between the Discovery and Replication samples and are insensitive to the selection of correlation threshold.
Of most interest, hemispheric specialization in the two hemispheres demonstrated different patterns. In the left hemisphere, strong specialization was observed in inferior prefrontal and temporal regions overlapping the default network and regions traditionally associated with language. In the right hemisphere, strong specialization was observed in the insula, angular gyrus and supramarginal gyrus that overlap with regions involved in attention. A third pattern was also noted: portions of the prefrontal cortex and inferior parietal lobule that overlap with regions implicated in cognitive control (e.g., the FPN) showed strong specialization in both hemispheres.
Hemispheric specialization estimated during rest predicts language lateralization during task
To explore the relation between hemispheric specialization estimated by AI and traditional task-based estimates of lateralization, we examined task data from 55 subjects. The task design manipulated familiarity to isolate regions specifically involved in controlled semantic retrieval (see Materials and Methods). Task-based language lateralization was calculated for each subject using the approach previously described (Binder et al., 1996).
The AI of each subject was normalized and averaged within a mask of the most specialized regions derived from the 1000 subjects (Fig. 3a). A significant correlation (Spearman rank correlation r = 0.47, p < 0.001) was found between left hemisphere AI and the language lateralization index (Fig. 3), indicating a moderate relation between intrinsic hemispheric specialization and language lateralization. Although the correlation was substantially driven by the subjects with atypical language lateralization (Spearman rank correlation r = 0.30, p < 0.05 if these subjects were excluded), the individuals with the lowest left hemisphere AI all demonstrated bilateral or reversed language lateralization during the language task. These atypical lateralization patterns were manifested both in the cerebral cortex and the cerebellum (Fig. 4).
Figure 3.
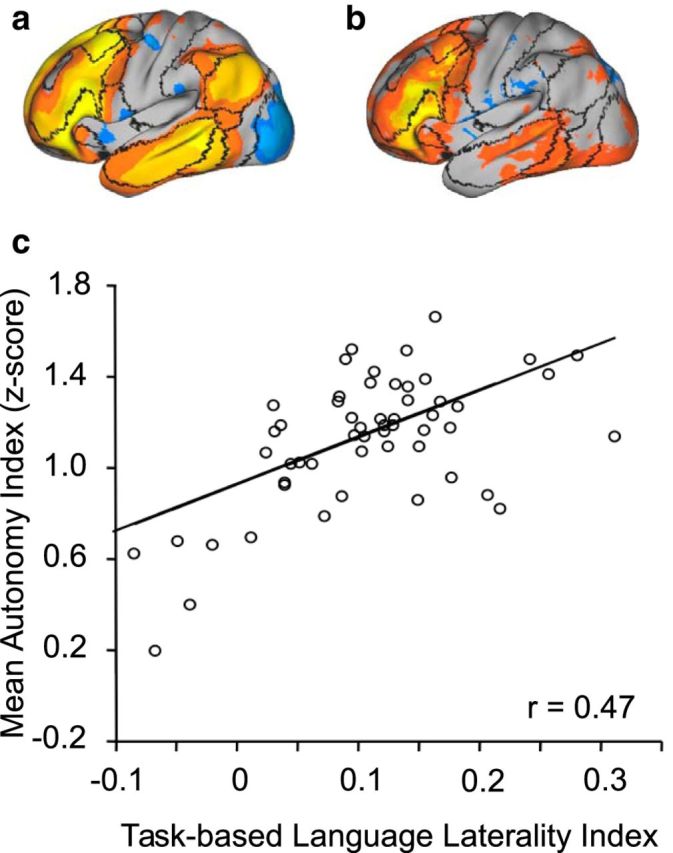
Intrinsic hemispheric specialization during rest predicts language lateralization during task. The regions showing strongest autonomy in the 1000 subjects (a) and the regions activated by a semantic decision task (modified from Desmond et al., 1995) in 55 subjects (b) are plotted on the brain surface, with boundaries of functional connectivity networks from Yeo et al. (2011), illustrated by black lines (for the networks, also see Fig. 5). The regions showing strong autonomy (>6%) in the left hemisphere were taken as a mask. The AI within the mask was then averaged for each subject. A task-based language lateralization index was calculated for each subject based on the asymmetric activation in the two hemispheres. A significant correlation (Spearman rank correlation r = 0.47, p < 0.001) was found between the AI and language lateralization (c), indicating that intrinsic hemispheric specialization was associated with language lateralization during task.
Figure 4.

Regions activated in the semantic decision task are displayed for 8 subjects to elaborate the results in Figure 3. The left hemisphere autonomy and language lateralization indices are displayed at the upper left and right corner of each panel, respectively. Two subjects with strong left hemisphere autonomy show language activation along the left inferior prefrontal gyrus, as well as in the right Crus I/II of cerebellum (a, b). Six subjects with the lowest left hemisphere autonomy either show bilateral task activation in both cerebrum and cerebellum (c, e, f, g) or lateralized activation in the right inferior prefrontal cortex and the left cerebellum (d, h).
Frontoparietal control network is specialized in both hemispheres
Using the estimates of hemispheric autonomy, the relative specialization of networks was assessed. For this analysis, the cerebral cortex was first parcellated into seven functional networks using a clustering approach previously described (Yeo et al., 2011), including the FPN, ventral and dorsal attention, default, limbic, sensorimotor, and visual networks. Specialization of a network was then estimated by averaging AI within the boundary of the network in each hemisphere.
The degree of specialization significantly differed across functional networks. A ranking of the networks according to AI indicated that the default network and FPN were among the most specialized in the left hemisphere, whereas visual, ventral attention, and sensorimotor networks were least specialized (Fig. 5a). Functional specialization in the right hemisphere exhibited a different pattern. Whereas the FPN was again among the most specialized networks, the ventral attention and dorsal attention networks demonstrated particularly strong specialization in the right hemisphere (Fig. 5b). The heterogeneity of specialization across networks was supported by the significant difference between almost any two networks (Wilcoxon signed rank test, p < 0.0001 for all comparisons except that p > 0.3 for the comparison between dorsal and ventral attention networks in the right hemisphere).
Figure 5.

Hemispheric specialization was quantified across seven cerebral networks in the left (a) and right (b) hemispheres. The analysis was based on our prior parcellation of the cerebrum (Yeo et al., 2011) into seven functional networks (a & b; top right), namely, the FPN, vATN, dATN, DN, limbic (LMB), sensorimotor (Mot), and visual (Vis) networks. The AI values were plotted on the brain surface (a & b; top left) with boundaries of functional connectivity networks illustrated by black lines. The autonomy indices from 1000 subjects were averaged within each network within each hemisphere. The bars illustrate mean AI in these networks with SE. Strong specialization was found in the left DN and FPN. In the right hemisphere, strong specialization was also seen in the FPN, along with the attention networks.
Parallel hemispheric specialization in the cerebellum and cerebral cortex
We have previously demonstrated that the cerebellum possesses an approximately homotopic map of the cerebral cortex, including the prominent asymmetries of the association cortex (Buckner et al., 2011; Wang et al., 2013). Therefore, the gradient of hemispheric specialization observed in the cerebral networks might be expected in the cerebellum. To test this hypothesis, the AI was estimated in the cerebellum (14,888 voxels in the left cerebellar hemisphere and 15,250 voxels in the right cerebellar hemisphere) based on within- and cross-hemispheric functional coupling independent of the cerebral cortex (see Materials and Methods). Regions with the strongest specialization were localized mainly in the posterior Crus I/II in the right hemisphere, and the lobules VI, VIIB, anterior portion of Crus I/II in the left hemisphere (Fig. 6). Functional autonomy was then quantified in seven cerebellar networks described by Buckner et al. (2011). In the right cerebellar hemisphere, strong autonomy was observed in regions linked to the default network and the FPN. In the left cerebellar hemisphere, the strongest autonomy was found in regions linked to the FPN and attention networks. The results are consistent with the autonomy distribution across cerebral networks but in the contralateral hemisphere (Fig. 7).
Figure 6.
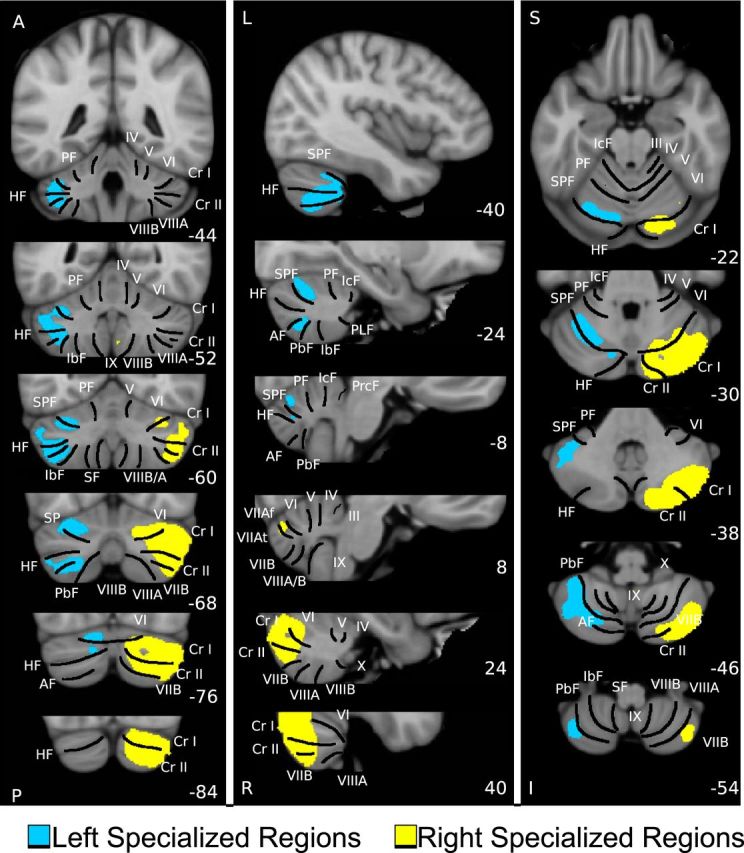
A map of intrinsic hemispheric autonomy in the human cerebellum based on 1000 individuals. Individual cerebellar volumes were nonlinearly registered to the FreeSurfer template (voxel size: 2 mm × 2 mm × 2 mm; 14,888 voxels in left hemisphere and 15,250 voxels in right hemisphere). Autonomy was calculated based on within- and cross-hemispheric functional coupling within the cerebellum, independent of the cerebral cortex. Regions with strongest autonomy were localized mainly in the right posterior Crus I/II (yellow), as well as the left lobules VI, VIIB, and the left anterior portion of Crus I/II (blue). The sections display coronal (left), sagittal (middle), and transverse (right) images. Major fissures are demarcated on the left, and lobules are labeled on the right (Buckner et al., 2011; Wang et al., 2013). PF, Primary fissure; SPF, superior posterior fissure; HF, horizontal fissure; AF, ansoparamedian fissure; PbF, prepyramidal/prebiventer fissure; IbF, intrabiventer fissure; SF, secondary fissure. IcF, intraculminate fissure; PLF, posterolateral fissure; PrcF, preculminate fissure; A, anterior; P, posterior; L, left; R, right; S, superior; I, inferior. The coordinates at the bottom right of each panel represent the section level in the MNI atlas space.
Figure 7.

Functional autonomy was quantified in seven cerebellar networks in the right hemisphere (a) and left hemisphere (b). The computation of cerebellar specialization was independent of the cerebral cortex. The cerebellar segmentation based on coupling to cerebral networks from Buckner et al. (2011) is displayed in the bottom row. Each color in the cerebellar segmentation indicates which cerebral network shows the greatest coupling. In the right cerebellar hemisphere, strong autonomy was observed in regions linked to the DN and FPN. In the left cerebellar hemisphere, strongest autonomy was found in regions linked to the FPN and attention networks. The results are highly consistent with the autonomy distribution across cerebral networks but in the contralateral hemisphere (for a comparison, see Fig. 5). Note that the visual signal from the cerebrum was regressed from the cerebellum to mitigate partial volume effects.
These results indicated that hemispheric specialization in the cerebellum parallels that of the cerebral cortex. The consistent ranking pattern observed in the cerebellum, but in the contralateral hemisphere, also suggests that the distribution is unlikely the result of technical confounds, including misalignment. Technical artifacts and template misalignments between the hemispheres are not expected to be the same across the cerebrum and cerebellum (Wang et al., 2013).
Specialization of frontoparietal control network is coupled with different networks in the two hemispheres
To investigate the relation between the FPN, which was specialized in both hemispheres, and the other networks, AI values for each of the seven networks were correlated across the 1000 subjects (Fig. 8). The idea behind this analysis is that individual differences in network coupling strength might provide information about how the distinct networks are interacting. In the left hemisphere, the strongest correlation was found between the AI of FPN and the default network (Spearman rank correlation r = 0.42), whereas AI of FPN and attention networks (dorsal attention and ventral attention) showed weaker correlation (Spearman rank correlation r = 0.37 between FPN and dorsal attention network; ANCOVA, p < 0.005 for the comparison of regression slopes; Spearman rank correlation r = 0.14 between FPN and ventral attention network; p < 0.001 for the comparison of regression slopes). However, in the right hemisphere, the AI revealed the strongest correlation between the FPN and both attention networks (Spearman rank correlation r = 0.47 with the dorsal attention and Spearman rank correlation r = 0.44 with the ventral attention networks) but a slightly weaker correlation with the default network (Spearman rank correlation r = 0.36 with the default network; ANCOVA, p < 0.005 for both comparisons of the regression slopes). These correlation patterns support the hypothesis that the FPN is differentially specialized in the two hemispheres being strongly coupled with the default network in the left hemisphere and strongly coupled with attention networks in the right hemisphere.
Figure 8.
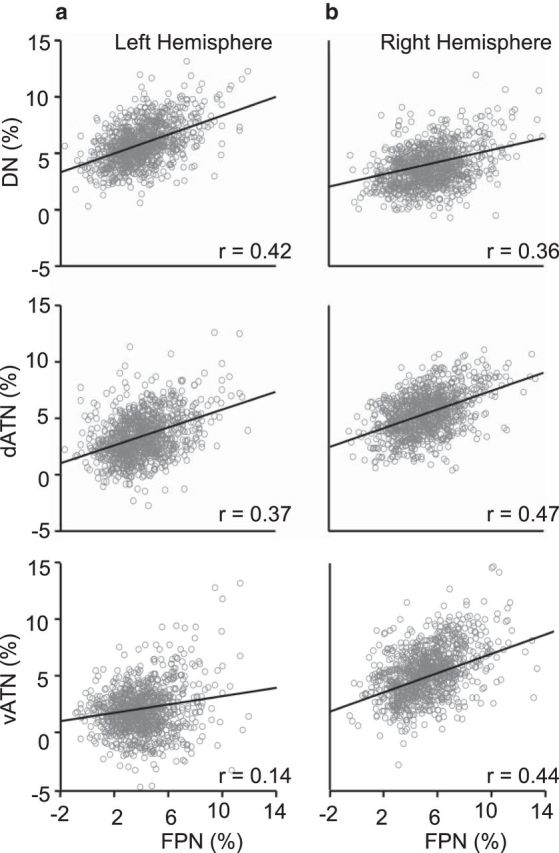
Specialization of the FPN is preferentially coupled with different networks in two hemispheres. In the left hemisphere, a significant correlation was found between the autonomy in the FPN and the default network (Spearman rank correlation r = 0.42), but weaker correlations between the FPN and the attention networks (r = 0.37 with dATN and r = 0.14 with vATN; ANCOVA, p < 0.005 and p < 0.001 for the comparison of regression slopes, respectively). In the right hemisphere, autonomy in the FPN showed strongest correlation with the attention network (r = 0.47 with dATN and r = 0.44 with vATN) but a weaker correlation with the default network (r = 0.36; ANCOVA, p < 0.005 for both comparisons of the regression slopes). The different correlation patterns in two hemispheres suggest that subdivisions of FPN are specialized in each hemisphere.
Hemispheric specialization is spatially correlated with estimated evolutionary cortical expansion
To explore whether regions displaying hemispheric specialization are disproportionately expanded in humans compared with nonhuman primates with smaller brains, we directly compared the specialization measured by AI with a map of estimated regional evolutionary expansion derived from the comparison between macaques and humans (Van Essen and Dierker, 2007; Hill et al., 2010a) (http://sumsdb.wustl.edu/sums/directory.do?id=7601585). A moderate correlation (Spearman rank correlation r = 0.49, p < 0.001) between hemispheric specialization and evolutionary cortical expansion was observed (Fig. 9).
Control analyses
To investigate how much the hemispheric specialization pattern shown in Figure 2 is dependent on the selection of correlation thresholds, we computed the specialization maps based on 10 different thresholds (from r = 0.1 to r = 0.55 in 0.05 increments). It is expected that correlation threshold will affect the absolute values of connectivity degree (i.e., number of vertices exceeding a given threshold will necessarily change); however, the impact of threshold is similar on within-hemisphere and cross-hemisphere connectivity. Therefore, the absolute AI values decrease with higher threshold, but the spatial distribution of AI remains relatively stable. The normalized specialization maps (z-transformed) are shown in Figure 10a. The Spearman rank correlation coefficients among these 10 maps range from 0.73 to 0.99, indicating that the distribution of specialization is relatively insensitive to the selection of thresholds. Similarly, we computed the cerebellar specialization based on five different thresholds (from r = 0.1 to r = 0.3 in 0.05 increments). The spatial distribution of the cerebellar specialization was also found to be relatively insensitive to the selection of correlation threshold (Fig. 10b).
Figure 10.
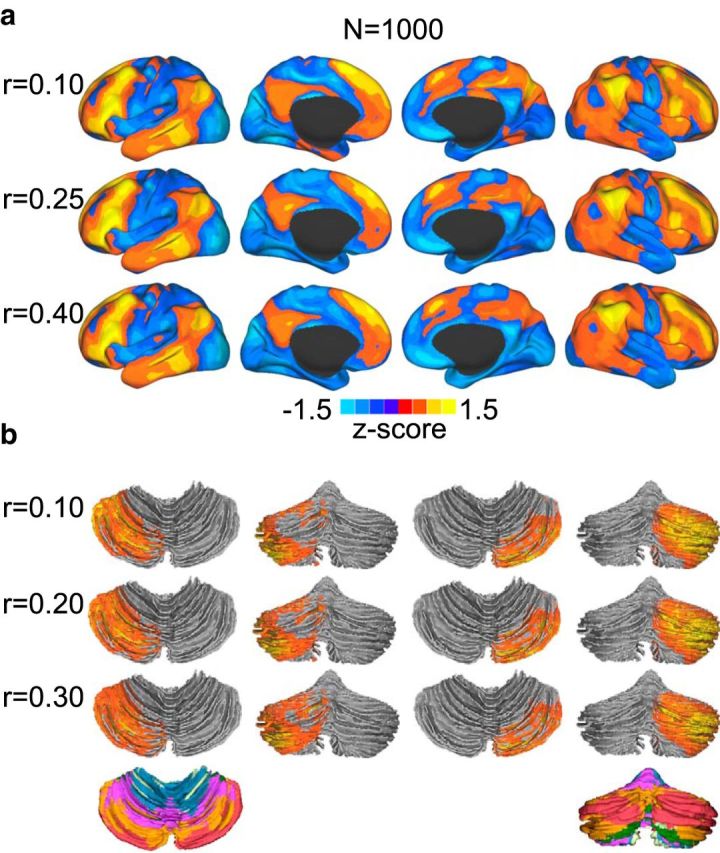
Spatial distribution of hemispheric specialization map is insensitive to the selection of correlation threshold. Specialization maps were computed based on 10 different thresholds (from r = 0.1 to r = 0.55 at the increment of 0.05). The Spearman rank correlations among these maps range from 0.73 to 0.99, indicating that the specialization patterns are relatively insensitive to the selection of thresholds. The specialization maps corresponding to three thresholds were normalized (z-transformed) and displayed (a). Spatial distribution of hemispheric specialization in the cerebellum is also insensitive to the selection of correlation threshold. Specialization maps were computed based on five different thresholds (from r = 0.1 to r = 0.3 at the increment of 0.05). The specialization maps were normalized (z-transformed) and displayed (b).
To investigate how much the specialization pattern shown in Figure 2 is influenced by the folding variability, we computed the intersubject variability of sulcal depth, which could serve as a proxy of cortical folding patterns. The sulcal depth variability was then used as a nuisance regressor. We found that the sulcal depth variability partially overlapped with the specialization map in frontal and parietal areas and had a modest correlation with specialization (Spearman rank correlation r = 0.26). However, the specialization distribution was not dominated by sulcal depth variability. After regressing out sulcal depth variability, the specialization map only changed slightly (mainly in lateral parietal regions). The ranking across different functional networks remained unchanged.
To explore the possibility that the correlation patterns observed in Figure 8 were confounded by the anatomical adjacency among networks, the network boundaries were eroded by 6 mm; thus, a set of core regions were derived for the FPN, default and attention networks that would be less affected by spatial blurring at the borders of networks. The correlation analyses were then repeated based on these core regions that were well separated from each other (at least 12 mm apart because each network was eroded by 6 mm). The correlation patterns in the left hemisphere and right hemisphere preserved: AI in the FPN was more strongly coupled with the default network than attention networks (ANCOVA, p < 0.05 and p < 0.001 for the comparison of regression slopes, respectively) in the left hemisphere but more strongly coupled with the attention networks than the default network (ANCOVA, both p < 0.001 for the comparison of regression slopes) in the right hemisphere. Although this analysis cannot completely rule out the possibility of asymmetric spatial correlation contributing to our observations, it suggests that a confounding effect, if present, is subtle and our results are unlikely a simple product of spatial adjacencies of the networks.
To investigate how much the between-network correlations of AI values shown in Figure 8 are influenced by other methodological confounds, such as individual differences in the spatial pattern of signal-to-noise ratio (SNR), we computed the SNR distribution for each subject. Temporal SNR of the motion-corrected fMRI time series was computed for each voxel in the subject's native volumetric space by averaging the signal intensity across the whole run and dividing it by the SD over time. The SNR values were then projected to the standard surface space (FreeSurfer fsaverage5) and averaged within each network parcellation. The between-network correlations of AI values shown in Figure 8 were then recalculated with the SNR values controlled for using partial correlation. We found that the correlations of AI remained almost unchanged. In the left hemisphere, the partial correlation between the mean AI of FPN and that of default and language (DN), dorsal attention (dATN), and ventral attention (vATN) was 0.41, 0.37, and 0.15, respectively. In the right hemisphere, the partial correlation between the mean AI of FPN and that of DN, dATN, and vATN was 0.37, 0.47, and 0.44, respectively.
To estimate the Type I error rate of the correlation between the autonomy map and the evolutionary cortical expansion map shown in Figure 9, we randomly shuffled vertices of the down-sampled autonomy map and reblurred the maps on the high-resolution surface. The correlation with the evolutionary cortical expansion map was then computed. After 1000 permutations, none of the correlation values was larger than 0.49, the correlation between the original autonomy map and the cortical expansion map. Type I error rate for the null hypothesis yielded by this 1000 permutations is likely therefore at least <0.001, although this should only be considered an approximation.
Discussion
Hemispheric specialization has been studied extensively because of its important implications to understanding human brain organization, development, and various neurological diseases (Milner, 1971; Gazzaniga, 2000). The present study estimated specialization across the full cortical mantle based on intrinsic functional connectivity measured at rest. Unlike past approaches that have investigated the asymmetric representation of functions between two hemispheres, here we focus on properties of functional connectivity that may support interactions among different functionally lateralized brain systems. The gradient of specialization across different functional regions revealed that higher-order association cortex exhibits the most prominent specialization, whereas sensorimotor regions possess weaker specialization. This gradient of specialization was mirrored in the cerebellum.
An intriguing finding that may have important implications for understanding mechanisms of lateralization is that the FPN is strongly specialized within both hemispheres but is preferentially coupled to the default network in the left hemisphere and to the attention networks in the right hemisphere.
Heteromodal association cortex shows stronger asymmetric cortical specialization than unimodal cortices
The present results demonstrate that hemispheric specialization has a nonuniform distribution across the cerebral cortex. Specialization is strongest in the heteromodal association regions that are estimated to preferentially connect through relatively small callosal fibers (Aboitiz et al., 1992) and are also characterized by preferential long-range functional connectivity (Sepulcre et al., 2010). Pathways for associative processing are critical for achieving behavioral flexibility (Mesulam, 1998) but require integration among brain regions that are far apart (Goldman-Rakic, 1988; Mesulam, 1998; Buckner and Krienen, 2013). Given that cross-hemispheric transfer incurs extra processing costs, specialization of these circuits may bring advantages for time-critical tasks. By contrast, sensorimotor systems in each hemisphere consist of local, modular processing circuits often connected to midline or mirrored body representations and involve interactions between the two hemispheres. Although dominance of motor functions, such as handedness, is well recognized and has been related to anatomical and language lateralization (Amunts et al., 1996), functional connectivity in motor regions is relatively symmetric compared with association areas (Wang et al., 2013; Wey et al., 2013). We recently investigated the relation between connectivity laterality and handedness using 52 pairs of well-matched subjects (Wang et al., 2013). Whereas functional connectivity in networks of regions linked to language and attention differed significantly between left-handed and right-handed subjects, connectivity in motor regions did not show a significant handedness effect (Wang et al., 2013). It is unclear whether resting-state functional connectivity is insensitive to the motor connections related to handedness or whether bilateral motor coordination is a more prominent functional feature than handedness. Future investigation on specific motor connectivity characteristics contributing to handedness is warranted.
Potential evolutionary and developmental accounts of hemispheric specialization
Asymmetry is a prominent organizational feature of the human brain but also exists in nonhuman brains (Zilles et al., 1996; Cantalupo and Hopkins, 2001). The evolutionary advantages of hemispheric specialization have been long debated (Previc, 1991; Vallortigara and Rogers, 2005). The current study revealed prominent hemispheric specialization in the heteromodal association cortex, regions that are estimated to have undergone dramatic expansion during hominin evolution (Van Essen and Dierker, 2007; Preuss, 2011; Sherwood et al., 2012; Buckner and Krienen, 2013). The significant correlation among hemispheric specialization and evolutionary expansion may suggest that hemispheric specialization is directly linked to evolutionary cortical expansion. Further insight might arise from developmental studies of connectivity. In humans, association cortex demonstrates the most significant postnatal enlargement (Hill et al., 2010a) at times when hemispheric specialization is thought to be incomplete. Longitudinal studies have revealed that language lateralization increases gradually during development (Holland et al., 2001; Szaflarski et al., 2006).
A network perspective of hemispheric specialization
A recent development in the research of hemispheric specialization is that functional lateralization may be inferred from the asymmetry in intrinsic functional connectivity (Liu et al., 2009; Tomasi and Volkow, 2012; Gotts et al., 2013; Wang et al., 2013). A technical challenge faced by these approaches is their reliance on identifying homotopic regions in two hemispheres, which is inevitably confounded by anatomical asymmetry of the human brain (Stark et al., 2008). Anatomical asymmetry may span across multiple scales, from overall morphology, cortical folding pattern (Hill et al., 2010b), surface area (White et al., 1994), and gray matter thickness (Luders et al., 2006) to microscopically measured cytoarchitecture (Amunts et al., 1999) and the organization of microcircuitry (Galuske et al., 2000). The present study offers a novel perspective based on the composition of within- and cross-hemispheric connectivity. In this context, specialization is indirectly reflected by the imbalance between within- and cross-hemispheric interactions instead of the direct contrast between homotopic regions; thus, the method may be less sensitive to assumption of bilateral anatomic symmetry.
Subdivisions of the frontoparietal control network in both hemispheres are specialized
An intriguing finding of the present study is that subdivisions of the FPN in both hemispheres are specialized but with distinct coupling patterns in the two hemispheres. The FPN is a distributed association network that might be preferentially expanded in the human (Buckner and Krienen, 2013; Mantini et al., 2013). The network is anatomically juxtaposed between multiple other networks that process preferentially external channels of information (e.g., the dorsal attention system) or internal channels of information (the default network) (Vincent et al., 2008; Niendam et al., 2012; Spreng et al., 2013). The FPN is active during a wide range of controlled processing tasks (Ramnani and Owen, 2004; e.g., Botvinick et al., 2004) consistent with models that suggest networks involving prefrontal cortex may bias processing of other networks (Miller and Cohen, 2001). Spreng et al. (2013) recently demonstrated that the FPN is differentially coupled with the default network and attention networks depending on task demands, suggesting that the FPN plays a cooperative role in various cognitive operations.
A specialized executive control unit positioned in the same hemisphere as the controlled cognitive processes may reduce the cost in processing time. Because various cognitive functions are specialized in one brain hemisphere, an efficient arrangement might be a segregated FPN with its subdivisions also specialized in each hemisphere to support the within-hemispheric cognitive operations. Moreover, differential interactions of the FPN and other network in the two hemispheres may suggest a mechanism by which functional specialization could arise. In addition to local modifications that alter processing at the level of brain regions, hemispheric specialization could also arise by how homologous networks functionally interact within the context of the distributed networks of each hemisphere. Competition and bias to form distinct interactions between networks in the two hemispheres may be an important factor in hemispheric specialization.
Caveats
In this study, intrahemispheric and interhemispheric connectivity was estimated based on the resting-state fcMRI, which is a statistical association between the low-frequency fluctuations in the spontaneous BOLD activity from different regions. Although constrained by anatomical pathway (Honey et al., 2009; Lu et al., 2011), resting-state functional coupling is mediated by monosynaptic or polysynaptic anatomic connections (Buckner et al., 2013), changes dynamically (Hutchison et al., 2013), and is sensitive to multiple confounding factors (Murphy et al., 2013). Therefore, it should not be interpreted as a direct measure of anatomical connectivity. Although many results of resting-state fcMRI analyses resemble the findings of task fMRI, it has also been shown that functional connectivity at rest can differ from the transient coupling configurations of the active brain during task performance (Buckner et al., 2013; Hermundstad et al., 2013). The task modulation could affect both the intrahemispheric and interhemispheric connectivities (Hermundstad et al., 2013). The hemispheric specialization measured at rest therefore should be interpreted with caution when comparing with the lateralization observed during active tasks because both spontaneous and task-evoked activity may consist of some independent information about the functional network property.
Footnotes
This work was supported by National Institute of Neurological Disorders and Stroke Grant K25NS069805, National Alliance for Research on Schizophrenia and Depression Young Investigator Grant, National Institute on Aging Grant AG021910, National Center for Research Resources Grant P41RR14074, the Massachusetts General Hospital-University of California, Los Angeles Human Connectome Project (U54MH091665), and the Simons Foundation. The authors thank B.T. Thomas Yeo, Mert Sabuncu, Avram Holmes, and Sophia Mueller for discussion and technical assistance.
The authors are listed as inventors in patent applications on measuring brain functional lateralization using functional MRI free of anatomical confound.
References
- Aboitiz F, Scheibel AB, Fisher RS, Zaidel E. Fiber composition of the human corpus callosum. Brain Res. 1992;598:143–153. doi: 10.1016/0006-8993(92)90178-C. [DOI] [PubMed] [Google Scholar]
- Achard S, Bullmore E. Efficiency and cost of economical brain functional networks. PLoS Comput Biol. 2007;3:e17. doi: 10.1371/journal.pcbi.0030017. [DOI] [PMC free article] [PubMed] [Google Scholar]
- Amunts K, Schlaug G, Schleicher A, Steinmetz H, Dabringhaus A, Roland PE, Zilles K. Asymmetry in the human motor cortex and handedness. Neuroimage. 1996;4:216–222. doi: 10.1006/nimg.1996.0073. [DOI] [PubMed] [Google Scholar]
- Amunts K, Schleicher A, Bürgel U, Mohlberg H, Uylings HB, Zilles K. Broca's region revisited: cytoarchitecture and intersubject variability. J Comp Neurol. 1999;412:319–341. doi: 10.1002/(SICI)1096-9861(19990920)412:2<319::AID-CNE10>3.0.CO%3B2-7. [DOI] [PubMed] [Google Scholar]
- Andrews-Hanna JR. The brain's default network and its adaptive role in internal mentation. Neuroscientist. 2012;18:251–270. doi: 10.1177/1073858411403316. [DOI] [PMC free article] [PubMed] [Google Scholar]
- Binder JR, Swanson SJ, Hammeke TA, Morris GL, Mueller WM, Fischer M, Benbadis S, Frost JA, Rao SM, Haughton VM. Determination of language dominance using functional MRI A comparison with the Wada test. Neurology. 1996;46:978–984. doi: 10.1212/WNL.46.4.978. [DOI] [PubMed] [Google Scholar]
- Bishop DV. Cerebral asymmetry and language development: cause, correlate, or consequence? Science. 2013;340:1230531. doi: 10.1126/science.1230531. [DOI] [PMC free article] [PubMed] [Google Scholar]
- Biswal B, Yetkin FZ, Haughton VM, Hyde JS. Functional connectivity in the motor cortex of resting human brain using echo-planar MRI. Magn Reson Med. 1995;34:537–541. doi: 10.1002/mrm.1910340409. [DOI] [PubMed] [Google Scholar]
- Botvinick MM, Cohen JD, Carter CS. Conflict monitoring and anterior cingulate cortex: an update. Trends Cogn Sci. 2004;8:539–546. doi: 10.1016/j.tics.2004.10.003. [DOI] [PubMed] [Google Scholar]
- Buckner RL, Krienen FM. The evolution of distributed association networks in the human brain. Trends Cogn Sci. 2013;17:648–665. doi: 10.1016/j.tics.2013.09.017. [DOI] [PubMed] [Google Scholar]
- Buckner RL, Andrews-Hanna JR, Schacter DL. The brain's default network: anatomy, function, and relevance to disease. Ann N Y Acad Sci. 2008;1124:1–38. doi: 10.1196/annals.1440.011. [DOI] [PubMed] [Google Scholar]
- Buckner RL, Krienen FM, Castellanos A, Diaz JC, Yeo BT. The organization of the human cerebellum estimated by intrinsic functional connectivity. J Neurophysiol. 2011;106:2322–2345. doi: 10.1152/jn.00339.2011. [DOI] [PMC free article] [PubMed] [Google Scholar]
- Buckner RL, Krienen FM, Yeo BT. Opportunities and limitations of intrinsic functional connectivity MRI. Nat Neurosci. 2013;16:832–837. doi: 10.1038/nn.3423. [DOI] [PubMed] [Google Scholar]
- Bullmore E, Sporns O. The economy of brain network organization. Nat Rev Neurosci. 2012;13:336–349. doi: 10.1038/nrn3214. [DOI] [PubMed] [Google Scholar]
- Cai Q, Van der Haegen L, Brysbaert M. Complementary hemispheric specialization for language production and visuospatial attention. Proc Natl Acad Sci U S A. 2013;110:E322–E330. doi: 10.1073/pnas.1212956110. [DOI] [PMC free article] [PubMed] [Google Scholar]
- Cantalupo C, Hopkins WD. Asymmetric Broca's area in great apes. Nature. 2001;414:505. doi: 10.1038/35107134. [DOI] [PMC free article] [PubMed] [Google Scholar]
- Choi EY, Yeo BT, Buckner RL. The organization of the human striatum estimated by intrinsic functional connectivity. J Neurophysiol. 2012;108:2242–2263. doi: 10.1152/jn.00270.2012. [DOI] [PMC free article] [PubMed] [Google Scholar]
- Demb JB, Desmond JE, Wagner AD, Vaidya CJ, Glover GH, Gabrieli JD. Semantic encoding and retrieval in the left inferior prefrontal cortex: a functional MRI study of task difficulty and process specificity. J Neurosci. 1995;15:5870–5878. doi: 10.1523/JNEUROSCI.15-09-05870.1995. [DOI] [PMC free article] [PubMed] [Google Scholar]
- Desmond JE, Sum JM, Wagner AD, Demb JB, Shear PK, Glover GH, Gabrieli JD, Morrell MJ. Functional MRI measurement of language lateralization in Wada-tested patients. Brain. 1995;118:1411–1419. doi: 10.1093/brain/118.6.1411. [DOI] [PubMed] [Google Scholar]
- Fox MD, Raichle ME. Spontaneous fluctuations in brain activity observed with functional magnetic resonance imaging. Nat Rev Neurosci. 2007;8:700–711. doi: 10.1038/nrn2201. [DOI] [PubMed] [Google Scholar]
- Fox MD, Snyder AZ, Vincent JL, Corbetta M, Van Essen DC, Raichle ME. The human brain is intrinsically organized into dynamic, anticorrelated functional networks. Proc Natl Acad Sci U S A. 2005;102:9673–9678. doi: 10.1073/pnas.0504136102. [DOI] [PMC free article] [PubMed] [Google Scholar]
- Fransson P. Spontaneous low-frequency BOLD signal fluctuations: an fMRI investigation of the resting-state default mode of brain function hypothesis. Hum Brain Mapp. 2005;26:15–29. doi: 10.1002/hbm.20113. [DOI] [PMC free article] [PubMed] [Google Scholar]
- Galuske RA, Schlote W, Bratzke H, Singer W. Interhemispheric asymmetries of the modular structure in human temporal cortex. Science. 2000;289:1946–1949. doi: 10.1126/science.289.5486.1946. [DOI] [PubMed] [Google Scholar]
- Gazzaniga MS. Cerebral specialization and interhemispheric communication: does the corpus callosum enable the human condition? Brain. 2000;123:1293–1326. doi: 10.1093/brain/123.7.1293. [DOI] [PubMed] [Google Scholar]
- Goldman-Rakic PS. Topography of cognition: parallel distributed networks in primate association cortex. Annu Rev Neurosci. 1988;11:137–156. doi: 10.1146/annurev.ne.11.030188.001033. [DOI] [PubMed] [Google Scholar]
- Gotts SJ, Jo HJ, Wallace GL, Saad ZS, Cox RW, Martin A. Two distinct forms of functional lateralization in the human brain. Proc Natl Acad Sci U S A. 2013;110:E3435–E3444. doi: 10.1073/pnas.1302581110. [DOI] [PMC free article] [PubMed] [Google Scholar]
- Greve DN, Fischl B. Accurate and robust brain image alignment using boundary-based registration. Neuroimage. 2009;48:63–72. doi: 10.1016/j.neuroimage.2009.06.060. [DOI] [PMC free article] [PubMed] [Google Scholar]
- Habas C, Kamdar N, Nguyen D, Prater K, Beckmann CF, Menon V, Greicius MD. Distinct cerebellar contributions to intrinsic connectivity networks. J Neurosci. 2009;29:8586–8594. doi: 10.1523/JNEUROSCI.1868-09.2009. [DOI] [PMC free article] [PubMed] [Google Scholar]
- Hermundstad AM, Bassett DS, Brown KS, Aminoff EM, Clewett D, Freeman S, Frithsen A, Johnson A, Tipper CM, Miller MB, Grafton ST, Carlson JM. Structural foundations of resting-state and task-based functional connectivity in the human brain. Proc Natl Acad Sci U S A. 2013;110:6169–6174. doi: 10.1073/pnas.1219562110. [DOI] [PMC free article] [PubMed] [Google Scholar]
- Hill J, Inder T, Neil J, Dierker D, Harwell J, Van Essen D. Similar patterns of cortical expansion during human development and evolution. Proc Natl Acad Sci U S A. 2010a;107:13135–13140. doi: 10.1073/pnas.1001229107. [DOI] [PMC free article] [PubMed] [Google Scholar]
- Hill J, Dierker D, Neil J, Inder T, Knutsen A, Harwell J, Coalson T, Van Essen D. A surface-based analysis of hemispheric asymmetries and folding of cerebral cortex in term-born human infants. J Neurosci. 2010b;30:2268–2276. doi: 10.1523/JNEUROSCI.4682-09.2010. [DOI] [PMC free article] [PubMed] [Google Scholar]
- Holland SK, Plante E, Weber Byars A, Strawsburg RH, Schmithorst VJ, Ball WS., Jr Normal fMRI brain activation patterns in children performing a verb generation task. Neuroimage. 2001;14:837–843. doi: 10.1006/nimg.2001.0875. [DOI] [PubMed] [Google Scholar]
- Honey CJ, Sporns O, Cammoun L, Gigandet X, Thiran JP, Meuli R, Hagmann P. Predicting human resting-state functional connectivity from structural connectivity. Proc Natl Acad Sci U S A. 2009;106:2035–2040. doi: 10.1073/pnas.0811168106. [DOI] [PMC free article] [PubMed] [Google Scholar]
- Hutchison RM, Womelsdorf T, Allen EA, Bandettini PA, Calhoun VD, Corbetta M, Della Penna S, Duyn JH, Glover GH, Gonzalez-Castillo J, Handwerker DA, Keilholz S, Kiviniemi V, Leopold DA, de Pasquale F, Sporns O, Walter M, Chang C. Dynamic functional connectivity: promise, issues, and interpretations. Neuroimage. 2013;80:360–378. doi: 10.1016/j.neuroimage.2013.05.079. [DOI] [PMC free article] [PubMed] [Google Scholar]
- Jenkinson M, Bannister P, Brady M, Smith S. Improved optimization for the robust and accurate linear registration and motion correction of brain images. Neuroimage. 2002;17:825–841. doi: 10.1006/nimg.2002.1132. [DOI] [PubMed] [Google Scholar]
- Levy J. Possible basis for the evolution of lateral specialization of the human brain. Nature. 1969;224:614–615. doi: 10.1038/224614a0. [DOI] [PubMed] [Google Scholar]
- Liu H, Stufflebeam SM, Sepulcre J, Hedden T, Buckner RL. Evidence from intrinsic activity that asymmetry of the human brain is controlled by multiple factors. Proc Natl Acad Sci U S A. 2009;106:20499–20503. doi: 10.1073/pnas.0908073106. [DOI] [PMC free article] [PubMed] [Google Scholar]
- Lu J, Liu H, Zhang M, Wang D, Cao Y, Ma Q, Rong D, Wang X, Buckner RL, Li K. Focal pontine lesions provide evidence that intrinsic functional connectivity reflects polysynaptic anatomical pathways. J Neurosci. 2011;31:15065–15071. doi: 10.1523/JNEUROSCI.2364-11.2011. [DOI] [PMC free article] [PubMed] [Google Scholar]
- Luders E, Narr KL, Thompson PM, Rex DE, Jancke L, Toga AW. Hemispheric asymmetries in cortical thickness. Cereb Cortex. 2006;16:1232–1238. doi: 10.1093/cercor/bhj064. [DOI] [PubMed] [Google Scholar]
- Mantini D, Corbetta M, Romani GL, Orban GA, Vanduffel W. Evolutionarily novel functional networks in the human brain? J Neurosci. 2013;33:3259–3275. doi: 10.1523/JNEUROSCI.4392-12.2013. [DOI] [PMC free article] [PubMed] [Google Scholar]
- Mesulam MM. From sensation to cognition. Brain. 1998;121:1013–1052. doi: 10.1093/brain/121.6.1013. [DOI] [PubMed] [Google Scholar]
- Miller EK, Cohen JD. An integrative theory of prefrontal cortex function. Annu Rev Neurosci. 2001;24:167–202. doi: 10.1146/annurev.neuro.24.1.167. [DOI] [PubMed] [Google Scholar]
- Milner B. Interhemispheric differences in the localization of psychological processes in man. Br Med Bull. 1971;27:272–277. doi: 10.1093/oxfordjournals.bmb.a070866. [DOI] [PubMed] [Google Scholar]
- Murphy K, Birn RM, Bandettini PA. Resting-state fMRI confounds and cleanup. Neuroimage. 2013;80:349–359. doi: 10.1016/j.neuroimage.2013.04.001. [DOI] [PMC free article] [PubMed] [Google Scholar]
- Niendam TA, Laird AR, Ray KL, Dean YM, Glahn DC, Carter CS. Meta-analytic evidence for a superordinate cognitive control network subserving diverse executive functions. Cogn Affect Behav Neurosci. 2012;12:241–268. doi: 10.3758/s13415-011-0083-5. [DOI] [PMC free article] [PubMed] [Google Scholar]
- Penfield W, Jasper HH. Epilepsy and the functional anatomy of the human brain. Oxford: Little Brown; 1954. [Google Scholar]
- Petersen SE, Fox PT, Posner MI, Mintun M, Raichle ME. Positron emission tomographic studies of the processing of single words. J Cogn Neurosci. 1989;1:153–170. doi: 10.1162/jocn.1989.1.2.153. [DOI] [PubMed] [Google Scholar]
- Power JD, Cohen AL, Nelson SM, Wig GS, Barnes KA, Church JA, Vogel AC, Laumann TO, Miezin FM, Schlaggar BL, Petersen SE. Functional network organization of the human brain. Neuron. 2011;72:665–678. doi: 10.1016/j.neuron.2011.09.006. [DOI] [PMC free article] [PubMed] [Google Scholar]
- Preuss TM. The human brain: rewired and running hot. Ann N Y Acad Sci. 2011;1225(Suppl 1):E182–E191. doi: 10.1111/j.1749-6632.2011.06001.x. [DOI] [PMC free article] [PubMed] [Google Scholar]
- Previc FH. A general theory concerning the prenatal origins of cerebral lateralization in humans. Psychol Rev. 1991;98:299–334. doi: 10.1037/0033-295X.98.3.299. [DOI] [PubMed] [Google Scholar]
- Ramnani N, Owen AM. Anterior prefrontal cortex: insights into function from anatomy and neuroimaging. Nat Rev Neurosci. 2004;5:184–194. doi: 10.1038/nrn1343. [DOI] [PubMed] [Google Scholar]
- Ringo JL, Doty RW, Demeter S, Simard PY. Time is of the essence: a conjecture that hemispheric specialization arises from interhemispheric conduction delay. Cereb Cortex. 1994;4:331–343. doi: 10.1093/cercor/4.4.331. [DOI] [PubMed] [Google Scholar]
- Satterthwaite TD, Elliott MA, Gerraty RT, Ruparel K, Loughead J, Calkins ME, Eickhoff SB, Hakonarson H, Gur RC, Gur RE, Wolf DH. An improved framework for confound regression and filtering for control of motion artifact in the preprocessing of resting-state functional connectivity data. Neuroimage. 2013;64:240–256. doi: 10.1016/j.neuroimage.2012.08.052. [DOI] [PMC free article] [PubMed] [Google Scholar]
- Sepulcre J, Liu H, Talukdar T, Martincorena I, Yeo BT, Buckner RL. The organization of local and distant functional connectivity in the human brain. PLoS Comput Biol. 2010;6:e1000808. doi: 10.1371/journal.pcbi.1000808. [DOI] [PMC free article] [PubMed] [Google Scholar]
- Sherwood CC, Bauernfeind AL, Bianchi S, Raghanti MA, Hof PR. Human brain evolution writ large and small. Prog Brain Res. 2012;195:237–254. doi: 10.1016/B978-0-444-53860-4.00011-8. [DOI] [PubMed] [Google Scholar]
- Smith SM, Jenkinson M, Woolrich MW, Beckmann CF, Behrens TE, Johansen-Berg H, Bannister PR, De Luca M, Drobnjak I, Flitney DE, Niazy RK, Saunders J, Vickers J, Zhang Y, De Stefano N, Brady JM, Matthews PM. Advances in functional and structural MR image analysis and implementation as FSL. Neuroimage. 2004;23:S208–S219. doi: 10.1016/j.neuroimage.2004.07.051. [DOI] [PubMed] [Google Scholar]
- Spreng RN, Stevens WD, Chamberlain JP, Gilmore AW, Schacter DL. Default network activity, coupled with the frontoparietal control network, supports goal-directed cognition. Neuroimage. 2010;53:303–317. doi: 10.1016/j.neuroimage.2010.06.016. [DOI] [PMC free article] [PubMed] [Google Scholar]
- Spreng RN, Sepulcre J, Turner GR, Stevens WD, Schacter DL. Intrinsic architecture underlying the relations among the default, dorsal attention, and fronto-parietal control networks of the human brain. J Cogn Neurosci. 2013;25:74–86. doi: 10.1162/jocn_a_00281. [DOI] [PMC free article] [PubMed] [Google Scholar]
- Stark DE, Margulies DS, Shehzad ZE, Reiss P, Kelly AM, Uddin LQ, Gee DG, Roy AK, Banich MT, Castellanos FX, Milham MP. Regional variation in interhemispheric coordination of intrinsic hemodynamic fluctuations. J Neurosci. 2008;28:13754–13764. doi: 10.1523/JNEUROSCI.4544-08.2008. [DOI] [PMC free article] [PubMed] [Google Scholar]
- Szaflarski JP, Schmithorst VJ, Altaye M, Byars AW, Ret J, Plante E, Holland SK. A longitudinal functional magnetic resonance imaging study of language development in children 5 to 11 years old. Ann Neurol. 2006;59:796–807. doi: 10.1002/ana.20817. [DOI] [PMC free article] [PubMed] [Google Scholar]
- Tomasi D, Volkow ND. Laterality patterns of brain functional connectivity: gender effects. Cereb Cortex. 2012;22:1455–1462. doi: 10.1093/cercor/bhr230. [DOI] [PMC free article] [PubMed] [Google Scholar]
- Vallortigara G, Rogers LJ. Survival with an asymmetrical brain: advantages and disadvantages of cerebral lateralization. Behav Brain Sci. 2005;28:575–589. doi: 10.1017/S0140525X05000105. discussion 589–633. [DOI] [PubMed] [Google Scholar]
- Van Dijk KR, Hedden T, Venkataraman A, Evans KC, Lazar SW, Buckner RL. Intrinsic functional connectivity as a tool for human connectomics: theories, properties, and optimization. J Neurophysiol. 2010;103:297–321. doi: 10.1152/jn.00783.2009. [DOI] [PMC free article] [PubMed] [Google Scholar]
- Van Dijk KR, Sabuncu MR, Buckner RL. The influence of head motion on intrinsic functional connectivity MRI. Neuroimage. 2012;59:431–438. doi: 10.1016/j.neuroimage.2011.07.044. [DOI] [PMC free article] [PubMed] [Google Scholar]
- Van Essen DC, Dierker DL. Surface-based and probabilistic atlases of primate cerebral cortex. Neuron. 2007;56:209–225. doi: 10.1016/j.neuron.2007.10.015. [DOI] [PubMed] [Google Scholar]
- Van Essen DC, Glasser MF, Dierker DL, Harwell J. Cortical parcellations of the macaque monkey analyzed on surface-based atlases. Cereb Cortex. 2012;22:2227–2240. doi: 10.1093/cercor/bhr290. [DOI] [PMC free article] [PubMed] [Google Scholar]
- Vincent JL, Kahn I, Snyder AZ, Raichle ME, Buckner RL. Evidence for a frontoparietal control system revealed by intrinsic functional connectivity. J Neurophysiol. 2008;100:3328–3342. doi: 10.1152/jn.90355.2008. [DOI] [PMC free article] [PubMed] [Google Scholar]
- Wada J, Rasmussen T. Intracarotid injection of sodium amytal for the lateralization of cerebral speech dominance. J Neurosurg. 1960;17:266–282. doi: 10.3171/jns.2007.106.6.1117. [DOI] [PubMed] [Google Scholar]
- Wang D, Buckner RL, Liu H. Cerebellar asymmetry and its relation to cerebral asymmetry estimated by intrinsic functional connectivity. J Neurophysiol. 2013;109:46–57. doi: 10.1152/jn.00598.2012. [DOI] [PMC free article] [PubMed] [Google Scholar]
- Wey HY, Phillips KA, McKay DR, Laird AR, Kochunov P, Davis MD, Glahn DC, Duong TQ, Fox PT. Multi-region hemispheric specialization differentiates human from nonhuman primate brain function. Brain Struct Funct. 2013 doi: 10.1007/s00429-013-0635-2. doi: 10.1007/s00429-013-0635-2. Advance online publication. Retrieved Aug. 9, 2013. [DOI] [PMC free article] [PubMed] [Google Scholar]
- White LE, Lucas G, Richards A, Purves D. Cerebral asymmetry and handedness. Nature. 1994;368:197–198. doi: 10.1038/368197a0. [DOI] [PubMed] [Google Scholar]
- Yan CG, Cheung B, Kelly C, Colcombe S, Craddock RC, Di Martino A, Li Q, Zuo XN, Castellanos FX, Milham MP. A comprehensive assessment of regional variation in the impact of head micromovements on functional connectomics. Neuroimage. 2013;76:183–201. doi: 10.1016/j.neuroimage.2013.03.004. [DOI] [PMC free article] [PubMed] [Google Scholar]
- Yeo BT, Krienen FM, Sepulcre J, Sabuncu MR, Lashkari D, Hollinshead M, Roffman JL, Smoller JW, Zöllei L, Polimeni JR, Fischl B, Liu H, Buckner RL. The organization of the human cerebral cortex estimated by intrinsic functional connectivity. J Neurophysiol. 2011;106:1125–1165. doi: 10.1152/jn.00338.2011. [DOI] [PMC free article] [PubMed] [Google Scholar]
- Yeo BT, Krienen FM, Chee MW, Buckner RL. Estimates of segregation and overlap of functional connectivity networks in the human cerebral cortex. Neuroimage. 2013;88:212–227. doi: 10.1016/j.neuroimage.2013.10.046. [DOI] [PMC free article] [PubMed] [Google Scholar]
- Zeng LL, Wang D, Fox MD, Sabuncu M, Hu D, Ge M, Buckner RL, Liu H. Neurobiological basis of head motion in brain imaging. Proc Natl Acad Sci U S A. 2014;111:6058–6062. doi: 10.1073/pnas.1317424111. [DOI] [PMC free article] [PubMed] [Google Scholar]
- Zilles K, Dabringhaus A, Geyer S, Amunts K, Qü M, Schleicher A, Gilissen E, Schlaug G, Steinmetz H. Structural asymmetries in the human forebrain and the forebrain of nonhuman primates and rats. Neurosci Biobehav Rev. 1996;20:593–605. doi: 10.1016/0149-7634(95)00072-0. [DOI] [PubMed] [Google Scholar]