

Abstract
Neocortical population activity varies between deactivated and activated states marked by the presence and absence of slow oscillations, respectively. Neocortex activation occurs during waking and vigilance and is readily induced in anesthetized animals by stimulating the brainstem reticular formation, basal forebrain, or thalamus. Neuromodulators are thought to be responsible for these changes in cortical activity, but their selective cortical effects (i.e., without actions in other brain areas) on neocortical population activity in vivo are not well defined. We found that selective cholinergic and noradrenergic stimulation of the barrel cortex produces well differentiated activated states in rats. Cholinergic cortical stimulation activates the cortex by abolishing synchronous slow oscillations and shifting firing to a tonic mode, which increases in rate at high doses. This shift causes the sensory thalamus itself to become activated. In contrast, noradrenergic cortical stimulation activates the cortex by abolishing synchronous slow oscillations but suppresses overall cortical firing rate, which deactivates the thalamus. Cortical activation produced by either of these neuromodulators leads to suppressed sensory responses and more focused receptive fields. High-frequency sensory stimuli are best relayed to barrel cortex during cortical cholinergic activation because this also activates the thalamus. Cortical neuromodulation sets different cortical and thalamic states that may serve to control sensory information processing according to behavioral contingencies.
Keywords: acetylcholine, norepinephrine, sensory processing, somatosensory cortex, thalamus, whisker
Introduction
The neocortex undergoes significant changes in network activity during different behavioral states, and these changes have profound consequences on signals coming from the thalamus (Castro-Alamancos and Connors, 1996; Castro-Alamancos and Oldford, 2002; Castro-Alamancos, 2004b, 2009; Stoelzel et al., 2009; Harris and Thiele, 2011; Lee and Dan, 2012). During drowsiness, slow-wave sleep, and surgical anesthesia, cortical networks are typically in a so-called “deactivated” or “synchronized” state that consists of large-amplitude slow oscillations that are highly synchronized among neuronal populations. During arousal, vigilance, and paradoxical sleep, cortical networks are typically in a so-called “activated” or “desynchronized” state characterized by the absence of synchronous slow oscillations, sometimes containing fast rhythms.
Cortical activation is readily induced in sleeping/anesthetized animals by stimulating the brainstem reticular formation (Moruzzi and Magoun, 1949). Traditionally, this effect has been attributed to the cortical actions of neuromodulators, such as norepinephrine (NE) and acetylcholine (Vanderwolf, 1988; Steriade et al., 1993; Castro-Alamancos, 2004b; Carter et al., 2010; Constantinople and Bruno, 2011; Pinto et al., 2013). Consistent with this idea, cholinergic or noradrenergic stimulation readily abolishes spontaneous or evoked slow oscillations in cortical slices (Favero et al., 2012), but the slice oscillations may not exactly mimic in vivo activity and slices have other evident limitations. In addition, stimulation of cholinergic or noradrenergic cells in vivo releases these neuromodulators in many locations that project to the cortex, including the thalamus, where they alter neural activity, making it difficult to decipher the cause of cortical activation. Indeed, neuromodulation of thalamocortical activity in the sensory thalamus per se is capable of controlling activation in the related sensory cortex (Hirata and Castro-Alamancos, 2010).
Hence, the selective in vivo effects of neuromodulators in the neocortex are not well known because of several technical reasons. First, as already mentioned, many studies, including our own, have relied on electrical stimulation, which is highly nonspecific; many pathways and neurotransmitter systems are recruited. Second, the advent of optogenetics now enables selective stimulation of cholinergic or noradrenergic cells (Carter et al., 2010; Zhao et al., 2011; Pinto et al., 2013). However, selective stimulation of these cells in vivo will not lead to a selective release of acetylcholine or NE in the neocortex because these cells target other regions that also project to the neocortex, and they may corelease additional substances. Third, many studies have used iontophoresis to deliver neurotransmitters into the neocortex, but this method is limited by the extent of the diffusion, provides poor control of the concentration delivered, and does not enable easy testing of multiple doses or drugs in the same site.
In contrast, we have used microdialysis to infuse neuromodulators into various brain regions, including the thalamus and neocortex. This method is akin to a slice preparation in vivo, so that different drugs and concentrations can be exchanged rapidly during continuous recordings. Using this method, we determined the effects of selective cortical cholinergic and noradrenergic stimulation on spontaneous activity and sensory responses in the barrel cortex. We found that these neuromodulators produce distinct cortical activated states.
Materials and Methods
Thirty-six adult male Sprague Dawley rats (300–350 g) were used in this study and cared for in accordance with National Institutes of Health guidelines for laboratory animal welfare. All experiments were approved by the Drexel University Institutional Animal Care and Use Committee. Rats were anesthetized with urethane (1.5 g/kg, i.p.) and placed in a stereotaxic frame. All skin incisions and frame contacts with the skin were injected with lidocaine (2%). Small craniotomies and small incisions of the dura were made over the target structures as necessary. Body temperature was automatically maintained constant with a heating pad at 37°C. The level of anesthesia was monitored with field potential (FP) recordings and limb withdrawal reflexes and kept constant at approximately stage III/3 (i.e., slow large-amplitude FP cortical oscillations, absence of pinch withdrawal reflex, absence of whisker movements) using supplemental doses of urethane.
Electrophysiology.
In every case, a tungsten electrode (1–3 MΩ) was lowered into the depth of the barrel cortex (0.6–1 mm) to record multiunit activity (MUA) and FP activity. A similar second electrode was lowered adjacent to the first electrode (200–400 μm) in the cortex or a high-impedance glass electrode (2–10 MΩ, filled with saline) was lowered into the ventroposterior medial (VPM) thalamus to record single units.
Single and multiwhisker deflection protocols.
Single-whisker and multiwhisker stimulation protocols consisted of independently deflecting six individual whiskers using six different whisker stimulators (Hirata and Castro-Alamancos, 2008; Hirata et al., 2009). After isolating unit activity, the whiskers were stimulated using a hand-held probe. The whisker that produced the shortest latency and strongest response was considered the principal whisker (PW). This whisker and up to five additional whiskers surrounding it, called adjacent whiskers (AWs), were selected for stimulation (Aw1–Aw5). Each of the selected whiskers was placed in an independent whisker stimulator by inserting it into a glass micropipette (outer diameter, 1 mm; inner diameter, 0.5 mm) that was glued to the membrane of a miniature speaker. Each whisker was inserted into the micropipette for ∼5 mm, leaving ∼10 mm from the end of the micropipette to the skin. Application of a 1 ms square-current pulse to the speaker deflected the micropipette and the whiskers inside. The resulting whisker deflection is a very low amplitude (∼2°) and very high velocity (∼1000°/s) stimulus. The whisker stimulators were oriented in the preferred direction to produce the largest response as determined with the hand probe. Each of the six whisker stimulators was driven by counter/timer boards controlled with LabVIEW software (National Instruments).
Whisker stimulation was delivered according to the following protocols. A trial consisted of stimulation of each of the six individual whiskers alone and of all the six whiskers simultaneously. Three seconds after the trial began, all six whiskers were stimulated simultaneously. This was followed 5 s later by individual stimulation of each of the six single whiskers at 2 s intervals (the order of whisker stimulation was randomly selected), so that a full trial lasted 20 s. Whisker stimuli consisted of single stimuli or 10 stimuli delivered at 10 Hz. Every trial was repeated ≥30× to derive peristimulus time histograms and to average FP responses.
Microdialysis.
To apply drugs into the barrel cortex, a microdialysis cannula (outer diameter, 250 μm; membrane length, 2 mm) was placed adjacent (∼500 μm) to the recording electrodes in those areas. ACSF was continuously infused through the probe at 2–4 μl/min and drugs were dissolved in the ACSF. NE or carbachol (CA) were applied at different doses during recording of local neural activity. We have used this method for several decades to infuse drugs into various brain regions, including the thalamus (Castro-Alamancos, 2002a; Hirata et al., 2006; Hirata and Castro-Alamancos, 2010) and neocortex (Castro-Alamancos and Borrell, 1993; Castro-Alamancos and Oldford, 2002; Oldford and Castro-Alamancos, 2003), and typically find that the effective doses during microdialysis are ∼10× higher than during direct application in slices. Indeed, this is the case when compared with a recent study in slices using the same drugs (Favero et al., 2012). This is due to the fact that there is typically ∼10% reverse dialysis recovery of drugs in the extracellular medium as they dialyze down their concentration gradients across the dialysis membrane. Moreover, based on diffusion experiments using arrays of recording electrodes at different distances from the probe, we have estimated the spread to be ∼1 mm in the horizontal plane away from the membrane for the typical doses used here (Castro-Alamancos, 2000; Aguilar and Castro-Alamancos, 2005; Hirata et al., 2006).
Analysis.
Statistical analyses consisted of paired comparisons between the same cells during the application of different drugs. If the data were considered normally distributed, according to the Shapiro–Wilk normality test, we used parametric statistics. For two groups, we used the t test (paired). For >2 groups (one factor), we tested for a significant main effect using the repeated-measures ANOVA followed by comparisons with Tukey's test. If the data were considered not normally distributed, we used nonparametric statistics consisting of the Wilcoxon signed ranks. When performing multiple comparisons, p values were adjusted using a Bonferroni's correction by multiplying the p value by the number of comparisons made. The α level used for significance was p < 0.05 or p < 0.01, as indicated. Testing the effects of drugs on FFT power or evoked responses involved two-way repeated-measures ANOVAs consisting of a Drug factor (levels determined by the number of doses plus control) and a second factor (FFT with 10 levels or Whisker stimulus with 7 levels). A significant main effect or interaction was followed by comparisons with Tukey's tests. Reported p values correspond to significant Tukey's tests after a significant main effect or interaction.
Results
Cortical cholinergic stimulation produces an activated (desynchronized) state in barrel cortex
In urethane-anesthetized rats, we tested the effect of cortical cholinergic stimulation on barrel cortex spontaneous activity. MUA and FP activity was recorded from two electrodes in the barrel cortex while an adjacent microdialysis probe infused drugs at different concentrations. First, we report the effects of the drugs on spontaneous cortical activity by measuring MUA firing rate, autocorrelations and cross-correlations (between the two electrodes), and the power spectrum of the FP. Later, we report the effects of the drugs on whisker-evoked responses in barrel cortex.
In a first set of experiments (Fig. 1A; n = 14), we determined the effect of cholinergic activation in barrel cortex by applying the cholinergic agonist CA at different doses (50, 250, 500, and 2500 μm). During control conditions (see Materials and Methods), MUA and FP activity show spontaneous synchronous slow oscillations reflecting a deactivated or synchronized state. A power spectrum (FFT) of the FP activity (Fig. 1A, bottom) revealed that CA at all doses tested in barrel cortex produced a significant reduction of the low-frequency FP activity between 0 and 5 Hz (Tukey's, p < 0.05). FP activity in the gamma range (>25 Hz) did not increase above control levels with any of the CA doses (Fig. 1A, bottom). However, during the highest dose of CA, gamma range FP activity selectively increased compared with the lower doses of CA (Tukey's, p < 0.05). Note that low-frequency FP activity remained suppressed.
Figure 1.
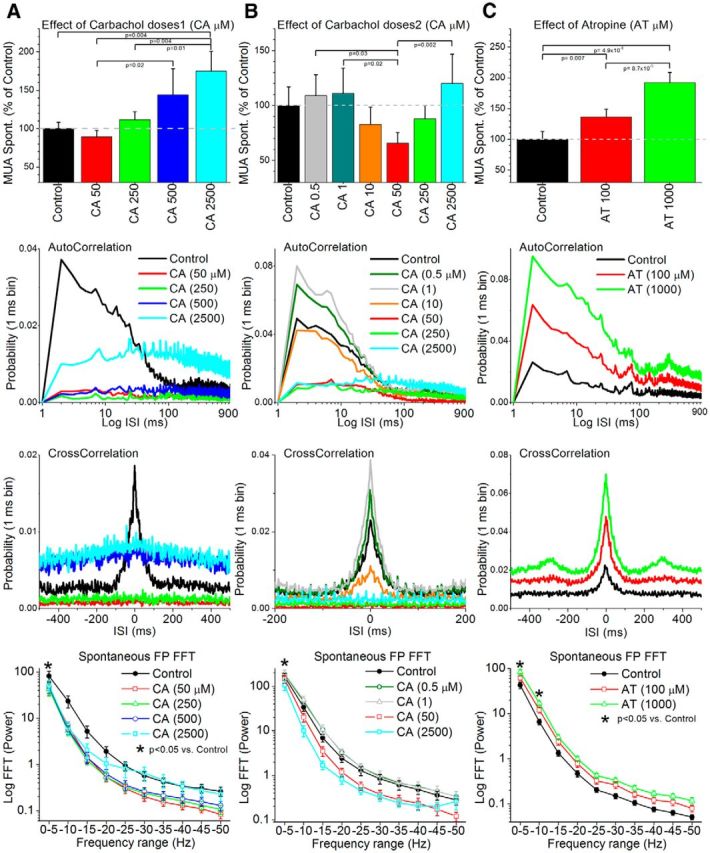
Population data showing the effects of cortical cholinergic stimulation on spontaneous MUA and FP activity in barrel cortex. A–C, The columns depict the results from three different sets of experiments testing four different doses of the cholinergic agonist CA between 50 and 2500 μm (A), six different doses of CA between 0.5 and 2500 μm (B), and two doses of the muscarinic antagonist AT (C). The top panels show the effects of the drugs on spontaneous MUA firing rate. The middle panels show the effects of the drugs on autocorrelations and cross-correlations of the spontaneous MUA. The bottom panel shows the effects of the drugs on the FFT power spectrum (10 ranges between 0 and 50 Hz) of the FP activity. Asterisks in the bottom panels denote frequency ranges for which any of the doses produced a significant effect compared with control (see text for details). The bottom panel of B shows only four of the six doses for clarity.
Regarding MUA, application of CA into the barrel cortex had no significant effect on spontaneous firing rate at doses between 50 and 500 μm (Fig. 1A, top). CA significantly increased firing rate at 2500 μm when compared with either control or the lowest dose (50 μm). In contrast to the effects on spontaneous firing rate, the timing of spontaneous MUA measured with autocorrelations and cross-correlations was significantly affected by all CA doses. During control, the autocorrelation and cross-correlation (Fig. 1A, middle) show a typical large-amplitude short-timescale peak (<20 ms interspike interval) corresponding to the characteristic synchronous high-frequency population firing during slow oscillations. Starting with the lowest CA dose (50 μm), these autocorrelation and cross-correlation peaks were abolished, reflecting the abolishment of synchronous slow oscillations. Importantly, the significant increase in spontaneous MUA firing rate observed at the highest dose (2500 μm) was not accompanied by an increase in synchronous slow oscillations, as noted by the lack of peaks in the autocorrelations and cross-correlations. Instead, the increase was accompanied by an upward shift of the baseline in these functions. Compared with control, autocorrelation probabilities <20 ms were significantly (Wilcoxon, p < 0.05) suppressed by CA doses between 50 and 500 μm, but not for the 2500 μm dose, which increased the probability for all frequencies. Compared with control, cross-correlation probabilities <20 ms were significantly (Wilcoxon, p < 0.05) suppressed by CA doses between 50 and 250 μm, but not for doses between 500 and 2500 μm, which increased the probability for all frequencies. We confirmed the lack of effects of CA at doses of 50–500 μm on overall MUA firing rate by conducting a subset of experiments in which we applied CA (100 μm) and one of the electrodes was a high-impedance glass pipette that isolated a single unit (n = 15 cells). The mean depth of the cells was 894 ± 55 μm (range, 500–1300 μm), which is similar to the depth of the FP and MUA electrode, thus confirming the activating effects reported above on population responses. We found that the firing rate of the cells during control was 3.3 ± 1.6 Hz and this changed to 2.5 ± 1.2 Hz during CA activation (Wilcoxon, p = 0.26; not significant). Similar to the effects of CA on MUA firing rate (at doses between 50 and 500 μm), single-unit firing rate does not readily increase as a group at these doses. Thus, cholinergic activation changes spontaneous population firing from a synchronous slow oscillatory mode to a tonic firing mode that can increase in rate with high doses of CA.
The effects of CA in barrel cortex on MUA and FP activity resemble those traditionally termed activation or desynchronization (Moruzzi and Magoun, 1949; Steriade et al., 1991; Castro-Alamancos, 2004b; Hirata and Castro-Alamancos, 2010), which occur when an animal transitions between a slow-wave sleep/quiescent state to an awake/vigilance state.
In a second set of experiments (n = 10; Fig. 1B), we determined the effects of lower doses of CA (0.5, 1, 10 μm), followed by the higher doses already tested in the first set of experiments (50, 250, 2500 μm). A power spectrum (FFT) of the FP activity (Fig. 1B, bottom) revealed significant effects of CA at the 0–5 Hz frequency range. Thus, the low-frequency FP activity between 0 and 5 Hz tended to increase at the lower CA doses (0.5–10 μm), but this effect was not significant compared with control (Tukey's, p > 0.16). At higher CA doses (50–2500 μm), low-frequency FP activity between 0 and 5 Hz decreased compared with control, but this effect was only significant at the higher doses (250–2500 μm; Tukey's, p < 0.001). Comparing the effects of the doses of the first and second set of experiments revealed that prior application of low doses of CA (0.5–10 μm) suppressed somewhat the activating effects of higher doses of CA compared with control, meaning that higher doses were required to achieve the same effect.
Regarding MUA, the lowest doses of CA (0.5–1 μm) tended to increase the spontaneous firing rate, but this effect was not statistically significant. As the dose of CA increased (10–50 μm), the spontaneous MUA firing decreased from this level, and this effect was significant at 50 μm when compared with the lower doses (Fig. 1B, top), but not to control (Tukey's, p = 0.15). Further increases in the dose of CA led to increases in firing that were significant at 2500 μm when compared with the low obtained at 50 μm (Fig. 1B, top), but not to control (Tukey's, p = 0.7). Autocorrelations and cross-correlations (Fig. 1B, middle) revealed that the lowest doses (0.5–1 μm) of CA did not suppress synchronous slow oscillations. Instead, synchronous slow oscillations increased as indicated by a significantly (Wilcoxon, p < 0.05) larger short-timescale peak (<20 ms) for the autocorrelations and cross-correlations at the 1 μm dose. However, as in the previous set of experiments, higher doses of CA (>10 μm) abolished the synchronous slow oscillations. Also, similar to the first set of experiments, high doses of CA (500–2500 μm) led to a shift in the autocorrelation and cross-correlation baselines compared with 50 μm, but not compared with control.
Together the results reveal that different levels of cholinergic activation produce different states in barrel cortex. A low tone of cholinergic activation (0.5–1 μm) boosts the deactivated cortical state by enhancing synchronous slow oscillations. Interestingly, low doses of cholinergic stimulation boost slow oscillations in juvenile cortical slices (Wester and Contreras, 2013). However, in vivo this effect is small, probably because slow oscillations are already prevalent during the control state. A higher tone of cholinergic activation (∼50 μm) produces signs typical of cortical activation, consisting of the complete abolishment of synchronous slow oscillations and a shift of firing to a tonic mode. A very high tone of cholinergic activation (250–2500 μm) leads to a significant increase in tonic firing without any synchronous slow oscillations.
In a third set of experiments, we explored the effect of blocking cholinergic muscarinic receptors on the same measures as above. If the main effect of these receptors is to produce cortical activation, then application of a muscarinic receptor antagonist should lead to deactivation. Indeed, application of atropine (AT; n = 12; Fig. 1C) into the barrel cortex at two different doses (100–1000 μm) produced a significant increase of low-frequency FP activity (0–10 Hz; Fig. 1C, bottom) and a significant increase in spontaneous MUA firing rate (Fig. 1C, top). This was accompanied by a significant (Tukey's, p < 0.05) increase in the short-timescale peak (<20 ms) of the MUA autocorrelation and cross-correlation functions, indicating an enhancement of synchronous slow oscillatory activity. In conclusion, stimulation of cholinergic receptors causes cortical activation, while block of muscarinic receptors causes cortical deactivation.
Cortical noradrenergic stimulation produces a different state than cholinergic stimulation
Using the same methods described above, we next tested the effects of cortical noradrenergic stimulation on barrel cortex activity. Application of NE into the barrel cortex at any of four different doses (100, 500, 1000, and 5000 μm) significantly decreased the spontaneous MUA firing rate in the barrel cortex (Tukey's; Fig. 2, top). Lower doses were also tested in a few experiments, and either produced a decrease or no significant effect (data not shown). The reduction in spontaneous MUA firing rate was accompanied by an abolishment of synchronous slow oscillations, as indicated by a significant (Wilcoxon, p < 0.05) suppression of the short-timescale peaks (<20 ms) in the autocorrelations and cross-correlations (Fig. 2, middle). However, we noted that spontaneous spindle oscillations could still occur on occasion, particularly at higher NE doses, and this was reflected in the autocorrelation and cross-correlation peaks at the spindle frequency (7–15 Hz; see below). In addition, a power spectrum (FFT) of the FP activity (Fig. 2, bottom) revealed that NE in barrel cortex at all the doses tested produced a significant reduction of low-frequency FP activity between 0 and 10 Hz (Tukey's; p < 0.01). Thus, similar to CA, NE abolishes synchronous slow oscillations, but in contrast to CA, NE robustly suppresses spontaneous firing. To determine whether there is a tonic noradrenergic activation during our control conditions, we tested the effects of two noradrenergic antagonists on MUA and FP activity in a few experiments. Neither the α-adrenergic receptor antagonist phentolamine (1000 μm; n = 4) nor the β-adrenergic antagonist propanolol (1000 μm; n = 4) produced significant effects. Thus, in contrast with the effect of AT, which revealed a tonic cholinergic activation during our control conditions, noradrenergic antagonists indicate that there is a low tonic noradrenergic activation in barrel cortex during our control conditions.
Figure 2.
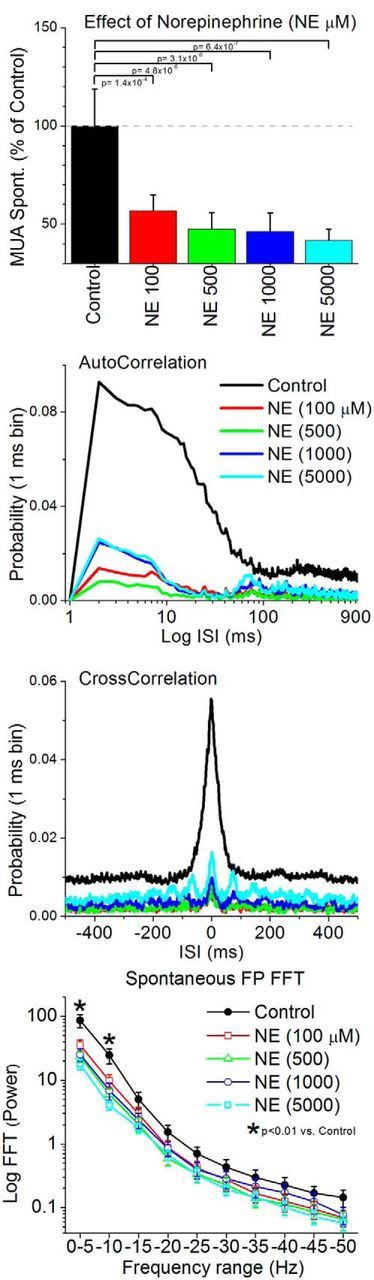
Population data showing the effects of cortical noradrenergic stimulation on spontaneous MUA and FP activity in barrel cortex. The data show the effects of four different doses of NE between 100 and 5000 μm. Conventions are the same as indicated in Figure 1.
To evaluate the effect of cortical noradrenergic stimulation on spindle oscillations, we took advantage of the fact that these oscillations can be evoked by whisker deflections in anesthetized animals. Thus, we used multiwhisker stimulation (six adjacent whiskers deflected at 0.2 Hz) to evoke spindle oscillations in barrel cortex and determine the effects of CA, NE, and AT on evoked spindles. FP responses evoked by whisker stimulation consist of a large short-latency “primary response” followed by a long-latency rebound that peaks at between 100 and 175 ms (Fig. 3). The rebound is typically followed by additional peaks, reflecting an evoked spindle oscillation at ∼10 Hz (Fig. 3). The effects of the drugs on the primary responses will be described later below. Here we focus on the evoked oscillation.
Figure 3.
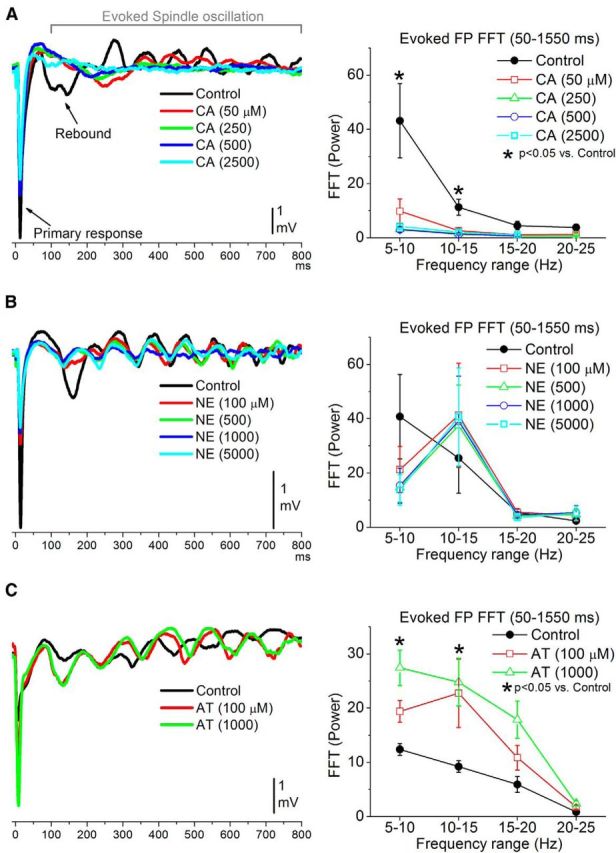
Cortical cholinergic, but not noradrenergic, stimulation abolishes spindle oscillations in barrel cortex. A, Left, Example of FP traces (average of 30 trials) evoked by multiwhisker stimulation during control and four doses of CA. Right, Population data showing the effect of CA on evoked spindle oscillations measured with FP recordings (50–1550 ms after the whisker stimulus). The plot shows the FFT power spectrum for four ranges between 5 and 25 Hz. Note that evoked spindles are abolished by CA. B, Same as A for NE doses. Note that NE does not abolish spindle oscillations (10–15 Hz range). C, Same as A for AT doses. Note that spindle oscillations are enhanced by AT.
To measure the evoked spindle oscillations, we calculated a power spectrum (FFT) of the FP activity evoked between 50 and 1550 ms after the multiwhisker stimulus. Application of CA (50–2500 μm; n = 14) abolished evoked spindle oscillations and this was reflected in significantly suppressed FP activity in the 5–15 Hz range for each dose tested (Tukey's; Fig. 3A). In contrast, application of NE (100–5000 μm; n = 10) did not abolish the evoked spindle oscillations (Fig. 3B). Instead, NE did suppress the primary response (discussed later) and its rebound, which was reflected in a tendency (not significant) to suppress the 5–10 Hz frequency range (the rebound occurs at ∼150 ms). Moreover, FP activity in the 10–15 Hz range, which reflects the spindle oscillation, was also not significantly suppressed and tended to increase (Fig. 3B). Thus, NE produces a cortical activated state consisting of suppressed firing and abolished synchronous slow oscillations, but the cortical activation seems to be devoid of concomitant thalamic activation. Finally, consistent with the effects of CA on evoked oscillations, application of AT (n = 12) significantly enhanced evoked oscillations, as reflected by an increase in the 5–10 Hz range for the highest dose (1000 μm; Tukey's), and in the 10–15 Hz range for both doses (100 and 1000 μm; Tukey's; Fig. 3C).
In conclusion, while both cortical cholinergic and noradrenergic stimulation lead to the abolishment of synchronous slow oscillations in the barrel cortex, there are major differences between the activation states they produce. First, noradrenergic stimulation consistently and sharply decreases firing rate as it abolishes synchronous slow oscillations. In contrast, cholinergic stimulation abolishes synchronous slow oscillations without affecting overall spontaneous firing rate; population firing changes from a slow oscillatory burst mode to a tonic firing mode. Second, during either cortical noradrenergic or cholinergic stimulation, slow oscillations are abolished but spontaneous and evoked spindle oscillations, which originate in the thalamus (Steriade et al., 1985), are observed selectively during noradrenergic stimulation. This indicates that cortical cholinergic activation, which changes cortical neuronal firing to a tonic mode, leads also to thalamic activation, presumably through corticothalamic synapses. In contrast, cortical noradrenergic activation, which suppresses overall cortical neuronal firing, deactivates the thalamus, presumably because it removes corticothalamic activity.
Cortical neuromodulation changes the state of the thalamus
The previous results indicate that selective cholinergic or noradrenergic cortical stimulation leads to different states in the thalamus. To address this question, we conducted an additional set of experiments in which we used high-impedance electrodes to record from single cells in the VPM thalamus during application of neuromodulators in the barrel cortex. The cells were located in VPM thalamus based on their short-latency response to whisker stimulation and on the location of the electrode tracks (Castro-Alamancos, 2002a; Aguilar and Castro-Alamancos, 2005; Hirata et al., 2006). MUA and FP recordings were done simultaneously from the barrel cortex adjacent to the microdialysis probe.
Figure 4A,B shows autocorrelations of spontaneous activity recorded from cortex MUA (top) and from single units in VPM thalamus (bottom). In both examples, CA (100 μm) was applied first, which led to typical signs of activation in barrel cortex, as already reported above; autocorrelation short-timescale peak (<20 ms) is strongly suppressed. During control, the VPM cells tended to fire in bursts [Fig. 4A,B, bottom, note the large autocorrelation short-timescale peak (<20 ms) during control]. However, during CA administration in neocortex, the autocorrelation peak was strongly suppressed, indicating a suppression of burst firing and a change to tonic firing. Application of NE (500 μm) into the neocortex produced the typical signs of activation in barrel cortex already reported above; autocorrelation short-timescale peak (<20 ms) is suppressed and spontaneous spindle oscillations (∼10 Hz) can appear (Fig 4B, top, green arrow). In addition, if the VPM cells were already firing in bursts during control, application of NE in neocortex had no effect on the autocorrelation (see below). However, if the VPM cells were activated (e.g., due to recent effects of CA), application of NE in cortex rapidly returned the cells to a burst firing pattern, as shown in Figure 4B (bottom), in which NE was applied after partial recovery from previous CA.
Figure 4.
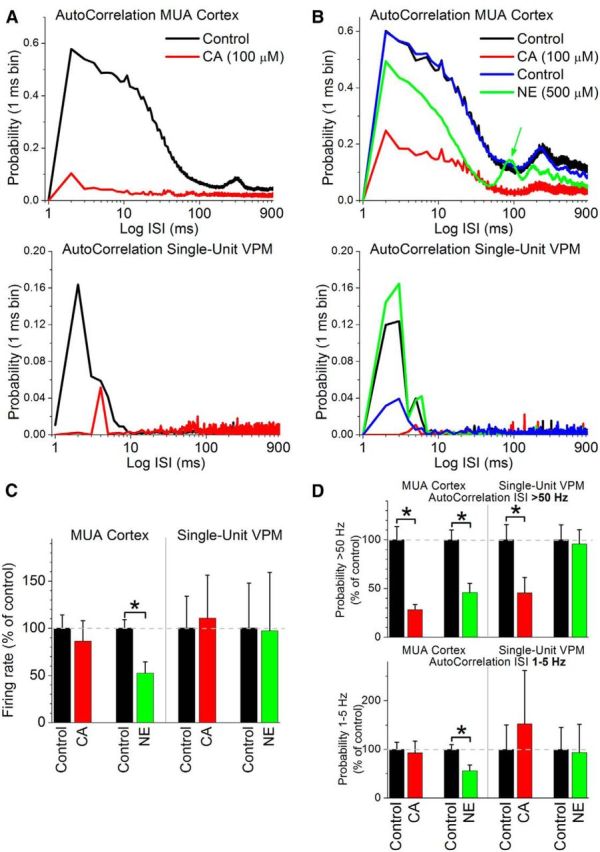
Effects of cortical cholinergic or noradrenergic activation on thalamocortical cells in VPM thalamus. A. Example of the effect of cortical cholinergic stimulation (CA) on the timing (autocorrelation) of spontaneous MUA in the barrel cortex (top) and single-unit activity in the VPM thalamus (bottom) recorded simultaneously. Note that cortical cholinergic activation also activates the thalamus by shifting firing from bursting to tonic. B, Same as A, but in this example cortical cholinergic stimulation was followed by cortical noradrenergic stimulation (NE) after returning to ACSF (control). Note that cortical noradrenegic activation deactivated the thalamus by rapidly shifting firing back to bursting. Also, note the ∼10 Hz peak [100 ms interspike interval (ISI); green arrow] in the cortex MUA during application of NE in neocortex, indicating the presence of spindle oscillations. VPM cells typically only burst during some of the cycles of the spindle oscillation (hence the lack of a peak at 10 Hz in the bottom). C, Population data showing the effect of cortical cholinergic stimulation (CA, 100 μm, n = 8) or cortical noradrenergic stimulation (NE, 500 μm, n = 11) on spontaneous firing rate measured simultaneously from MUA in cortex and single units in VPM. *p < 0.05 versus control. D, Same as C, showing the effect on the timing (autocorrelation) of spontaneous firing measured simultaneously from MUA in cortex and single units in VPM. The top panel depicts the change in high-frequency firing probability (>50 Hz; <20 ms ISI), while the bottom shows the change in low-frequency firing probability (between 1 and 5 Hz; 200–1000 ms ISI). Note the significant suppression in VPM burst firing (>50 Hz; <20 ms ISI) caused by application of CA in cortex.
Population data (Fig. 4C,D) reveals that, while the firing rate of VPM cells (overall number of spikes; Fig. 4C) was not significantly affected by selective cortical cholinergic or noradrenergic activation, spike timing was significantly affected. In particular, application of CA in neocortex (100 μm; n = 8) had no significant effect on spontaneous firing rate of either cortex MUA or VPM single units (Fig. 4C; Wilcoxon). However, application of CA in neocortex significantly suppressed spike timing <20 ms of both cortex MUA and VPM single units (Fig. 4D, top; Wilcoxon), but not spike timing between 200 and 1000 ms (Fig. 4B, bottom). The results indicate that during cortical cholinergic activation, VPM cells shift from a bursting to a tonic pattern. This effect was observed in five of the eight cells tested. The other three cells either did not burst during control or were unaffected.
In contrast to the effects of CA, application of NE in neocortex (500 μm; n = 11) significantly suppressed spontaneous firing rate of cortex MUA (as described above), but not of VPM single units (Fig. 4C; Wilcoxon). Moreover, application NE in neocortex significantly suppressed spike timing <20 ms and between 200 and 1000 ms of cortex MUA, but not of single units in VPM (Fig. 4D; Wilcoxon). These results indicate that selective cortical noradrenergic activation can deactivate the thalamus, but has no effect on an already deactivated thalamus, while cortical cholinergic activation activates the thalamus by shifting spontaneous firing from bursting to tonic firing.
Effect of cortical cholinergic activation on whisker-evoked responses
We next explored the effects of cholinergic activation on sensory responses evoked in the barrel cortex by single-whisker or multiwhisker deflections delivered at low (0.2 Hz) or high (10 Hz) frequency. We have characterized these whisker-evoked responses in both the somatosensory thalamus and barrel cortex using intracellular, single-unit, and FP recordings (Hirata et al., 2006, 2009; Hirata and Castro-Alamancos, 2008; Hirata and Castro-Alamancos, 2011). In a previous study, we also measured the effect of cortical cholinergic activation on whisker-evoked FP responses, but different levels (doses) of cholinergic stimulation were not explored, unit activity was not considered, and only multiwhisker stimuli were tested (Oldford and Castro-Alamancos, 2003).
Application of CA at four different doses (50–2500 μm; n = 14) led to a significant suppression of the primary peak (5–30 ms) of the FP response (Figs. 5A, 6A) evoked by low-frequency whisker stimulation (the color-coded asterisks at the base of each plot denote statistically significant differences compared with control; Tukey's). The suppression was significant for responses evoked by multiwhisker, PW, and Aw1 stimuli and for all four doses tested, but not for much smaller responses evoked by Aw2–Aw5. Lower doses (data not shown) had either a slight enhancing effect (0.5–1 μm) that was not statistically significant or had no effect (10 μm). Similarly, MUA responses were suppressed by cholinergic stimulation, depending on the dose, but this effect was stronger for longer-latency components of the response (Figs. 5B, 6B,C). Thus, we measured two different windows of the MUA response: a short-latency response window (5–15 ms) and a long-latency response window (16–50 ms). All doses of CA suppressed the short-latency response evoked by multiwhisker stimulation, and the lowest dose also suppressed the PW response (Fig. 6B). All doses of CA suppressed the long-latency response for much wider set of stimuli, including multiwhisker, PW, Aw1, and Aw2 (Fig. 6C).
Figure 5.
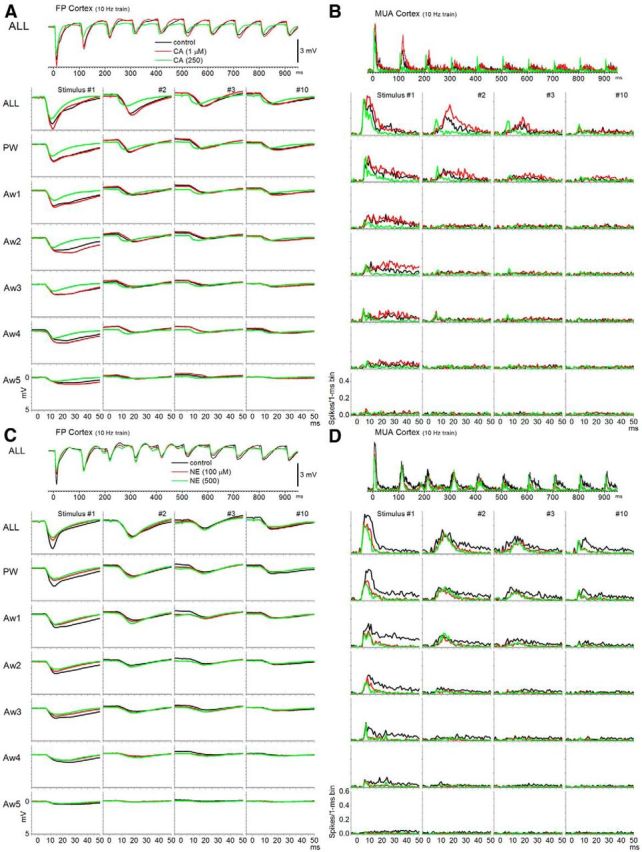
Effects of cortical neuromodulation on whisker responses in barrel cortex. Population FP and peristimulus time histograms (PSTHs) showing responses evoked by simultaneous multiwhisker (ALL) and single-whisker stimulation of the PW and five adjacent whiskers (Aw1–Aw5) during control (black traces) and during two doses of CA (A, B) and NE (C, D). The whisker stimulation consisted of 10 stimuli delivered at 10 Hz. The lower panels show the responses evoked by stimulus numbers 1, 2, 3, and 10 of the 10 Hz train.
Figure 6.
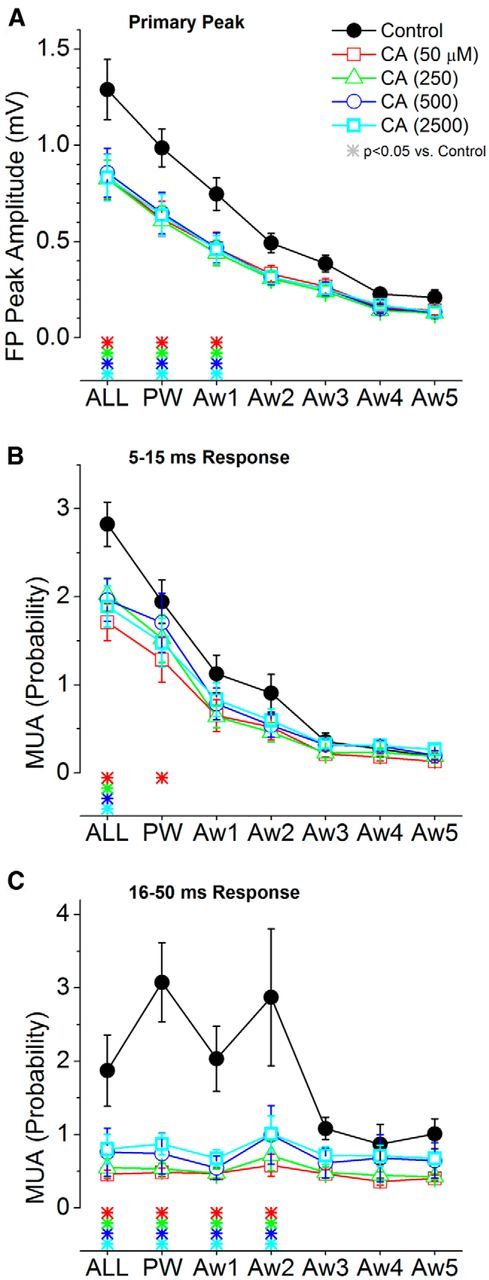
Population data measuring the effect of cortical cholinergic activation on barrel cortex responses evoked by low-frequency whisker deflections. A, Primary negative peak amplitude of barrel cortex FP responses measured within a 5–30 ms window poststimulus during control and four doses of CA. The plot depicts the responses evoked by multiwhisker stimulation (6 whiskers simultaneously; ALL), the PW, and each of five adjacent whiskers (Aw1–Aw5) surrounding the PW. The color-coded asterisks at the bottom mark significant differences between control and each drug dose. B, Same as A, but MUA barrel cortex responses are measured during a short-latency (5–15 ms) window poststimulus. C, Same as A, but MUA barrel cortex responses are measured during a long-latency (16–50 ms) window poststimulus.
Figure 7 shows measurements of the responses evoked by trains of 10 whisker stimuli at 10 Hz. Only multiwhisker, PW, and Aw1 responses are shown because Aw2–Aw6 responses are rather small (especially when adapted by 10 Hz trains), and the effects of CA on them are negligible. Responses to 10 Hz trains have three components (Hirata et al., 2009). First, the low-frequency response evoked by the first stimulus is similar to those evoked by single low-frequency stimuli (already described above and not described here). Second, the following few stimuli (∼2–5) evoke “transition responses” that are very strongly adapted due to the effect of synaptic inhibition in subcortical structures; this transient adaptation is relieved by GABA receptor blockers in the thalamus. Finally, the last few stimuli (∼6–10) produce steady-state response adaptation, which is unaffected by subcortical inhibition (Hirata et al., 2009). Thus, response adaptation is not linear within a train. We found that the three lowest doses of CA (50–500 μm) suppressed low-frequency and steady-state FP and MUA responses but not transition responses evoked by multiwhisker and PW stimulation. In contrast, the highest dose of CA (2500 μm) selectively enhanced FP and short-latency transition responses evoked by multiwhisker and PW simulation, but not long-latency MUA responses, which were suppressed. In conclusion, during low-frequency stimulation, CA suppresses the strongest responses in barrel cortex, which are evoked by multiwhisker stimulation and the two most effective whiskers (PW and Aw1). During high-frequency stimulation, CA suppresses steady-state responses, but not transition responses evoked by multiwhisker stimulation or the PW. At very high doses, CA also strongly enhances the transition responses, which is consistent with an activating effect in the thalamus.
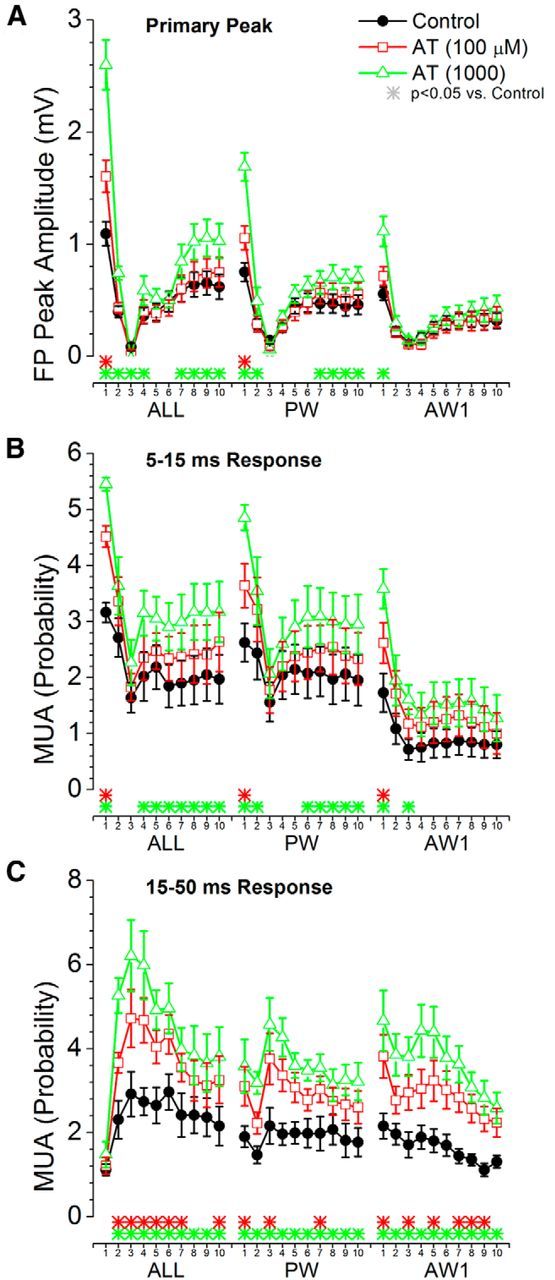
Figure 7.
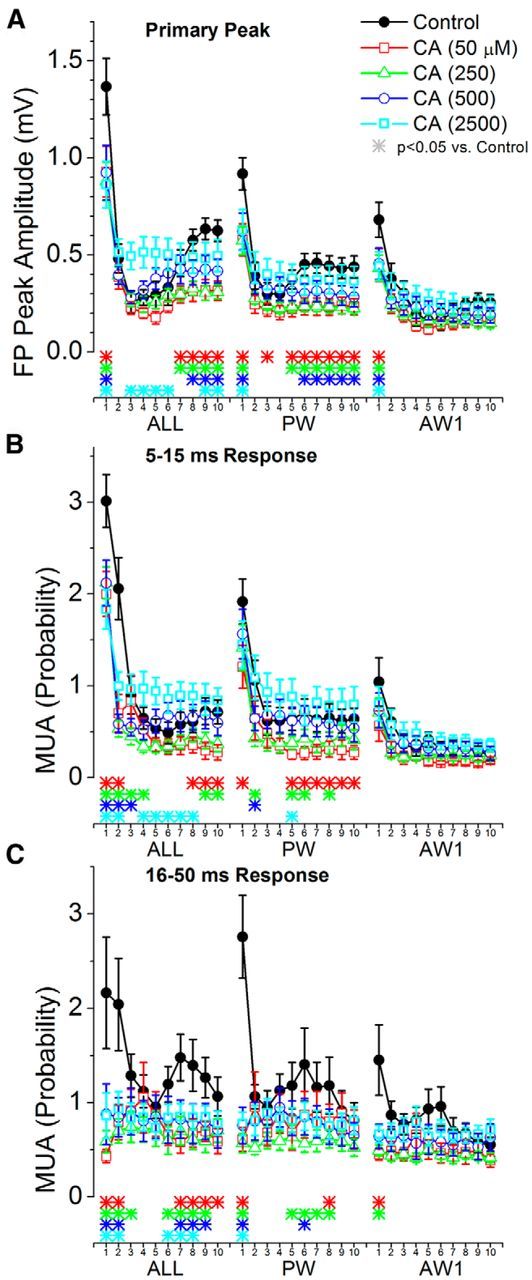
Population data measuring the effect of cortical cholinergic activation on barrel cortex responses evoked by high-frequency whisker deflections at 10 Hz. A, Primary negative peak amplitude of barrel cortex FP responses measured within a 5–30 ms window poststimulus during control and four doses of CA. The plot depicts the responses evoked by multiwhisker stimulation (6 whiskers simultaneously; ALL), the PW, and the strongest adjacent whisker (Aw1). The x-axis shows the responses evoked by each of the 10 stimuli in the 10 Hz train. The color-coded asterisks at the bottom mark significant differences between control and each drug dose for each of the stimuli in the train. B, Same as A, but MUA barrel cortex responses are measured during a short-latency (5–15 ms) window poststimulus. C, Same as A, but MUA barrel cortex responses are measured during a long-latency (16–50 ms) window poststimulus.
We next explored the effects of the muscarinic antagonist AT on whisker-evoked responses (Figs. 8, 9). AT had the opposite effect than CA on low-frequency stimuli. At the lowest dose (100 μm), CA significantly enhanced FP and MUA responses evoked by the strongest stimuli (multiwhisker, Aw1, and Aw2). At the highest dose (1000 μm), the enhancement occurred for most of the AWs, except the one evoking the weakest response (Aw5). For high-frequency stimuli (Fig. 9), AT also had the opposite effect than CA. Steady-state FP and short-latency MUA responses were enhanced by CA, while transition responses were still very strongly adapted. Long-latency MUA responses, which were suppressed by CA, were enhanced by AT.
Figure 8.
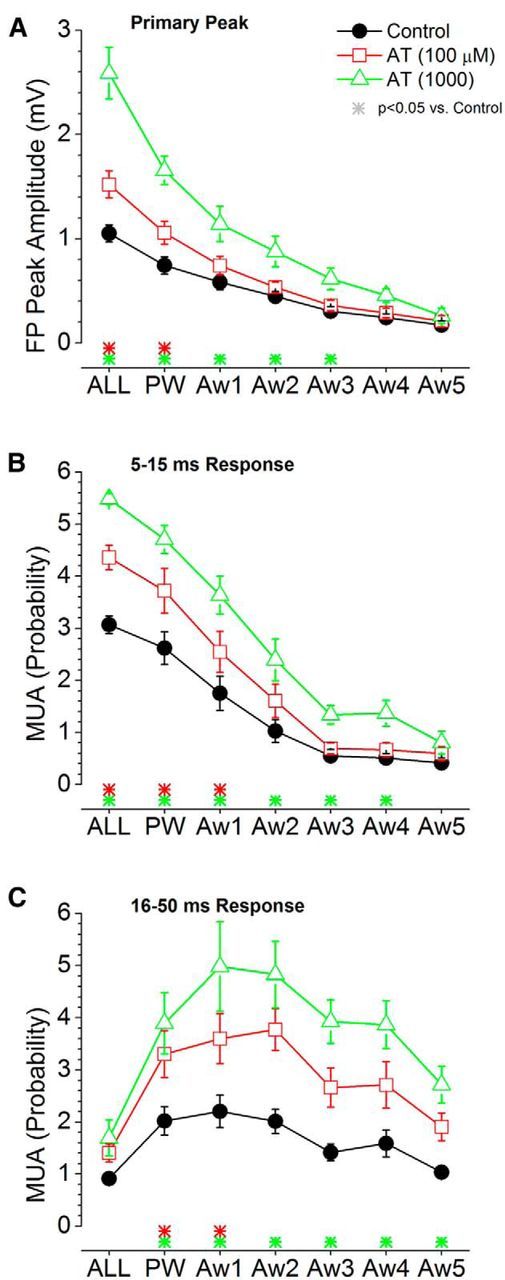
Population data measuring the effect of cortical deactivation produced by a muscarinic antagonist on barrel cortex responses evoked by low-frequency whisker deflections. A, Primary negative peak amplitude of barrel cortex FP responses measured within a 5–30 ms window poststimulus during control and two doses of AT. The plot depicts the responses evoked by multiwhisker stimulation (6 whiskers simultaneously; ALL), the PW, and each of five adjacent whiskers (Aw1–Aw5) surrounding the PW. The color-coded asterisks at the bottom mark significant differences between control and each drug dose. B, Same as A, but MUA barrel cortex responses are measured during a short-latency (5–15 ms) window poststimulus. C, Same as A, but MUA barrel cortex responses are measured during a long-latency (16–50 ms) window poststimulus.
Figure 9.
Population data measuring the effect of cortical deactivation produced by a muscarinic antagonist on barrel cortex responses evoked by high-frequency whisker deflections at 10 Hz. A, Primary negative peak amplitude of barrel cortex FP responses measured within a 5–30 ms window poststimulus during control and two doses of AT. The plot depicts the responses evoked by multiwhisker stimulation (6 whiskers simultaneously; ALL), the PW, and the strongest adjacent whisker (Aw1). The x-axis shows the responses evoked by each of the 10 stimuli in the 10 Hz train. The color-coded asterisks at the bottom mark significant differences between control and each drug dose for each of the stimuli in the train. B, Same as A, but MUA barrel cortex responses are measured during a short-latency (5–15 ms) window poststimulus. C, Same as A, but MUA barrel cortex responses are measured during a long-latency (16–50 ms) window poststimulus.
The results indicate that cortical cholinergic stimulation suppresses sensory responses evoked by the strongest whisker stimuli. Response adaptation produced by high-frequency trains becomes more linear (adapted responses within a train are similar), and at high doses the amount of adaptation is reduced, likely because of an activating effect in the thalamus.
Effect of cortical noradrenergic activation on whisker-evoked responses
Application of NE at four different doses (100–5000 μm; n = 10) led to a significant suppression of the primary peak (5–30 ms) of the FP response (Figs. 5C, 10A) evoked by low-frequency whisker stimulation. This suppression was significant for responses evoked by multiwhisker, PW, and Aw1–Aw3 stimuli, depending on the dose. At higher doses, the suppression involved more AWs. Similarly, MUA responses were suppressed by noradrenegic stimulation, and this effect was stronger for longer-latency components of the response (Figs. 5D, 9B,C). All doses of NE suppressed the short-latency responses evoked by multiwhisker, PW, Aw1, and Aw2 (Fig. 10B), and the highest dose also suppressed Aw3. All doses of NE suppressed the long-latency response evoked by all stimuli at low frequency (Fig. 9C).
Figure 10.
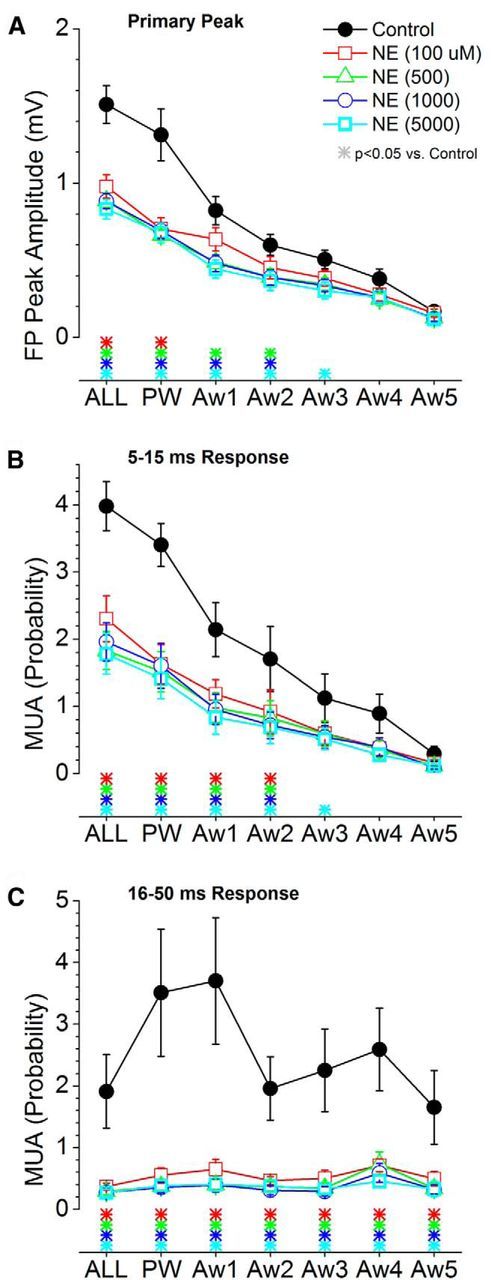
Population data measuring the effect of cortical noradrenergic activation on barrel cortex responses evoked by low-frequency whisker deflections. A, Primary negative peak amplitude of barrel cortex FP responses measured within a 5–30 ms window poststimulus during control and four doses of NE. The plot depicts the responses evoked by multiwhisker stimulation (6 whiskers simultaneously; ALL), the PW, and each of five adjacent whiskers (Aw1–Aw5) surrounding the PW. The color-coded asterisks at the bottom mark significant differences between control and each drug dose. B, Same as A, but MUA barrel cortex responses are measured during a short-latency (5–15 ms) window poststimulus. C, Same as A, but MUA barrel cortex responses are measured during a long-latency (16–50 ms) window poststimulus.
Figure 11 shows measurements of the responses evoked by trains of 10 whisker stimuli at 10 Hz for multiwhisker, PW, and Aw1. We found that all doses of NE suppressed low-frequency and steady-state FP and short-latency MUA responses, but not transition responses, evoked by multiwhisker and PW stimulation. NE suppressed transition and steady-state long-latency MUA responses evoked by the multiwhisker, PW, and AW1-AW3 (Fig 11C), but had no significant effect on those responses evoked by Aw4 and Aw5 (data not shown).
Figure 11.
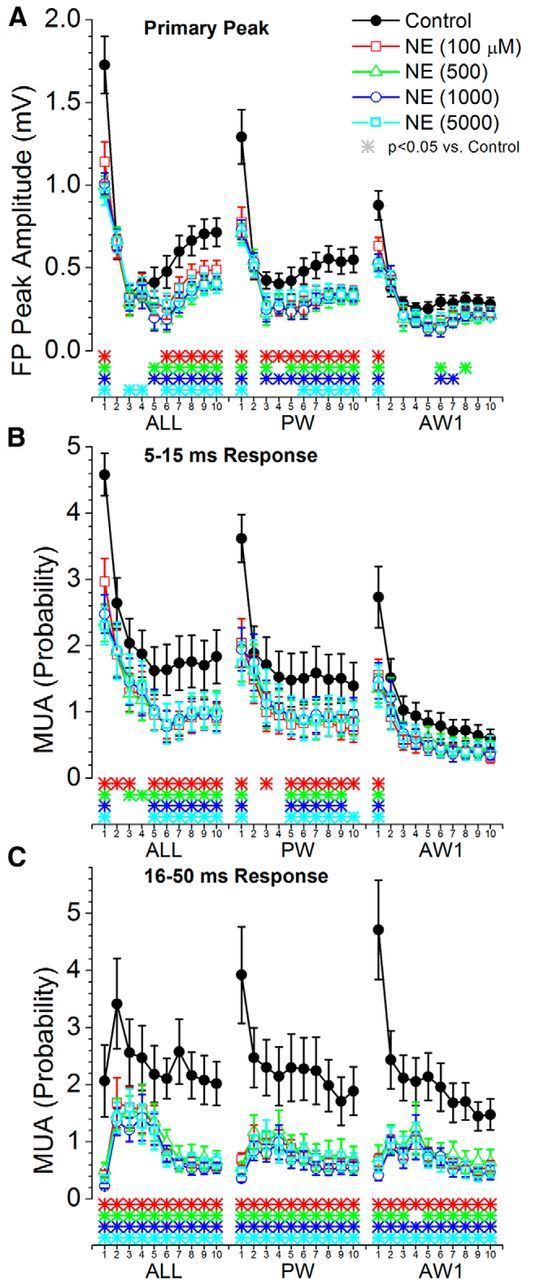
Population data measuring the effect of cortical noradrenergic activation on barrel cortex responses evoked by high-frequency whisker deflections at 10 Hz. A, Primary negative peak amplitude of barrel cortex FP responses measured within a 5–30 ms window poststimulus during control and four doses of NE. The plot depicts the responses evoked by multiwhisker stimulation (6 whiskers simultaneously; ALL), the PW, and the strongest adjacent whisker (Aw1). The x-axis shows the responses evoked by each of the 10 stimuli in the 10 Hz train. The color-coded asterisks at the bottom mark significant differences between control and each drug dose for each of the stimuli in the train. B, Same as A, but MUA barrel cortex responses are measured during a short-latency (5–15 ms) window poststimulus. C, Same as A, but MUA barrel cortex responses are measured during a long-latency (6–50 ms) window poststimulus.
These results indicate that cortical noradrenergic stimulation suppresses sensory responses without altering transient adaptation to high-frequency trains, which indicates a lack of activation in the thalamus.
Discussion
Cortical cholinergic and noradrenergic neuromodulation produces distinct states
The present results reveal that selective cortical cholinergic and noradrenergic stimulation produces different activated states in the barrel cortex. A low tone of cholinergic stimulation may boost the deactivated state by enhancing synchronous slow oscillations. A higher tone of cholinergic stimulation readily activates the cortex by abolishing synchronous slow oscillations and shifting firing rate to a tonic mode, without altering overall firing rate. This transition in cortical state causes the thalamus itself to become activated, presumably via corticothalamic activity. A very high tone of cholinergic stimulation produces a similar activated state with significantly higher tonic firing rate. In contrast, noradrenergic cortical stimulation activates the cortex by abolishing synchronous slow oscillations and suppressing overall firing rate. The noradrenergic cortical activated state does not lead to thalamic activation, presumably because corticothalamic activity is also suppressed. In fact, the thalamus tends to be more deactivated with higher levels of cortical noradrenergic stimulation.
The effects of cortical neuromodulation on spontaneous slow oscillations are consistent with the effects of these same drugs in adult cortical slices that express spontaneous slow oscillations (Favero et al., 2012). Both of these neuromodulators abolish spontaneous and evoked Up states in slices of somatosensory cortex. This effect is associated with a dampening of the excitability of identified pyramidal cells and of the excitatory conductance of cortical synapses. In contrast, identified fast-spiking inhibitory neurons are excited by NE, but not by CA (Kawaguchi and Shindou, 1998; Favero et al., 2012). One possibility is that noradrenergic cortical activation suppresses overall excitatory cell firing by increasing the firing of inhibitory neurons, which drives synaptic inhibition. In fact, in the somatosensory thalamus, NE robustly drives the firing of GABAergic cells in the reticular nucleus, which leads to the suppression of spontaneous firing in thalamocortical cells (Hirata et al., 2006).
Selective manipulation of cholinergic cells in the basal forebrain in vivo with optogenetics produces effects in the visual cortex that are consistent with those observed here on spontaneous activity during selective cortical cholinergic stimulation in the barrel cortex (Pinto et al., 2013). In addition, the levels of acetylcholine change in the brain during different behavioral states (Williams et al., 1994), and these different cholinergic tones may be associated with the distinct dose-dependent effects of cortical cholinergic stimulation we observed. Also, selective optogenetic stimulation of the locus ceruleus causes wakefulness and EEG activation (Carter et al., 2010). The results we observed on cortical cells are also consistent with previous findings using iontophoresis, which produces a much more localized action at the level of single cells. Cholinergic activation increases firing in some cells (Herrero et al., 2008) while noradrenergic activation is associated with a suppression of firing and receptive fields (George, 1992; Ego-Stengel et al., 2002).
Sensory responses are suppressed by both cortical activated states
The effects of these distinct cortical activations on sensory responses in barrel cortex are consistent with the previously described effects of forebrain activation. A suppression and focusing of sensory responses in barrel cortex during activated states has been demonstrated repeatedly in both anesthetized and behaving animals (Castro-Alamancos and Oldford, 2002; Castro-Alamancos, 2002b, 2004a,b; Hirata and Castro-Alamancos, 2011). Here we found that sensory responses to low-frequency stimuli are suppressed by either cholinergic or noradrenergic cortical stimulation. The suppression occurs primarily for the strongest responses, which are evoked by multiwhisker, PW, and the strongest AW stimulation. The suppression is more widespread (involving weaker whiskers, which have longer latency responses) when longer latency components of the response are considered (16–50 ms). By suppressing sensory responses, the receptive fields become more selective for the PW, and long-latency response components are abolished, which results in a sharper, more focused cortical response (Castro-Alamancos, 2002b). Interestingly, the contrast between the PW and multiwhisker stimulation, which produces stronger responses to multiwhisker stimulation (Hirata and Castro-Alamancos, 2008), is still evident during cortical activation.
The effects on high-frequency sensory responses depend on whether the thalamus is activated by the cortical activation. This is expected because thalamic activation controls rapid sensory adaptation both in the thalamus (Castro-Alamancos, 2002a; Aguilar and Castro-Alamancos, 2005; Hirata et al., 2006) and in the cortex (Castro-Alamancos and Oldford, 2002; Castro-Alamancos, 2004a; Hirata and Castro-Alamancos, 2011). Thus, during cortical cholinergic activation, which also activates the thalamus, the transient adaptation that occurs during the first few stimuli in a train is abolished so that rapid sensory adaptation becomes more linear; transient and steady-state adaptation is not different. During cortical noradrenergic activation, which deactivates the thalamus, the stronger transient adaptation is unaffected while steady-state adaptation is suppressed. Thus, unlike for cortical cholinergic activation, there is still a difference between transient and steady-state adaptation during cortical noradrenergic activation. In other words, cortical sensory responses evoked by high-frequency whisker stimulation during cortical noradrenergic activation resemble responses evoked during cortical deactivation but are much more suppressed.
The effects of cortical neuromodulation on cortical whisker responses contrast with the effects of these neuromodulators in the thalamus. In the thalamus, cholinergic activation enlarges the receptive fields of VPM neurons and facilitates their response to high-frequency stimuli, reducing rapid sensory adaptation (Castro-Alamancos, 2002a; Aguilar and Castro-Alamancos, 2005; Hirata et al., 2006). In contrast, cortical cholinergic activation suppresses receptive fields in the cortex. Only high doses, which activate the thalamus, reduce rapid sensory adaptation. In the thalamus, noradrenergic activation abolishes spontaneous firing of VPM neurons without suppressing sensory responses, which leads to a large increase in signal-to-noise ratios (Hirata et al., 2006). In the cortex, noradrenergic activation suppresses both sensory responses and spontaneous firing, which does not lead to an evident enhancement in signal-to-noise ratios of population responses.
Cortical neuromodulation controls thalamic activation and deactivation
We have previously shown that thalamic neuromodulation per se changes the state of the barrel cortex (Castro-Alamancos and Oldford, 2002; Hirata and Castro-Alamancos, 2010). An important finding of the present study is that the opposite is also true. Namely, cortical neuromodulation changes the state of the thalamus. This is consistent with the well known role of corticothalamic activity in modulating the state of the thalamus (Sherman and Guillery, 1998). In addition, corticothalamic cells are notorious for their lack of activity, even in awake animals (Swadlow and Weyand, 1987). Although, we did not record from corticothalamic cells, the effects observed in the thalamus are likely driven by activity in these cells. We speculate that the expression of corticothalamic activity requires robust cortical cholinergic activation.
By controlling the activity of thalamocortical and corticothalamic cells, and consequently their synapses, neuromodulators can control the state of their respective targets without having to be released there directly. This may be useful to assure that both structures are in the same state when either of them is activated or deactivated, which may be essential because of the extensive connectivity between both of these structures. Alternatively, neuromodulators may be able to set a myriad of distinct states by controlling the state of the thalamus and neocortex both directly and indirectly.
Footnotes
This work was supported by the National Institutes of Health.
The authors declare no competing financial interests.
References
- Aguilar JR, Castro-Alamancos MA. Spatiotemporal gating of sensory inputs in thalamus during quiescent and activated states. J Neurosci. 2005;25:10990–11002. doi: 10.1523/JNEUROSCI.3229-05.2005. [DOI] [PMC free article] [PubMed] [Google Scholar]
- Carter ME, Yizhar O, Chikahisa S, Nguyen H, Adamantidis A, Nishino S, Deisseroth K, de Lecea L. Tuning arousal with optogenetic modulation of locus coeruleus neurons. Nat Neurosci. 2010;13:1526–1533. doi: 10.1038/nn.2682. [DOI] [PMC free article] [PubMed] [Google Scholar]
- Castro-Alamancos MA. Origin of synchronized oscillations induced by neocortical disinhibition in vivo. J Neurosci. 2000;20:9195–9206. doi: 10.1523/JNEUROSCI.20-24-09195.2000. [DOI] [PMC free article] [PubMed] [Google Scholar]
- Castro-Alamancos MA. Different temporal processing of sensory inputs in the rat thalamus during quiescent and information processing states in vivo. J Physiol. 2002a;539:567–578. doi: 10.1113/jphysiol.2001.013283. [DOI] [PMC free article] [PubMed] [Google Scholar]
- Castro-Alamancos MA. Role of thalamocortical sensory suppression during arousal: focusing sensory inputs in neocortex. J Neurosci. 2002b;22:9651–9655. doi: 10.1523/JNEUROSCI.22-22-09651.2002. [DOI] [PMC free article] [PubMed] [Google Scholar]
- Castro-Alamancos MA. Absence of rapid sensory adaptation in neocortex during information processing states. Neuron. 2004a;41:455–464. doi: 10.1016/S0896-6273(03)00853-5. [DOI] [PubMed] [Google Scholar]
- Castro-Alamancos MA. Dynamics of sensory thalamocortical synaptic networks during information processing states. Prog Neurobiol. 2004b;74:213–247. doi: 10.1016/j.pneurobio.2004.09.002. [DOI] [PubMed] [Google Scholar]
- Castro-Alamancos MA. Cortical up and activated states: implications for sensory information processing. Neuroscientist. 2009;15:625–634. doi: 10.1177/1073858409333074. [DOI] [PMC free article] [PubMed] [Google Scholar]
- Castro-Alamancos MA, Borrell J. Motor activity induced by disinhibition of the primary motor cortex of the rat is blocked by a non-NMDA glutamate receptor antagonist. Neurosci Lett. 1993;150:183–186. doi: 10.1016/0304-3940(93)90531-O. [DOI] [PubMed] [Google Scholar]
- Castro-Alamancos MA, Connors BW. Short-term plasticity of a thalamocortical pathway dynamically modulated by behavioral state. Science. 1996;272:274–277. doi: 10.1126/science.272.5259.274. [DOI] [PubMed] [Google Scholar]
- Castro-Alamancos MA, Oldford E. Cortical sensory suppression during arousal is due to the activity-dependent depression of thalamocortical synapses. J Physiol. 2002;541:319–331. doi: 10.1113/jphysiol.2002.016857. [DOI] [PMC free article] [PubMed] [Google Scholar]
- Constantinople CM, Bruno RM. Effects and mechanisms of wakefulness on local cortical networks. Neuron. 2011;69:1061–1068. doi: 10.1016/j.neuron.2011.02.040. [DOI] [PMC free article] [PubMed] [Google Scholar]
- Ego-Stengel V, Bringuier V, Shulz DE. Noradrenergic modulation of functional selectivity in the cat visual cortex: an in vivo extracellular and intracellular study. Neuroscience. 2002;111:275–289. doi: 10.1016/S0306-4522(02)00011-8. [DOI] [PubMed] [Google Scholar]
- Favero M, Varghese G, Castro-Alamancos MA. The state of somatosensory cortex during neuromodulation. J Neurophysiol. 2012;108:1010–1024. doi: 10.1152/jn.00256.2012. [DOI] [PMC free article] [PubMed] [Google Scholar]
- George MJ. Modification of receptive fields of posteriomedial barrel subfield neocortical single units by known concentrations of iontophoresed noradrenaline in the rat. Int J Neurosci. 1992;65:69–81. doi: 10.3109/00207459209003279. [DOI] [PubMed] [Google Scholar]
- Harris KD, Thiele A. Cortical state and attention. Nat Rev Neurosci. 2011;12:509–523. doi: 10.1038/nrn3084. [DOI] [PMC free article] [PubMed] [Google Scholar]
- Herrero JL, Roberts MJ, Delicato LS, Gieselmann MA, Dayan P, Thiele A. Acetylcholine contributes through muscarinic receptors to attentional modulation in V1. Nature. 2008;454:1110–1114. doi: 10.1038/nature07141. [DOI] [PMC free article] [PubMed] [Google Scholar]
- Hirata A, Castro-Alamancos MA. Cortical transformation of wide-field (multiwhisker) sensory responses. J Neurophysiol. 2008;100:358–370. doi: 10.1152/jn.90538.2008. [DOI] [PMC free article] [PubMed] [Google Scholar]
- Hirata A, Castro-Alamancos MA. Neocortex network activation and deactivation states controlled by the thalamus. J Neurophysiol. 2010;103:1147–1157. doi: 10.1152/jn.00955.2009. [DOI] [PMC free article] [PubMed] [Google Scholar]
- Hirata A, Castro-Alamancos MA. Effects of cortical activation on sensory responses in barrel cortex. J Neurophysiol. 2011;105:1495–1505. doi: 10.1152/jn.01085.2010. [DOI] [PMC free article] [PubMed] [Google Scholar]
- Hirata A, Aguilar J, Castro-Alamancos MA. Noradrenergic activation amplifies bottom-up and top-down signal-to-noise ratios in sensory thalamus. J Neurosci. 2006;26:4426–4436. doi: 10.1523/JNEUROSCI.5298-05.2006. [DOI] [PMC free article] [PubMed] [Google Scholar]
- Hirata A, Aguilar J, Castro-Alamancos MA. Influence of subcortical inhibition on barrel cortex receptive fields. J Neurophysiol. 2009;102:437–450. doi: 10.1152/jn.00277.2009. [DOI] [PMC free article] [PubMed] [Google Scholar]
- Kawaguchi Y, Shindou T. Noradrenergic excitation and inhibition of GABAergic cell types in rat frontal cortex. J Neurosci. 1998;18:6963–6976. doi: 10.1523/JNEUROSCI.18-17-06963.1998. [DOI] [PMC free article] [PubMed] [Google Scholar]
- Lee SH, Dan Y. Neuromodulation of brain states. Neuron. 2012;76:209–222. doi: 10.1016/j.neuron.2012.09.012. [DOI] [PMC free article] [PubMed] [Google Scholar]
- Moruzzi G, Magoun HW. Brain stem reticular formation and activation of the EEG. Electroencephalogr Clin Neurophysiol. 1949;1:455–473. doi: 10.1016/0013-4694(49)90219-9. [DOI] [PubMed] [Google Scholar]
- Oldford E, Castro-Alamancos MA. Input-specific effects of acetylcholine on sensory and intracortical evoked responses in the “barrel cortex” in vivo. Neuroscience. 2003;117:769–778. doi: 10.1016/S0306-4522(02)00663-2. [DOI] [PubMed] [Google Scholar]
- Pinto L, Goard MJ, Estandian D, Xu M, Kwan AC, Lee SH, Harrison TC, Feng G, Dan Y. Fast modulation of visual perception by basal forebrain cholinergic neurons. Nat Neurosci. 2013;16:1857–1863. doi: 10.1038/nn.3552. [DOI] [PMC free article] [PubMed] [Google Scholar]
- Sherman SM, Guillery RW. On the actions that one nerve cell can have on another: distinguishing “drivers” from “modulators.”. Proc Natl Acad Sci U S A. 1998;95:7121–7126. doi: 10.1073/pnas.95.12.7121. [DOI] [PMC free article] [PubMed] [Google Scholar]
- Steriade M, Deschênes M, Domich L, Mulle C. Abolition of spindle oscillations in thalamic neurons disconnected from nucleus reticularis thalami. J Neurophysiol. 1985;54:1473–1497. doi: 10.1152/jn.1985.54.6.1473. [DOI] [PubMed] [Google Scholar]
- Steriade M, Dossi RC, Nuñez A. Network modulation of a slow intrinsic oscillation of cat thalamocortical neurons implicated in sleep delta waves: cortically induced synchronization and brainstem cholinergic suppression. J Neurosci. 1991;11:3200–3217. doi: 10.1523/JNEUROSCI.11-10-03200.1991. [DOI] [PMC free article] [PubMed] [Google Scholar]
- Steriade M, Amzica F, Nuñez A. Cholinergic and noradrenergic modulation of the slow (approximately 0.3 Hz) oscillation in neocortical cells. J Neurophysiol. 1993;70:1385–1400. doi: 10.1152/jn.1993.70.4.1385. [DOI] [PubMed] [Google Scholar]
- Stoelzel CR, Bereshpolova Y, Swadlow HA. Stability of thalamocortical synaptic transmission across awake brain states. J Neurosci. 2009;29:6851–6859. doi: 10.1523/JNEUROSCI.5983-08.2009. [DOI] [PMC free article] [PubMed] [Google Scholar]
- Swadlow HA, Weyand TG. Corticogeniculate neurons, corticotectal neurons, and suspected interneurons in visual cortex of awake rabbits: receptive-field properties, axonal properties, and effects of EEG arousal. J Neurophysiol. 1987;57:977–1001. doi: 10.1152/jn.1987.57.4.977. [DOI] [PubMed] [Google Scholar]
- Vanderwolf CH. Cerebral activity and behavior: control by central cholinergic and serotonergic systems. Int Rev Neurobiol. 1988;30:225–340. doi: 10.1016/S0074-7742(08)60050-1. [DOI] [PubMed] [Google Scholar]
- Wester JC, Contreras D. Differential modulation of spontaneous and evoked thalamocortical network activity by acetylcholine level in vitro. J Neurosci. 2013;33:17951–17966. doi: 10.1523/JNEUROSCI.1644-13.2013. [DOI] [PMC free article] [PubMed] [Google Scholar]
- Williams JA, Comisarow J, Day J, Fibiger HC, Reiner PB. State-dependent release of acetylcholine in rat thalamus measured by in vivo microdialysis. J Neurosci. 1994;14:5236–5242. doi: 10.1523/JNEUROSCI.14-09-05236.1994. [DOI] [PMC free article] [PubMed] [Google Scholar]
- Zhao S, Ting JT, Atallah HE, Qiu L, Tan J, Gloss B, Augustine GJ, Deisseroth K, Luo M, Graybiel AM, Feng G. Cell type-specific channelrhodopsin-2 transgenic mice for optogenetic dissection of neural circuitry function. Nat Methods. 2011;8:745–752. doi: 10.1038/nmeth.1668. [DOI] [PMC free article] [PubMed] [Google Scholar]