

Abstract
Cellular behavior depends on and also modifies protein concentration and activity. An integrated cellular and gene interaction model is proposed to reveal this relationship. In this model, protein activity varies spatiotemporally with cellular location, gene interaction, and diffusion. In the meanwhile, cellular behavior can vary spatially, driven by cell-cell signaling and inhomogeneous protein distribution across cells. This model integrates two components. The first component adopts a variation of the reaction-diffusion mechanism at the gene expression level. The second component is a lattice cellular model based on the Differential Adhesion Hypothesis for cell sorting at the cellular level. Cell sorting and tumor invasion were simulated to illustrate the model. This model approximates cellular pattern formation more closely than existing models based on cell density.
Keywords: multi-scale modeling, cell adhesion, cell migration, tumor invasion
1 Introduction
Spatiotemporal cellular pattern formation is a complex multi-scale process consisting of diverse molecular and cellular interactions. To describe such an intricate process, a number of approaches have been proposed. A widely used strategy is to model gene interactions at the molecular level to account for pre-cellular pattern formation, by providing positional information for cell arrangement. An example is the reaction-diffusion system, originated from Turing’s seminal theoretical work on morphogenesis (Turing 1952). In this model, change in the concentration of a protein molecule is determined by its participation in chemical reactions and diffusion from surrounding compartments. Stripe formation has been well studied for the fruit fly embryo, where the reaction-diffusion mechanism is used to describe spatiotemporal dynamics of maternal genes (Li and Chen 2009, Jaeger et al. 2004).
Another strategy is to model cellular patterns directly without molecular information. This strategy is employed by two approaches. In the first approach, cells are represented as density fields, and change in cell density is modeled as a continuous response to mitosis, cell motion and cell death. This approach has been applied to model limb morphology (Murray 2004), tumor invasion and metastasis (Anderson and Chaplain 2000). The other approach is cellular automata, where cells are modeled as many discrete entities rather than one density field. An emergent model is the Cellular Potts model (CPM), an extension of Ising model (Glazier et al. 2007). In CPM, a cell consists of several spins whose values change randomly during Monte Carlo steps. Cellular sorting is driven by reducing surface free energy defined by a Hamiltonian function (Graner and Glazier 1992) in the CPM.
Both continuous and discrete cellular models have been extended to integrate molecular interactions. Murray proposed a continuous mechano-chemical model across cellular and molecular levels to study vascular networks, brain tumor growth and wound healing (Murray 2004). Jiang and colleagues used a hybrid model integrating CPM with chemical reaction-diffusion to model avascular tumor growth (Jiang et al. 2005). Broadly speaking, density-based models are powerful for homogeneous systems and individual-cell-based models are more suitable for heterogeneous systems such as cell sorting.
In this paper, we propose a multi-scale mathematical model to study cellular pattern formation. At the molecular level, we use density-based reaction-diffusion mechanism. At the cellular level, individual-cell-based representation and adhesion energy function are applied. Departing from existing models, we compute cell-cell adhesion by an adhesive strength proportionate to the expression of key genes regulating cell adhesion. This captures the biological process of cells adhering to each other and to the extracellular matrix via cell adhesion molecules (CAMs) such as selectins, integrins, and cadherins. The adhesive strength is proportional to the number of CAMs (Steinberg and Takeichi 1994). We consider cellulartype dependent gene-gene interactions and assume cells sparsely occupy the space. These extensions to existing multi-scale models aim at a more realistic delineation of molecular and cellular systems. To demonstrate the capacity of our proposed modeling method, we simulated two biological processes. The first one is cell rearrangement by inhibitory gene regulation. The second is tumor cell invasion to and degradation of the extracellular matrix. These simulation studies suggest that our integrated model can give more realistic dynamic results in cellular pattern formation than the pre-pattern models (Jaeger 2004) and the fixed cell adhesion models (Graner and Glazier 1992).
2 The integrated cellular and molecular model
We define an integrated cellular and molecular model, whose system diagram is shown in Figure 1. The system consists of two interconnected subsystems, one at the cellular level and the other at the molecular level. The cellular subsystem takes the spatiotemporal distribution of protein concentrations as the input, giving rise to cellular pattern formation. At the lower level, the molecular subsystem maintains protein dynamics through gene expression regulation. This subsystem accepts cellular spatial distribution, which derives from the cellular subsystem, as the input.
Figure 1.
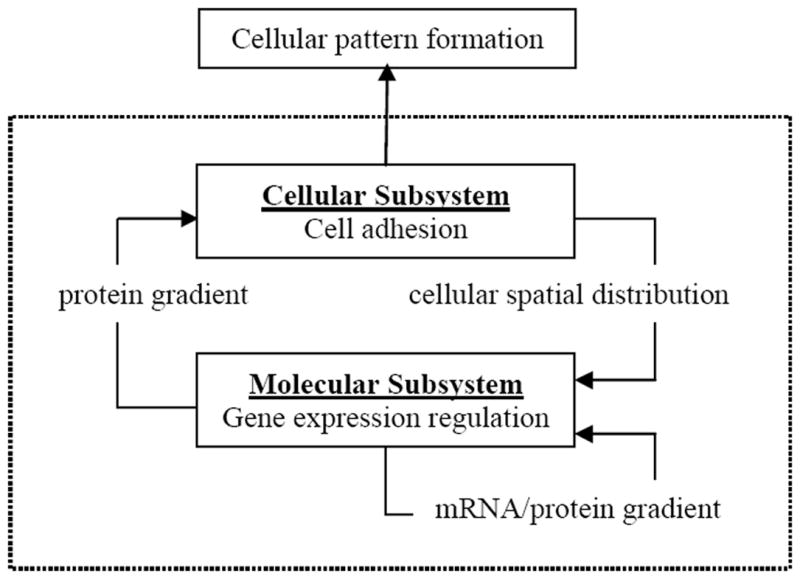
The system diagram of the integrated cellular and molecular model. The model includes the cellular and molecular subsystems. The two subsystems communicate via protein gradients and cellular spatial distribution. Within the cellular subsystem, cell movement is driven by adhesion. Within the molecular subsystem, gene regulation maintains protein dynamics.
2.1. Cellular and molecular states of the system
In our model, the space is represented as a lattice of sites. A site can be occupied by at most one cell. A cell can move from a site to its neighboring sites. Given a site s and time t, we define four functions. Let function C(s,t) represent the presence of a cell at site s and time t, defined as
Let function T(s,t) represent the type of a cell at site s and time t, defined by a natural number. Let function AS(c) be the adhesion constant of a cellular type c. We use function P(s,t,i) to specify the concentration of protein i at site s and time t and require P(s,t,i) ≥ 0 for any s, t, and i.
2.2. Molecular interactions
In the molecular subsystem, we define how each protein concentration is determined by a reaction-diffusion mechanism. We consider protein synthesis, degradation, diffusion and interaction. For each protein, we use the following differential equation to describe its rate of change at a given site:
where the symbols are defined as follows:
σi: synthesis rate coefficient of protein i
f: a sigmoid function,
mij: coefficients for synthesis regulation of protein j on protein i
hi : threshold for synthesis of protein i
sk : a neighboring site of s
D(s,sk,t): diffusion coefficient between s and sk at time t
g: a function for protein degradation,
nij: coefficients for degrading regulation of protein j on protein i
χi : degradation rate constant of protein i
The first term represents protein synthesis, the second term diffusion of protein molecules, and the third term protein degradation. The differential equations at all sites capture mRNA to protein translation and protein-protein interactions.
The diffusion coefficient D(s1,s2,t) depends on whether cells are present at sites s1 and s2. It is defined as follows:
where d1, d2, d3 are diffusion rates for three cases respectively: cells exist at neither site; one cell is present at either site; both sites are occupied. We simplify the system by assuming all proteins can penetrate and get out of cell membranes.
Some proteins are cell adhesion molecules and will directly influence cellular adhesion and eventually lead to changes in cellular patterns.
2.3. Cellular pattern formation
According to the Differential Adhesion Hypothesis (DAH; Steinberg 1962a, b), specific cellular arrangements emerge with an increased cell-cell bonding. We assign each cell an adhesive factor, and assume that the adhesive factor of a cell is directly proportional to the concentration of an adhesion protein. And the adhesion energy between two cells is the product of their adhesive factors. Specifically, we define the adhesive factor AF(s,t) of site s at time t as
where k indicates the protein that controls the cell adhesion. We define the adhesive energy AE(s1,s2,t) between two sites s1 and s2 at time t by
A central mechanism for pattern formation is a swap operation Swap(s1, s2) between the cells occupying two sites s1 and s2. The operation swaps the cells and their molecular contents and is defined by:
- Case 1. C(s1,t) = 0 AND C(s2,t) = 0:
- Skip
- Case 2. C(s1,t) = 1 AND C(s2,t) = 0:
- Exchange C(s1,t) and C(s2,t)
- Exchange T(s1,t) and T(s2,t)
- P(s2,t,i) ← P(s2,t,i) + P(s1,t,i) ∀i
- P(s1,t,i) ← 0 ∀i
- Case 3. C(s1,t) = 0 AND C(s2,t) = 1:
- Exchange C(s1,t) and C(s2,t)
- Exchange T(s1,t) and T(s2,t)
- P(s1,t,i) ← P(s1,t,i) + P(s2,t,i) ∀i
- P(s2,t,i) ← 0 ∀i
- Case 4. C(s1,t) = 1 AND C(s2,t) = 1:
- Exchange P(s1,t,i) and P(s2,t,i) ∀i
- Exchange T(s1,t) and T(s2,t)
Let ΔE(s1,s2,t) be the change in adhesive energy after swapping cells at two sites s1, s2 and time t. It is calculated as
where sm represents a neighbor site of s2; and sn represents a neighbor site of s1, and AE’ / AE are the adhesive energy after / before the swap.
Based on the principle that cells move to maximize the adhesive energy, we define an Update-Cellular-Pattern algorithm to determine and perform cell movement at every time step as follows:
Update-Cellular-Pattern
set all sites as unvisited
repeat
randomly select an unvisited site s
- select the neighbor site s’ such that
- ΔE(s, s’,t) = max { ΔE(s, sk,t) }
- with sk being a neighbor site of s
Swap(s, s’)
mark s as visited
until all sites are visited
3 Simulation studies
We carried out three simulation studies to illustrate various aspects and capabilities of our integrated model. In the first study, we model cell-sorting patterns. The result is conformable to known answers and validates our method. The second study shows cell rearrangement due to dynamic inhibitory interactions between two genes. The third study presents the simulation result for tumor cell invasion patterns.
3.1. Cell sorting based on the differential adhesion hypothesis
Cell engulfment, central migration, and transitivity of migration are some popular patterns that DAH can address. DAH states that cells adhere differentially to different cells. The different adhesion can lead to cell sorting such that more adhesive cells move to the central region and less adhesive ones move to the peripheral (Steinberg 1962a).
In a system containing two types of cell, intermixing (checkerboard), layer (onion), separate and partial closure patterns can arise depending on relative differential adhesion (Goel et al. 1975). Let λ(x,y) denote the adhesion constant between a cell of type x and a cell of type y. The conditions on differential adhesion for four typical cellular patterns are summarized in Table 1.
Table 1.
Conditions of cell-cell adhesion for four typical cellular patterns
| Pattern | Condition |
|---|---|
| Intermixing | λ(x,y) > [λ(x,x) +λ(y,y)] / 2 |
| Layer | λ(x,y) < [λ(x,x) +λ(y,y)] / 2 |
| Separate | λ(x,y) = 0 |
| Partial closure | λ(x,y) < λ(x,x) < [λ(x,x) +λ(y, y)] / 2 |
We artificially created a system containing two types of cell with different adhesion factors to test if our model can conform to DAH. The numbers of each type of cell and their locations are initialized randomly. Examples of cell-cell adhesion constants in different patterns are given in Table 2.
Table 2.
Cell-cell adhesion values artificially created
| Differential Adhesion | Expected Pattern |
|---|---|
| λ(x,y) = 6; λ(x,x) = 4; λ(y,y) = 5 | Intermixing |
| λ(x,y) = 6; λ(x,x) = 4; λ(y,y) = 9 | Layer |
| λ(x,y) = 0; λ(x,x) = 4; λ(y,y) = 9 | Separate |
| λ(x,y) = 3; λ(x,x) = 4; λ(y,y) = 9 | Partial closure |
Pattern formation from our model is illustrated in Figure 2. Although the cells were initially randomly distributed spatially (Figure 2(a)), consistent patterns are formed after cell adhesion is modeled (Figure 2(b)-(e)). This study demonstrates the capability of the proposed model in capturing cell adhesion behaviors at the cellular level.
Figure 2.
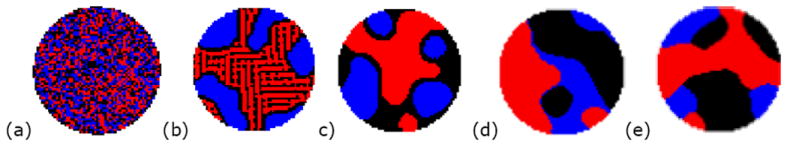
Cellular pattern formation based on differential adhesion hypothesis. Black and red dots represent two types of cell. Blue dots represent the medium. (a) Initial random distribution (b) Intermixing (c) Layer (d) Separate and (e) Partial closure.
3.2 Integrated gene interactions and cell sorting
In this study, we inspect the model to simulate differences between molecular modeling (no cellular modeling) and multi-scale modeling by switching cell motion off first and then on. This study is motivated by stripe pattern formation in a developing fruit fly embryo.
First, cells occupy all sites in the entire place. Hence, genes can interact at all sites, with C(s,t) set to 1 for all s and t. Cell motion is switched off.
Figure 3 is the expression pattern formation over time for a regulator gene (maroon) inhibiting a target gene (blue). By t=50, the target gene sees an increase in its expression in the middle of embryo because the regulator gene is not present in this region. Afterwards, the regulator gene spreads all over the embryo, because of diffusion and transcription. Eventually, the target gene is suppressed but fades away due to degradation.
Figure 3.
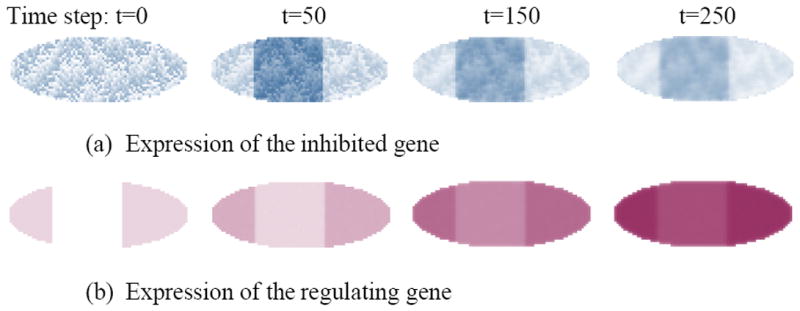
Mimicking stripe pattern development in the fruit fly embryo due to inhibitory gene interactions without cellular information. The following parameters are used in generating the patterns: σ=1, d1= 0.005, d2=0.003, d3=0.001, χ = 0.005, hi = 0, m = -20 (inhibition coefficient). (a) Expression pattern of the inhibited target gene is represented by light blue – the more concentrated the darker. (b) Temporal expression of the regulator gene over time in the embryo is shown in maroon.
Figure 4 shows spatiotemporal progression of pattern formation when cellular constraints prevent proteins from concentrating, in contrast to Figure 3 where cellular information is not considered. The simulation also shows that the stripe pattern is not present anymore. This study demonstrates the challenge of considering both cellular and molecular components in a model.
Figure 4.
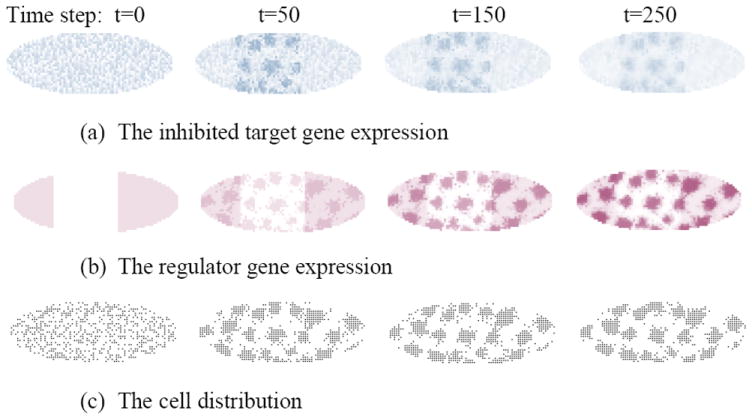
Pattern formation due to both inhibitory gene interaction at the expression level and cell sorting at the cellular level. The following parameters were used in generating the patterns: σ=1, d1=0.005, d2=0.003, d3=0.001, χ=0.005, hi=0, m=-20 (inhibition coefficient).
Now we enable cell motion. To consider also the cellular effect, gene products can only be enhanced at locations where a cell is present. The cell adhesion factor is controlled by a third gene product, which takes part in regulatory interactions by the following coefficients: m31=5, m32=3 and m33 = 0 (no self regulation).
The pattern of the cell distribution shows local engulfment of cells. That is an expected pattern under the differential adhesion hypothesis. However, cell movement also requires other contextual factors than adhesion, such as neighbor density or cell shape. Therefore, adhesion-only models may be insufficient to generate realistic patterns.
3.3 Cell migration in tumor invasion
In this study, we use our model to study malignant tumor invasion, the first phase in metastasis, a process of cancer cell spreading from the primary tumor site to a distant organ. Tumor invasion involves intricate interactions between tumor cells and the host tissue (extracellular matrix – ECM), including altered cell-matrix adhesion and proteolysis (Alexandrova 2008, Bogenrieder and Herlyn 2003).
It is hypothesized that cancer cell invasion to the ECM is due to cell adhesion and the gradients of ECM proteins (haptotaxis). Adjacent to the ECM, cancer cells secret the matrix degrading enzyme (MDE), which makes ECM proteins degrade faster and causes a matrix gradient (Stetler-Stevenson 1993). In order to change cell-matrix adhesion during the cell migration, we made an assumption that ECM adhesiveness is driven by the ECM proteins. As a result, the adhesiveness at ECM areas with proteolysis will be altered, leading to differential adhesiveness. According to DAH, that differential adhesiveness helps cancer cells migrate.
In this adjusted model, we consider ECM a special type of cell. The system then has two cell types: tumor and ECM. Based on the observation of cellular patterns studied in Section 3.1, we contemplated that the intermixing pattern is most likely to give rise to tumor invasion pattern because other patterns tend to form a strict boundary between different cell types. Thus, according to Table 1, the following condition should hold:
| (1) |
This assumption is supported by simulations under various patterning categories. Figure 5 shows the difference between intermixing and layer patterns when the cell-cell and cell-matrix adhesions are static and no molecular influence on the cellular pattern is considered.
Figure 5.
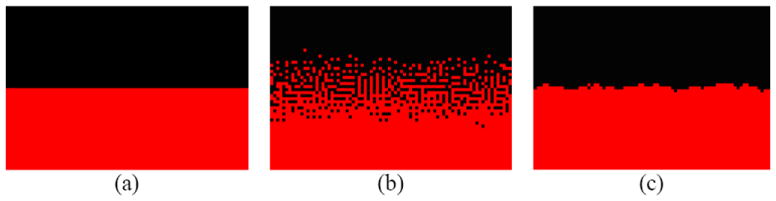
Cellular patterns under fixed-adhesion conditions solely due to DAH between tumor cells and ECM cells. Black dots represent tumor cells. Red ones represent extracellular matrix. (a) Initial configuration, (b) Intermixing patterns, after 250 time steps, and (c) Layer patterns, after 250 time steps.
However, the intermixing pattern is not realistic enough for tumor invasion patterns. There are specific morphological hallmarks of invasion such as finger-like extensions and invasion front (Stetler-Stevenson 1993). By introducing an integrated model to consider molecular interactions in addition to DAH, we can reproduce realistic patterns of tumor invasion.
In the molecular subsystem of the integrated model, we use one protein to represent MDE and another one to represent ECM proteins. The reaction-diffusion equations are rewritten as follows:
where P(s,t,0) is the ECM protein concentration at site s and time t, P(s,t,1) is the MDE concentration at site s and time t, and T(s,t) = 0 for an ECM cell or 1 for a tumor one.
At the cellular level, the initial configuration was set up such that the condition in Eq. (1) holds true. The parameters are given in Table 3. The simulation results are shown in Figure 6. The invasion front can be qualitatively explained by the fact that proteolysis, which occurs at the region around the front (this region is in the diffusion range of MDE secreted from cells at the front), changes the cell-matrix adhesion between the cells in the tumor and the contacting matrix. This alteration breaks the condition for intermixing pattern and falls to the condition for layer or partial closure patterns. As a consequence, the potential migratory cells are held back in the tumor, creating a buffer zone between the tumor and the front.
Table 3.
Parameter setting for adjusted equations
| σ0 | m0 | h0 | D0 | χ0 | n | σ1 | m1 | h1 | D1 | χ1 |
|---|---|---|---|---|---|---|---|---|---|---|
| 1.0 | 1.0 | 0.0 | 0.001 | 0.001 | 1.0 | 1.0 | 1.0 | 0.0 | 0.001 | 0.001 |
Figure 6.
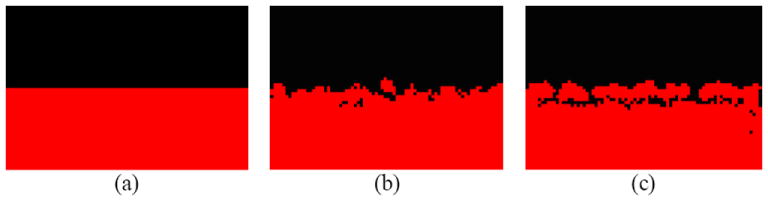
Cellular patterns of tumor invasion. Black dots represent tumor cells. Red ones represent extracellular matrix. (a) Initial configuration (b) Finger-like extensions (in white circles) after 200 time steps, and (c) Invasive front (in white oval) after 450 time steps.
4 Discussion
We have proposed an integrated spatiotemporal model for gene interaction and cell sorting using reaction-diffusion mechanism and based on DAH. We coupled abstraction at molecular and cellular levels, such that gene expression interactions are dependent on cellular spatial information and cell adhesion is dependent on molecular concentrations. We showed that each subsystem of the model is consistent with basic biological understandings, and the integrated model can account for complex spatial pattern formation. More importantly, as both molecular and cellular levels are considered, the model can be applied to a variety of biological processes. We have demonstrated its utility as a basis for spatiotemporal cellular patterns observed in embryonic development and tumor invasion. Particularly, it can be applied in those developmental stages when proteins do not freely diffuse, providing a first step to study the embryo after the blastoderm stage.
However, spatiotemporal data for both gene products and cells are necessary to train this proposed model. This has posed challenges in biological data acquisition, as well as computational modeling. In addition, biological processes other than adhesion also influence cell behavior. It remains an open research challenge to integrate all aspects into the multiscale modeling. Such issues are generally recognized and are being investigated.
Our current and future work develops along the following directions. One future task is to extend the current two-dimensional implementation of the model to three dimensions in space. Another direction is to extend the modeling work in gene networks to incorporate spatial constraints due to the existence of cells. With these efforts and increasingly available spatiotemporal data of gene expression at a localized cellular resolution, it is possible to study diverse cell behavior by spatiotemporal modeling of cellular and molecular mechanisms.
Biographies
Hien Nguyen is a PhD candidate and a graduate assistant in the Department of Computer Science at New Mexico State University. His research interests include computational modeling of pattern formation in developmental biology. Most recently, he has been working on the periodicity of cellular patterning.
Mingzhou Song received his PhD in Electrical Engineering from the University of Washington at Seattle in 2002. He was an Assistant Professor at Queens College of the City University of New York. He is currently an Associate Professor in the Department of Computer Science at New Mexico State University. His research interests include dynamical system modeling, computational biology, and statistical computing.
Contributor Information
Hien Nguyen, Department of Computer Science, New Mexico State University, Las Cruces, NM, USA, hinguyen@cs.nmsu.edu.
Mingzhou Song, Department of Computer Science, New Mexico State University, Las Cruces, NM, USA, joemsong@cs.nmsu.edu.
References
- Agarwal P. Ph D dissertation. Dept of Computer Science, New York University; 1993. Cell-based computer models in developmental biology. [Google Scholar]
- Alexandrova AY. Evolution of cell interactions with extracellular matrix during carcinogenesis. Biochemistry (Moscow) 2008;73(No. 7):733–741. doi: 10.1134/s0006297908070018. [DOI] [PubMed] [Google Scholar]
- Anderson ARA, Chaplain MAJ, Newman EL, Steele RJC, Thompson AM. Mathematical modeling of tumor invasion and metastasis. Journal of Theoretical Medicine. 2000;2:129–151. [Google Scholar]
- Armstrong NJ, Painter KJ, Sherratt JA. A continuum approach to modeling cell-cell adhesion. J Theor Biol. 2006;243(1):98–113. doi: 10.1016/j.jtbi.2006.05.030. [DOI] [PMC free article] [PubMed] [Google Scholar]
- Bogenrieder T, Herlyn M. Axis of evil: molecular mechanisms of cancer metastasis. Oncogene. 2003;22:6524–6536. doi: 10.1038/sj.onc.1206757. [DOI] [PubMed] [Google Scholar]
- Gierer A, Meinhardt H. A theory of biological pattern formation. Kybernetik. 1972;12:30–39. doi: 10.1007/BF00289234. [DOI] [PubMed] [Google Scholar]
- Goel N, et al. Self-sorting of isotropic cells. In: Mostow GD, editor. Mathematical Models for Cell Rearrangement. Yale University Press; 1975. pp. 100–144. [Google Scholar]
- Glazier JA, Balter A, Poplawski NJ. Magnetization to morphogenesis: a brief history of Glazier–Graner–Hogeweg model. In: Anderson AKA, Chaplain MAJ, Rejniak KA, editors. Single-cell-based models in biology and medicine. Birkhäuser Verlag Basel; Switzerland: 2007. pp. 79–106. [Google Scholar]
- Graner F, Glazier JA. Simulation of biological cell sorting using a two-dimensional extended Potts model. Physical Review Letters. 1992;69:2013–2016. doi: 10.1103/PhysRevLett.69.2013. [DOI] [PubMed] [Google Scholar]
- Jaeger J, et al. Dynamic control of positional information in the early Drosophila blastoderm. Nature. 2004;430:368–371. doi: 10.1038/nature02678. [DOI] [PubMed] [Google Scholar]
- Jiang Y, Pjesivac-Grbovic J, Cantrell C, Freyer JP. A multiscale model for avascular tumor growth. Biophysical Journal. 2005;89:3884–3894. doi: 10.1529/biophysj.105.060640. [DOI] [PMC free article] [PubMed] [Google Scholar]
- Kolev M, Zubik-Kowal B. Numerical solutions for a model of tissue invasion and migration of tumour cells. Computational and Mathematical Methods in Medicine. 2011;2011 doi: 10.1155/2011/452320. Article ID 452320. [DOI] [PMC free article] [PubMed] [Google Scholar]
- Li CW, Chen BS. Stochastic spatio-temporal dynamic model for gene/protein interaction network in early Drosophila development. Gene Regulation and Systems Biology. 2009;3:191–210. [PMC free article] [PubMed] [Google Scholar]
- Machesky LM. Lamellipodia and filopodia in metastasis and invasion. FEBS Letters. 2008;582:2102–2111. doi: 10.1016/j.febslet.2008.03.039. [DOI] [PubMed] [Google Scholar]
- Murray JD. Mathematical Biology. Vol. 2. Springer-Verlag; New York, USA: 2004. [Google Scholar]
- Ramis-Conde I, Chaplain MAJ, Anderson ARA. Mathematical modelling of cancer cell invasion of tissue. Math Comput Modell. 2008;47:533–545. [Google Scholar]
- Steinberg MS. On the mechanism of tissue reconstruction by dissociated cells, I. Population kinetics, differential adhesiveness, and the absence of directed migration. Proceedings of the National Academy of Science U S A. 1962a;48:1577–1582. doi: 10.1073/pnas.48.9.1577. [DOI] [PMC free article] [PubMed] [Google Scholar]
- Steinberg MS. On the mechanism of tissue reconstruction by dissociated cells, III. Free energy relations and the reorganization of fused, heteronomic tissue fragments. Proceedings of the National Academy of Science U S A. 1962b;48:1769–1776. doi: 10.1073/pnas.48.10.1769. [DOI] [PMC free article] [PubMed] [Google Scholar]
- Steinberg MS, Takeichi M. Experimental specification of cell sorting, tissue spreading, and specific spatial patterning by quantitative differences in cadherin expression. Proc Natl Acad Sci U S A. 1994;91(1):206–209. doi: 10.1073/pnas.91.1.206. [DOI] [PMC free article] [PubMed] [Google Scholar]
- Stetler-Stevenson WG, Aznavoorian S, Liotta LA. Tumor cell interactions with the extracellular matrix during invasion and metastasis. Annual Review of Cell Biology. 1993;9:541–573. doi: 10.1146/annurev.cb.09.110193.002545. [DOI] [PubMed] [Google Scholar]
- Turing AM. The chemical basis of morphogenesis. Philosophical Transactions of the Royal Society of London Series B, Biological Sciences. 1952;237:37–72. doi: 10.1098/rstb.2014.0218. [DOI] [PMC free article] [PubMed] [Google Scholar]
- Turner S, Sherratt JA. Intercellular adhesion and cancer invasion: a discrete simulation using the extended Potts model. J Theor Biol. 2002;216:85–100. doi: 10.1006/jtbi.2001.2522. [DOI] [PubMed] [Google Scholar]