Abstract
Ulcerative colitis (UC) is an inflammatory bowel disease, and its pathogenesis includes genetic, environmental, and immunological factors, such as T helper cells and their secreted cytokines. T helper cells are classified as Th1, Th2, and Th17 cells. However, it is unclear which T helper cells are important in UC. Dextran sulfate sodium (DSS)-induced colitis is a commonly used model of UC. In this study, we induced DSS colitis in Th1 dominant (T-bet transgenic (Tg)) mice, Th2 dominant (GATA-3 Tg) mice, and Th17 dominant (RORγt Tg) mice to elucidate the roles of T helper cell in DSS colitis. The results showed that GATA-3 Tg mice developed the most severe DSS colitis compared with the other groups. GATA-3 Tg mice showed a significant decreased in weight from day 1 to day 7, and an increased high score for the disease activity index compared with the other groups. Furthermore, GATA-3 Tg mice developed many ulcers in the colon, and many neutrophils and macrophages were detected on day 4 after DSS treatment. Measurement of GATA-3-induced cytokines demonstrated that IL-13 was highly expressed in the colon from DSS-induced GATA-3 Tg mice. In conclusion, GATA-3 overexpression in T-cells and IL-13 might play important roles in the development of DSS colitis.
Keywords: dextran sulfate sodium, GATA-3, IL-13, inflammatory bowel disease, T helper cell
Introduction
Inflammatory bowel disease (IBD) refers to ulcerative colitis (UC) and Crohn’s disease (CD). The pathogenesis of IBD remains unclear, although it is widely accepted that genetic, environmental, and immunological factors are involved [15, 26]. Importantly, T cells and their secreted cytokines are the main effectors in the induction and perpetuation of intestinal inflammation [11]. Until a few years ago, naïve CD4+ cells were thought to differentiate into two cell types, T helper (Th) 1 and Th2 cells. The Th1/Th2 paradigm was therefore used to differentiate the underlying immunological conditions of CD and UC. The dominant paradigm was that CD was characterized by a Th1 mucosal immune response, caused by the action of IL-12, resulting in overproduction of interferon (IFN)-α and IL-2, while UC was thought to be characterized by a Th2 response, with excess production of IL-5 and IL-13 [18, 22]. More recently, a third subset of T helper cells, Th17 cells, have been described. This distinct lineage does not share developmental pathways with either Th1 or Th2 cells [9, 20]. Th17 cells produce IL-17, IL-22, and IL-23. IL-17 expression in the mucosa and its serum levels were increased in active IBD patients [7, 23].
Several models of experimental colitis have been reported that demonstrate various pathophysiological aspects of human IBD [15]. Dextran sulfate sodium (DSS)-induced colitis is a well-established animal model of mucosal inflammation for the study of IBD pathogenesis [19, 21]. DSS colitis is known as a UC model, and many studies have described UC as a Th2 disease [8, 10]. However, several studies demonstrated that DSS colitis is dependent on Th1- or Th17-mediated inflammation [1, 3, 5, 13]. Thus, the roles of T helper cells in DSS colitis are unclear. T-bet, GATA-3, and retinoic acid-related orphan receptor gamma-t (RORγt) are known as Th1 [25], Th2 [30, 31], and Th17 lineage commitment transcription factors [14, 27], respectively. We previously generated Th1 dominant (T-bet transgenic (Tg)) mice [12], Th2 dominant (GATA-3 Tg) mice [29], and Th17 dominant (RORγt Tg) mice [28]. In this study, we used the Th1, Th2, and Th17 dominant mice to elucidate the roles of T helper cells in DSS colitis.
Material and Methods
Animals
T-bet Tg, GATA-3, and RORγt Tg male mice on the C57BL/6J background and their wild-type littermates (13 weeks old) were used. Transgenic mice overexpressing T-bet, GATA-3, or RORγt under the control of the CD2 promoter were generated in our laboratory, as previously described [12, 28, 29]. Mice were fed a normal diet comprised of commercial laboratory chow (MF, Oriental Yeast Co., Ltd., Tokyo, Japan) and were maintained under specific pathogen-free conditions in the Laboratory Animal Resource Center of the University of Tsukuba. All experiments were performed in accordance with the Guide for the Care and Use of Laboratory Animals at the University of Tsukuba, and the study was approved by the Institutional Review Board of the university.
DSS-induced colitis
Experimental colitis was induced by administration of DSS (molecular weight 5,000 daltons; Wako Pure Chemicals Industries (Osaka, Japan)) for 7 days. For the DSS-treated group, mice were orally administered 2.5% DSS in drinking water, and for the control group, mice received tap water. Mice from each group were sacrificed at day 4 or day 7.
Evaluation of DSS colitis
Animals were observed daily, and the disease activity index (DAI) was calculated. The following parameters were used for calculation: (a) weight loss (0 points=none, 1 point=1–5% weight loss, 2 points=5–10% weight loss, 3 points=more than 10% weight loss), (b) stool consistency (0 points=normal, 1 point=soft stools, 2 points=very soft stools, 3 points=watery stools), and (c) the date of start of blood in stool (0 points=no blood in stool, 1 point=day 7, 2 points=day 6 or day 5, 3 points=within day 4). The DAI was calculated as the total score for these parameters: the sum of weight loss, stool consistency, and day of bleeding, with the total DAI score ranging from 0 (unaffected) to 9 (severe colitis).
Histopathological analysis and immunohistochemistry
Colon tissue from each mouse was fixed in 10% formalin in 0.01 M phosphate buffer (pH 7.2) and embedded in paraffin. Sections (3 µm) were stained with hematoxylin and eosin (H&E) for histopathological examination by light microscopy. We used a rabbit anti-mouse myeloperoxidase (MPO) polyclonal antibody (Thermo Scientific, Cheshire, UK) for staining of MPO-positive neutrophils, and a rat anti-mouse macrophage (F4/80) antibody (Cederlane, Burlington, ON, Canada). MPO staining and F4/80 staining were performed using Histofine Simple Stain MAX PO (rabbit) and Histofine Simple Stain MAX PO (rat) (Nichirei, Tokyo, Japan), respectively. For fluorescence staining, we used a goat anti-mouse IL-13 (R&D Systems, Minneapolis, MN, USA) and Alexa Fluor 546 donkey anti-goat IgG antibodies (Invitrogen Corporation, Camarillo, CA, USA). For histological analysis, the numbers of ulcers and infiltrating cell counts were measured using a BIOREVO BZ-9000 fluorescence microscope (Keyence, Osaka, Japan).
Real time RT-PCR analysis
Total RNA was prepared from the colon of control mice or DSS-treated mice using an RNeasy Mini Kit (Qiagen GmbH, Hilden, Germany). First-strand cDNA was synthesized using a QuantiTect Rev. Transcription Kit (Qiagen GmbH) or SuperScript III First-Strand Synthesis System (Invitrogen). IL-4, IL-5, IL-10, and IL-13 mRNA levels were determined by real-time RT-PCR using a Thermal Cycler Dice Real Time System (TaKaRa Bio Inc., Otsu, Shiga, Japan) with SYBR Green PCR Master Mix (TaKaRa Bio Inc.). This procedure enabled the initial mRNA content of the cells to be standardized relative to the amount of hypoxanthine phosphoribosyltransferase (HPRT) mRNA. The following specific primers were used for PCR: 5′-GGTCTCAACCCCCAGCTAGT-3′, forward, and 5′- GCC GAT GAT CTC TCT CAAGTGAT-3′, reverse, for IL-4; 5′- CTCTGTTGAC AAGCAATGAGACG-3′, forward, and 5′-TCTTCAGTATGTCTAGCCCCTG-3′, reverse, for IL-5; 5′- GCTCTTACTGACTGGCATGAG-3′, forward, and 5′- CGCAGCTCTAGGAGCATGTG-3′, reverse, for IL-10; 5′-CCTGGCTCTTGCTTGCCTT-3′, forward, and 5′-GGTCTTGTGTGATGTTGCTCA-3′, reverse, for IL-13; and 5′-TTGTTGTTGGATATGCCCTTGACTA-3′, forward, and 5′-AGGCAGATGGCCACAGGACTA-3′, reverse, for HPRT.
Statistical analysis
All data are expressed as means ± SEM. Multiple data comparisons were performed by using one-way analysis of variance (ANOVA). Significant differences between the groups of mice were analyzed using a Student’s t-test for paired samples. P values<0.05 were considered statistically significant.
Results
GATA-3 Tg mice developed severe colitis after DSS administration
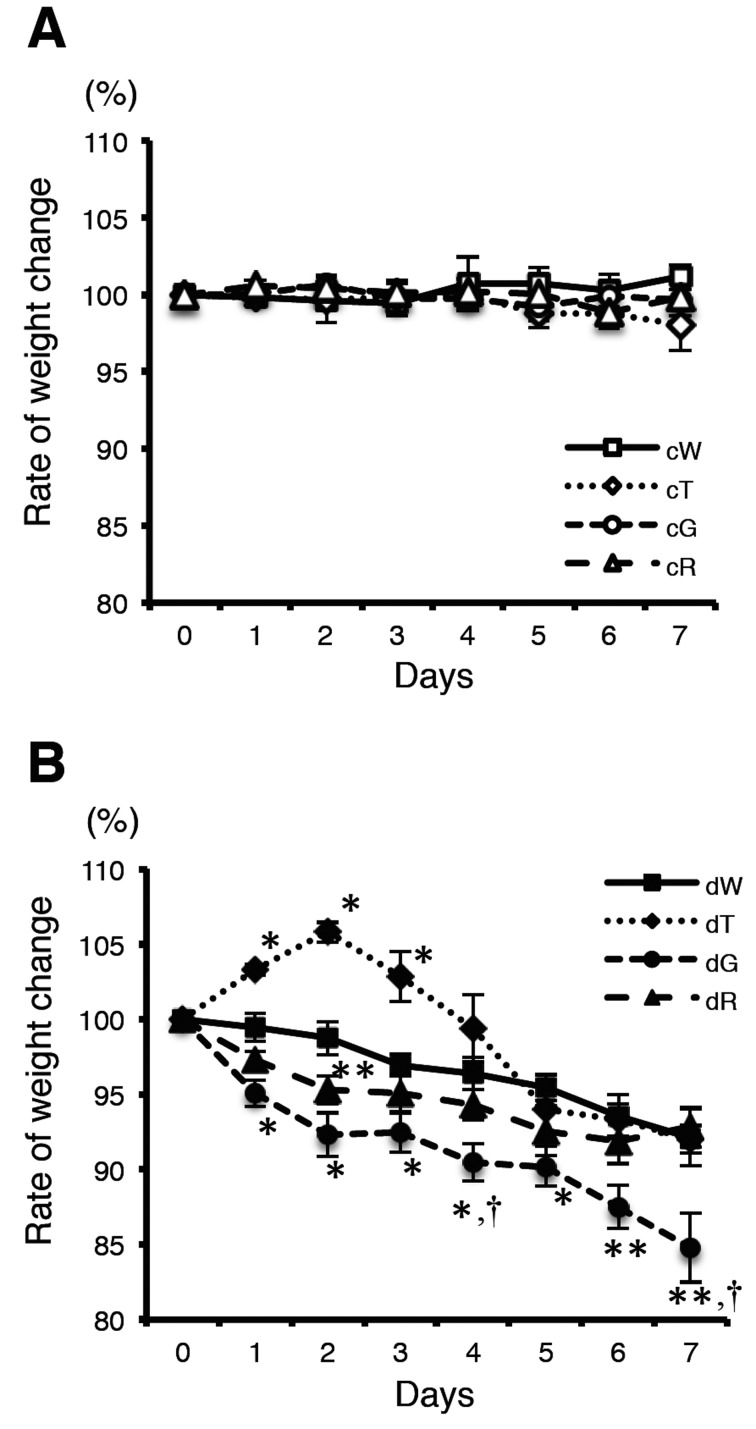
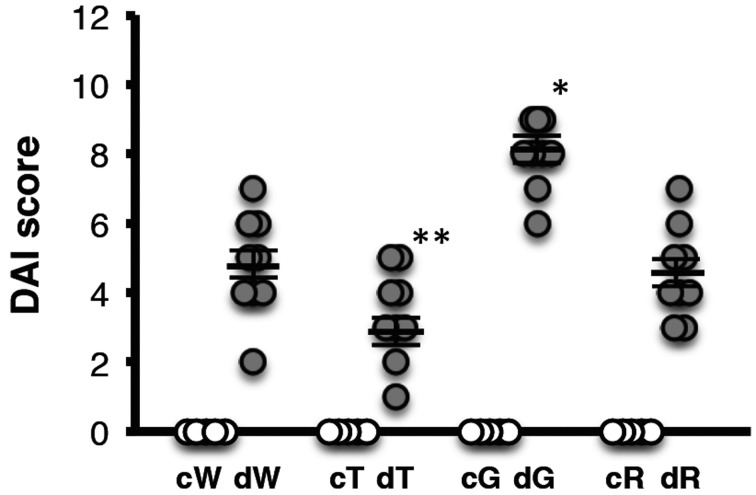
There was no significant difference in the food intake between mice treated with or without DSS. Body weight was compared with the pretreatment DSS body weight (Fig. 1). There were no significant changes in control mice (Fig. 1A). In the DSS treatment groups, the body weight loss ratio in GATA-3 Tg mice was significantly more severe than that of wild-type mice from day 1 to day 7 (Fig. 1B). On day 7, the mean body weight of GATA-3 Tg mice decreased to 84.8 ± 2.3% compared with the pretreatment body weight and was significantly lower than those of the other groups (wild-type mice, 92.1 ± 1.9%; T-bet Tg mice, 92.0 ± 0.9%; RORγt Tg mice, 92.8 ± 1.4%). Next, we measured the DAI based on the body weight loss, stool consistency, and the day blood was first present in stool. DAI was quantified based on the scoring system described in Material and Methods. DAI was markedly higher in DSS-treated GATA-3 Tg mice compared with the other groups (Fig. 2). The mean DAI scores of the DSS-treated wild-type, T-bet Tg, GATA-3 Tg, and RORγt Tg mice were 4.8 ± 0.5, 3.3 ± 0.4, 8.1 ± 0.4, and 4.6 ± 0.4, respectively. These results indicated that GATA-3 Tg mice developed severe colitis after DSS administration compared with the other groups.
Fig. 1.
Body weight changes of control mice (A) and DSS-treated mice (B). Body weights were measured daily. Mean body weights (% of pretreatment body weight) are shown. c, control. d, DSS treated. W, wild-type mice. T, T-bet Tg mice. G, GATA-3 Tg mice. R, RORγt Tg mice. Data represent means ± SEM (*P<0.01, vs. wild-type mice; **P<0.05, vs. wild-type mice; †P<0.05, vs. T-bet Tg and RORγt Tg mice) (n: cW=7, cT=5, cG=5, cR=7, dW=7, dT=7, dG=7, dR=7).
Fig. 2.
DAI scores of control and DSS-treated mice. DAI was quantified based on the scoring system described in Material and Methods. c, control. d, DSS treated. W, wild-type mice. T, T-bet Tg mice. G, GATA-3 Tg mice. R, RORγt Tg mice. Data represent means ± SEM (*P<0.01 vs. dW, dT, and dR; **P<0.01 vs. dW and P<0.05 vs. dR) (n: cW=5, cT=5, cG=5, cR=5, dW=9, dT=9, dG=9, dR=9).
GATA-3 Tg mice developed severe colitis in the early stages after DSS administration
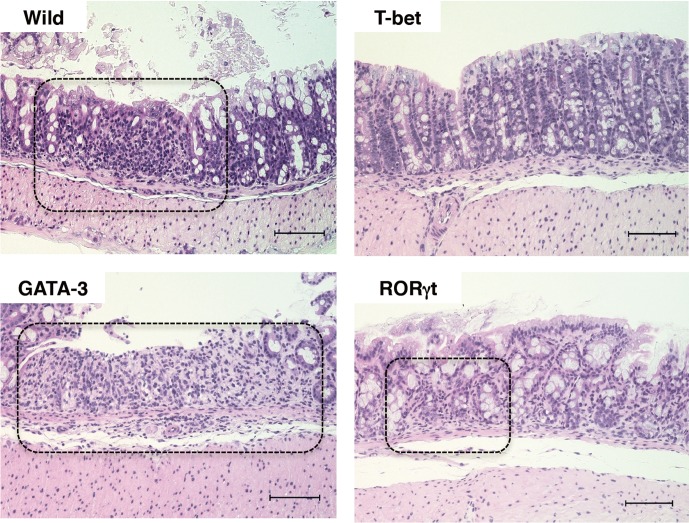
Analysis of body weight changes demonstrated that the rate of weight change of GATA-3 Tg mice was more severe than for other mice from day 1 and continued to increase until day 7. On day 4, the weight change rate of GATA-3 Tg mice was significantly more severe than those of wild-type, T-bet Tg, and RORγt Tg mice (Fig. 1B). This result suggested that colitis induced by DSS in GATA-3 mice developed earlier than in other mice. Therefore, we further studied the mice on day 4. Histological findings for the colon tissues in DSS-treated wild-type mice, GATA-3 Tg, and RORγt Tg mice showed obvious manifestations of inflammatory colitis, including ulcers and infiltration of cells. Indeed, there was a prominent infiltration of cells in GATA-3 Tg mice (Fig. 3). However, T-bet mice did not develop sever ulcers. Quantification of the ulcerated area demonstrated that ulceration occurred most frequently in the colon of DSS-treated GATA-3 Tg mice (Supplementary Fig. 1). These results indicated that the severe histological signs had already occurred in DSS-treated GATA-3 Tg mice on day 4.
Fig. 3.
Microscopic appearance of intestinal tissues on day 4 of DSS treatment. Microscopic views of H&E-stained colons are shown (magnification ×200, scale bar 100µm). The dot-lines indicate that infiltration of cells (wild mice, GATA-3Tg mice, and RORγt Tg mice) and ulcer sites (wild mice and GATA-3Tg mice).
Prominent infiltration of neutrophils and macrophages in the colon of DSS-treated GATA-3 Tg mice
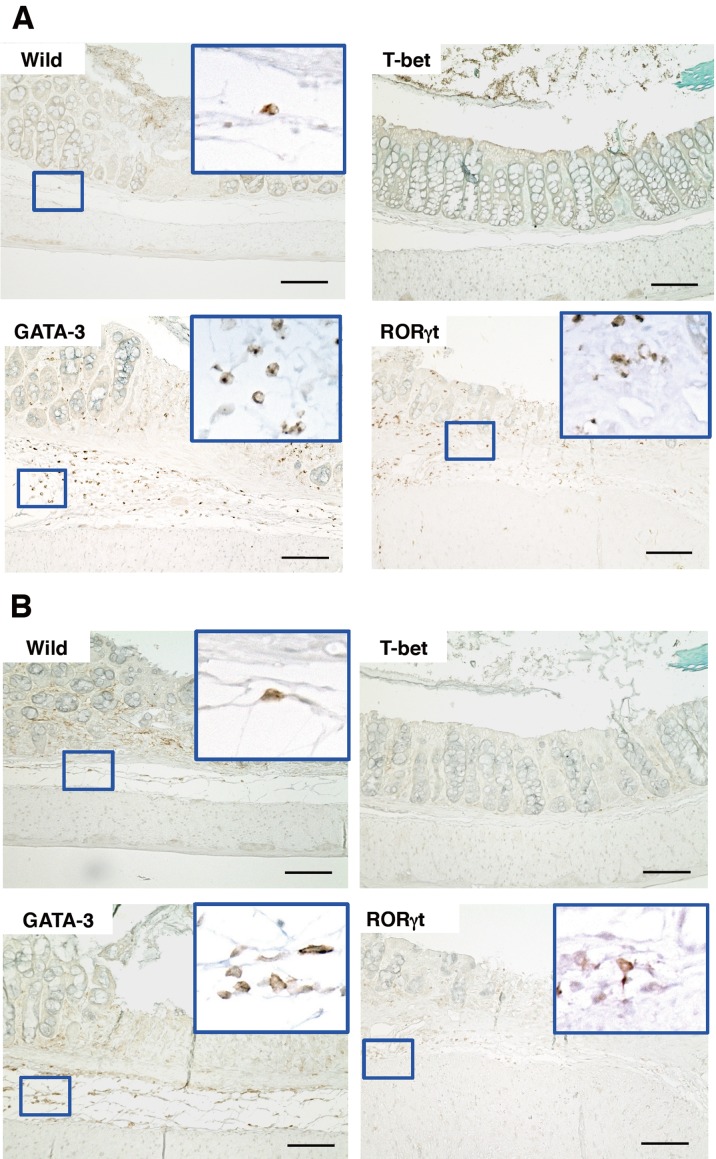
Because neutrophils and macrophages cause inflammation, we measured these cell types. Immunohistochemical analysis demonstrated the infiltration of MPO-positive neutrophils in the colon of DSS-treated GATA-3 Tg mice, wild-type mice, and RORγt Tg mice (Fig. 4A) (Supplementary Fig. 2). Furthermore, staining of macrophages revealed infiltration in DSS-treated GATA-3 Tg mice and wild-type mice (Fig. 4B) (Supplementary Fig. 3). From the MPO- and F4/80-positive cell count analyses, the most prominent infiltration of neutrophils and macrophages was observed in DSS-treated GATA-3 Tg mice (Supplementary Fig. 2 and Supplementary Fig. 3). On the other hand, both neutrophils and macrophages were not significantly increased in DSS-treated T-bet Tg mice. These results indicated that on experimental day 4, severe pathology had occurred locally in the colon of DSS-treated GATA-3 Tg mice.
Fig. 4.
Microscopic appearance and immunohistochemical staining of intestinal tissues on day 4 of DSS treatment. Microscopic views of MPO-positive cells (A) and macrophages (B) are shown (magnification ×200, scale bar 100 µm).
IL-13 contributed to the development of DSS-induced colitis in GATA-3 Tg mice
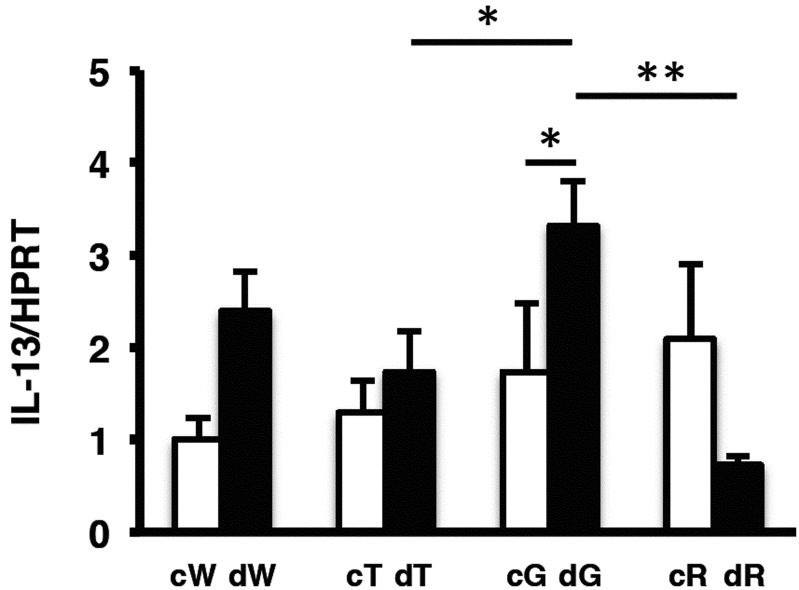
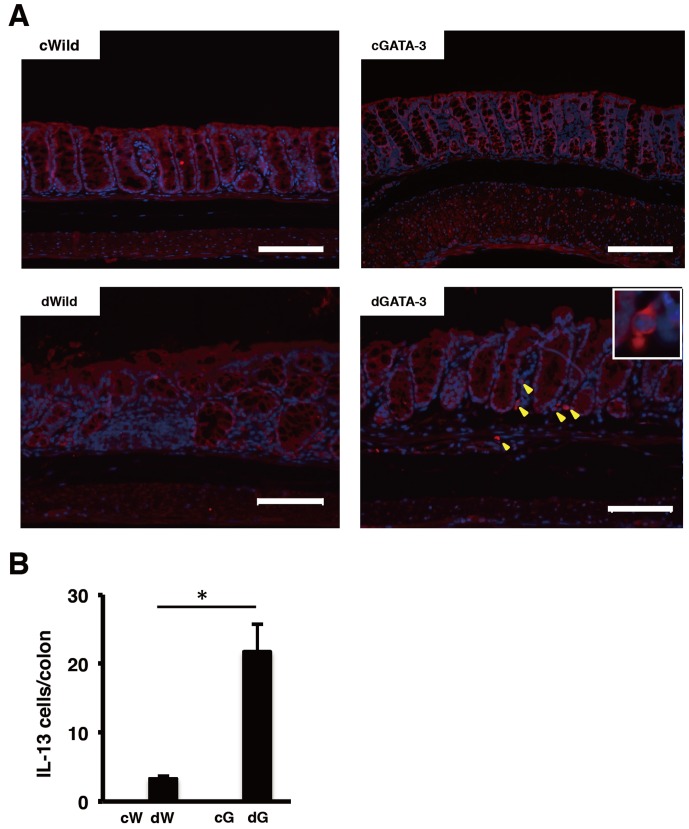
Because GATA-3 Tg mice developed severe DSS-induced colitis, we analyzed Th2-specific cytokines from colon tissue by measuring mRNA levels of IL-4, IL-5, IL-10, and IL-13 by real-time RT-PCR on day 4 of DSS treatment. However, we could not detect differences clearly for IL-4, IL-5, and IL-10 between GATA-3 Tg mice and other groups (data not shown). RT-PCR analysis revealed that IL-13 expression in GATA-3 Tg mice was higher than for other groups, and was significantly higher than in T-bet Tg and RORγt Tg mice (Fig. 5). Next we analyzed IL-13 expression in the colon by fluorescence staining on day 4 of DSS treatment. Many IL-13-positive cells were detected in the ulcer field of DSS-treated GATA-3 Tg mice (Fig. 6).
Fig. 5.
Real-time RT-PCR analysis of IL-13 in the colon on day 4 of DSS treatment. c, control. d, DSS treated. W, wild-type mice. T, T-bet Tg mice. G, GATA-3 Tg mice. R, RORγt Tg mice (*P<0.05; **P<0.01) (n: cW=6, cT=6, cG=4, cR=4, dW=4, dT=4, dG=5, dR=4).
Fig. 6.
Immunofluorescence staining of intestinal tissues on day 4 of DSS treatment. IL-13-positive cells (A) and IL-13-positive cells in the colon (B) are shown (magnification ×200, scale bar 100 µm). c, control. d, DSS treated. W, wild-type mice. G, GATA-3 Tg mice (*P<0.01) (n: cW=4, cG=3, dW=3, dG=4).
Discussion
Th1, Th2, and Th17 cells have been reported to play important roles in DSS colitis [1, 3, 5, 13, 16, 17]. In particular, Th1 and Th17 cells are important in acute DSS colitis. In this study, the overexpression of GATA-3 in T cells accelerated DSS-induced acute colitis, but not the overexpression of T-bet or RORγt, which are Th1 and Th17 lineage commitment transcription factors. GATA-3 is proposed to be predominantly responsible for late Th2 cellular differentiation [30, 31]. Th2 cells are characterized by the production of IL-4, IL-5, and IL-13 [6]. These cytokines might play important roles in the pathogenesis of DSS colitis. However, IL-13, but not IL-4 and IL-5, was detected in DSS colitis. IL-13, a Th2 cytokine, was reported to be the key effector molecule in UC [10]. Heller et al. studied lamina propria mononuclear cells (LPMCs), isolated from surgical specimens of patients undergoing colectomy. They showed that LPMCs from patients with UC produced significantly greater amounts of IL-13 compared with controls (patients with CD). They concluded that IL-13 was an important effector cytokine in UC that impairs epithelial barrier function by affecting epithelial apoptosis, tight junctions, and restitution velocity.
Furthermore, Fuss et al. reported that UC was associated with an atypical Th2 response mediated by natural killer T (NKT) cells producing IL-13 and having cytotoxic potential for epithelial cells [8, 24]. Glycolipids from epithelial cells, bacteria, or both induce the upregulation of IL-13 receptor α2 (IL-13 Rα2) on mucosal NKT cells. Autocrine IL-13 activates these cells, which expand in number and create a positive feedback loop that enhances IL-13–mediated NKT cell cytotoxicity, causing epithelial-barrier dysfunction [4].
In this study, we used T-bet, GATA-3, and RORγt Tg mice. These mice were generated with the VA vector, which contained the upstream gene regulatory region and locus control region of the human CD2 gene [32]. The VA vector has been reported to direct expression of the inserted cDNA in all single-positive mature T lymphocytes of Tg mice [32]. Therefore, IL-13 might also be produced by NKT cells in GATA-3 Tg mice. We tried to study IL-13 production in NKT cells in GATA-3 Tg mice. However, we could not clearly detect overexpression of IL-13 in NKT cells from DSS-induced mice (data not shown). In this study, we did not evaluate long-term DSS treatment of GATA-3 Tg mice. It is not clear how IL-13 acts in chronic DSS colitis. In the chronic phase of DSS colitis, increased expression of Th2 cytokines, IL-4 and IL-10, was previously reported [1]. Further studies are needed to clarify the effect of IL-13 on the persistence of DSS colitis and the development of chronic DSS colitis.
Many factors are important in the acute phase and chronic phase of DSS colitis [1,2,3, 5, 13]. Recent studies demonstrated that DSS colitis is dependent on Th17-mediated inflammation [1, 13]. Ito et al. reported that DSS-induced IL-17 KO mice developed colitis, but had better mortality rates than DSS induced in wild-type mice. These results suggest that IL-17 is important for the development of DSS colitis, but that it can be induced in the absence of IL-17. Thus, several factors interact with each other to develop DSS colitis. In our study, Th17 dominant mice, RORγt Tg mice, did not develop a severe form of DSS colitis. Transgenic mice overexpressing RORγt under the control of the CD2 promoter induced a Th17-dominant background that might affect other cells or cytokines expression, which contributes to the development of DSS colitis. Further studies to define the interaction of IL-17 with other factors may clarify the mechanisms responsible for the development of DSS colitis.
In conclusion, we observed that GATA-3 Tg mice developed more severe colitis than T-bet and RORγt Tg mice and that increased levels of IL-13 in GATA-3 Tg mice resulted in the development of DSS colitis. These results suggested that GATA-3 overexpression in T-cells and IL-13 might play important roles in the development of DSS colitis.
Supplementary
Acknowledgments
This work was supported by JSPS KAKENHI Grant-in-Aid for Challenging Exploratory Research Number 24650228 and KAKENHI Grant-in-Aid for Scientific Research (C) Number 25461240.
References
- 1.Alex P., Zachos N.C., Nguyen T., Gonzales L., Chen T.E., Conklin L.S., Centola M., Li X.2009. Distinct cytokine patterns identified from multiplex profiles of murine DSS and TNBS-induced colitis. Inflamm. Bowel Dis. 15: 341–352. doi: 10.1002/ibd.20753 [DOI] [PMC free article] [PubMed] [Google Scholar]
- 2.Bento A.F., Leite D.F., Marcon R., Claudino R.F., Dutra R.C., Cola M., Martini A.C., Calixto J.B.2012. Evaluation of chemical mediators and cellular response during acute and chronic gut inflammatory response induced by dextran sodium sulfate in mice. Biochem. Pharmacol. 84: 1459–1469. doi: 10.1016/j.bcp.2012.09.007 [DOI] [PubMed] [Google Scholar]
- 3.Brown J.B., Cheresh P., Zhang Z., Ryu H., Managlia E., Barrett T.A.2012. P-selectin glycoprotein ligand-1 is needed for sequential recruitment of T-helper 1 (Th1) and local generation of Th17 T cells in dextran sodium sulfate (DSS) colitis. Inflamm. Bowel Dis. 18: 323–332. doi: 10.1002/ibd.21779 [DOI] [PMC free article] [PubMed] [Google Scholar]
- 4.Danese S., Fiocchi C.2011. Ulcerative colitis. N. Engl. J. Med. 365: 1713–1725. doi: 10.1056/NEJMra1102942 [DOI] [PubMed] [Google Scholar]
- 5.Egger B., Bajaj-Elliott M., MacDonald T.T., Inglin R., Eysselein V.E., Buchler M.W.2000. Characterisation of acute murine dextran sodium sulphate colitis: cytokine profile and dose dependency. Digestion 62: 240–248. doi: 10.1159/000007822 [DOI] [PubMed] [Google Scholar]
- 6.Farrar J.D., Asnagli H., Murphy K.M.2002. T helper subset development: roles of instruction, selection, and transcription. J. Clin. Invest. 109: 431–435. [DOI] [PMC free article] [PubMed] [Google Scholar]
- 7.Fujino S., Andoh A., Bamba S., Ogawa A., Hata K., Araki Y., Bamba T., Fujiyama Y.2003. Increased expression of interleukin 17 in inflammatory bowel disease. Gut 52: 65–70. doi: 10.1136/gut.52.1.65 [DOI] [PMC free article] [PubMed] [Google Scholar]
- 8.Fuss I.J., Heller F., Boirivant M., Leon F., Yoshida M., Fichtner-Feigl S., Yang Z., Exley M., Kitani A., Blumberg R.S., Mannon P., Strober W.2004. Nonclassical CD1d-restricted NK T cells that produce IL-13 characterize an atypical Th2 response in ulcerative colitis. J. Clin. Invest. 113: 1490–1497. [DOI] [PMC free article] [PubMed] [Google Scholar]
- 9.Harrington L.E., Hatton R.D., Mangan P.R., Turner H., Murphy T.L., Murphy K.M., Weaver C.T.2005. Interleukin 17-producing CD4+ effector T cells develop via a lineage distinct from the T helper type 1 and 2 lineages. Nat. Immunol. 6: 1123–1132. doi: 10.1038/ni1254 [DOI] [PubMed] [Google Scholar]
- 10.Heller F., Florian P., Bojarski C., Richter J., Christ M., Hillenbrand B., Mankertz J., Gitter A.H., Burgel N., Fromm M., Zeitz M., Fuss I., Strober W., Schulzke J.D.2005. Interleukin-13 is the key effector Th2 cytokine in ulcerative colitis that affects epithelial tight junctions, apoptosis, and cell restitution. Gastroenterology 129: 550–564. [DOI] [PubMed] [Google Scholar]
- 11.Hundorfean G., Neurath M.F., Mudter J.2012. Functional relevance of T helper 17 (Th17) cells and the IL-17 cytokine family in inflammatory bowel disease. Inflamm. Bowel Dis. 18: 180–186. doi: 10.1002/ibd.21677 [DOI] [PubMed] [Google Scholar]
- 12.Ishizaki K., Yamada A., Yoh K., Nakano T., Shimohata H., Maeda A., Fujioka Y., Morito N., Kawachi Y., Shibuya K., Otsuka F., Shibuya A., Takahashi S.2007. Th1 and type 1 cytotoxic T cells dominate responses in T-bet overexpression transgenic mice that develop contact dermatitis. J. Immunol. 178: 605–612. [DOI] [PubMed] [Google Scholar]
- 13.Ito R., Kita M., Shin-Ya M., Kishida T., Urano A., Takada R., Sakagami J., Imanishi J., Iwakura Y., Okanoue T., Yoshikawa T., Kataoka K., Mazda O.2008. Involvement of IL-17A in the pathogenesis of DSS-induced colitis in mice. Biochem. Biophys. Res. Commun. 377: 12–16. doi: 10.1016/j.bbrc.2008.09.019 [DOI] [PubMed] [Google Scholar]
- 14.Ivanov I.I., McKenzie B.S., Zhou L., Tadokoro C.E., Lepelley A., Lafaille J.J., Cua D.J., Littman D.R.2006. The orphan nuclear receptor RORgammat directs the differentiation program of proinflammatory IL-17+ T helper cells. Cell 126: 1121–1133. doi: 10.1016/j.cell.2006.07.035 [DOI] [PubMed] [Google Scholar]
- 15.Kawada M., Arihiro A., Mizoguchi E.2007. Insights from advances in research of chemically induced experimental models of human inflammatory bowel disease. World J. Gastroenterol. 13: 5581–5593. [DOI] [PMC free article] [PubMed] [Google Scholar]
- 16.Kim T.W., Park H.J., Choi E.Y., Jung K.C.2006. Overexpression of CIITA in T cells aggravates Th2-mediated colitis in mice. J. Korean Med. Sci. 21: 877–882. doi: 10.3346/jkms.2006.21.5.877 [DOI] [PMC free article] [PubMed] [Google Scholar]
- 17.Lim B.O.2004. Efficacy of wogonin in the production of immunoglobulins and cytokines by mesenteric lymph node lymphocytes in mouse colitis induced with dextran sulfate sodium. Biosci. Biotechnol. Biochem. 68: 2505–2511. doi: 10.1271/bbb.68.2505 [DOI] [PubMed] [Google Scholar]
- 18.Neurath M.F., Finotto S., Glimcher L.H.2002. The role of Th1/Th2 polarization in mucosal immunity. Nat. Med. 8: 567–573. doi: 10.1038/nm0602-567 [DOI] [PubMed] [Google Scholar]
- 19.Okayasu I., Hatakeyama S., Yamada M., Ohkusa T., Inagaki Y., Nakaya R.1990. A novel method in the induction of reliable experimental acute and chronic ulcerative colitis in mice. Gastroenterology 98: 694–702. [DOI] [PubMed] [Google Scholar]
- 20.Park H., Li Z., Yang X.O., Chang S.H., Nurieva R., Wang Y.H., Wang Y., Hood L., Zhu Z., Tian Q., Dong C.2005. A distinct lineage of CD4 T cells regulates tissue inflammation by producing interleukin 17. Nat. Immunol. 6: 1133–1141. doi: 10.1038/ni1261 [DOI] [PMC free article] [PubMed] [Google Scholar]
- 21.Perse M., Cerar A.2012. Dextran sodium sulphate colitis mouse model: traps and tricks. J. Biomed. Biotechnol. 2012: 718617. doi: 10.1155/2012/718617 [DOI] [PMC free article] [PubMed] [Google Scholar]
- 22.Podolsky D.K.2002. Inflammatory bowel disease. N. Engl. J. Med. 347: 417–429. doi: 10.1056/NEJMra020831 [DOI] [PubMed] [Google Scholar]
- 23.Sanada Y., Mizushima T., Kai Y., Nishimura J., Hagiya H., Kurata H., Mizuno H., Uejima E., Ito T.2011. Therapeutic effects of novel sphingosine-1-phosphate receptor agonist W-061 in murine DSS colitis. PLoS ONE 6: e23933. doi: 10.1371/journal.pone.0023933 [DOI] [PMC free article] [PubMed] [Google Scholar]
- 24.Strober W., Fuss I.J.2011. Proinflammatory cytokines in the pathogenesis of inflammatory bowel diseases. Gastroenterology 140: 1756–1767. doi: 10.1053/j.gastro.2011.02.016 [DOI] [PMC free article] [PubMed] [Google Scholar]
- 25.Szabo S.J., Kim S.T., Costa G.L., Zhang X., Fathman C.G., Glimcher L.H.2000. A novel transcription factor, T-bet, directs Th1 lineage commitment. Cell 100: 655–669. doi: 10.1016/S0092-8674(00)80702-3 [DOI] [PubMed] [Google Scholar]
- 26.Vatn M.H.2009. Natural history and complications of IBD. Curr. Gastroenterol. Rep. 11: 481–487. doi: 10.1007/s11894-009-0073-8 [DOI] [PubMed] [Google Scholar]
- 27.Wilson N.J., Boniface K., Chan J.R., McKenzie B.S., Blumenschein W.M., Mattson J.D., Basham B., Smith K., Chen T., Morel F., Lecron J.C., Kastelein R.A., Cua D.J., McClanahan T.K., Bowman E.P., de Waal Malefyt R.2007. Development, cytokine profile and function of human interleukin 17-producing helper T cells. Nat. Immunol. 8: 950–957. doi: 10.1038/ni1497 [DOI] [PubMed] [Google Scholar]
- 28.Yoh K., Morito N., Ojima M., Shibuya K., Yamashita Y., Morishima Y., Ishii Y., Kusakabe M., Nishikii H., Fujita A., Matsunaga E., Okamura M., Hamada M., Suto A., Nakajima H., Shibuya A., Yamagata K., Takahashi S.2012. Overexpression of RORgammat under control of the CD2 promoter induces polyclonal plasmacytosis and autoantibody production in transgenic mice. Eur. J. Immunol. 42: 1999–2009. doi: 10.1002/eji.201142250 [DOI] [PubMed] [Google Scholar]
- 29.Yoh K., Shibuya K., Morito N., Nakano T., Ishizaki K., Shimohata H., Nose M., Izui S., Shibuya A., Koyama A., Engel J.D., Yamamoto M., Takahashi S.2003. Transgenic overexpression of GATA-3 in T lymphocytes improves autoimmune glomerulonephritis in mice with a BXSB/MpJ-Yaa genetic background. J. Am. Soc Nephrol. 14: 2494–2502. doi: 10.1097/01.ASN.0000086473.23379.25 [DOI] [PubMed] [Google Scholar]
- 30.Zhang D.H., Cohn L., Ray P., Bottomly K., Ray A.1997. Transcription factor GATA-3 is differentially expressed in murine Th1 and Th2 cells and controls Th2-specific expression of the interleukin-5 gene. J. Biol. Chem. 272: 21597–21603. doi: 10.1074/jbc.272.34.21597 [DOI] [PubMed] [Google Scholar]
- 31.Zheng W., Flavell R.A.1997. The transcription factor GATA-3 is necessary and sufficient for Th2 cytokine gene expression in CD4 T cells. Cell 89: 587–596. doi: 10.1016/S0092-8674(00)80240-8 [DOI] [PubMed] [Google Scholar]
- 32.Zhumabekov T., Corbella P., Tolaini M., Kioussis D.1995. Improved version of a human CD2 minigene based vector for T cell-specific expression in transgenic mice. J. Immunol. Methods 185: 133–140. doi: 10.1016/0022-1759(95)00124-S [DOI] [PubMed] [Google Scholar]
Associated Data
This section collects any data citations, data availability statements, or supplementary materials included in this article.


