Abstract
Impulsivity is often characterized by rapid decisions under risk, but most current tests of decision-making do not impose time pressures on participants’ choices. Here we introduce a new Traffic Lights test which requires people to choose whether to programme a risky, early eye movement before a traffic light turns green (earning them high rewards or a penalty) or wait for the green light before responding to obtain a small reward instead. Young participants demonstrated bimodal responses: an early, high-risk and a later, low-risk set of choices. By contrast, elderly people invariably waited for the green light and showed little risk-taking. Performance could be modelled as a race between two rise-to-threshold decision processes, one triggered by the green light and the other initiated before it. The test provides a useful measure of rapid decision-making under risk, with the potential to reveal how this process alters with aging or in patient groups.
INTRODUCTION
The study of decision-making has become the focus of intense research efforts in cognitive neuroscience. However, it is appreciated that there might be limitations associated with existing naturalistic tasks used to identify abnormal decision-making (Schonberg et al., 2011). For example, delay discounting (Bickel et al., 1999) or gambling tasks (Bechara et al., 1998; Clark et al., 2008; Murphy et al., 2009) have been extraordinarily useful in identifying departures from normal behaviour. But they might encourage probabilistic fallacies or may not permit behaviour to be dissected easily into its contributory cognitive components (Aragues et al., 2011; Schonberg et al., 2011). They also allow participants to reflect upon the decision and consider possible outcomes, without any time pressure.
By contrast, impulsive behaviour in pathological groups is often characterized by rapid decision-making under risk (Moeller et al., 2001). Impulsivity may be conceptualised as a willingness to decide before all the required information is available and some existing tests probe this in patient groups, albeit for decisions made in the order of many seconds rather than milliseconds (e.g., Clark et al., 2006). But even in healthy humans, under certain circumstances, early decisions can carry a survival advantage, e.g., when deciding quickly might be life-saving even if associated with a risk of making the wrong choice. Such an ability to make rapid decisions and negotiate risk early might be termed functionally-useful anticipation (cf. Dickman, 1990). However, in other scenarios a ‘wait and see’ approach is better, particularly if early decisions repeatedly lead to poor outcomes.
Here we present a new method that provides a measure of decision-making under time pressure. Our task encouraged functionally-useful anticipation but also punished erroneous decisions that were made too early. We used fast eye movements – saccades – as our response measure. The saccadic system has begun to provide a useful framework for studying decision-making in humans as well as monkeys (Glimcher, 2003; Hutton, 2008), and is sensitive to cognitive deficits in patient groups (e.g., Hodgson et al., 2007). Saccades are well described by linear rise-to-threshold models of ‘evidence accrual’ in the lead up to the response being triggered, i.e., the decision (Carpenter and Williams, 1995b).
In our new traffic lights task, individuals make saccadic decisions under time pressure. Risk is introduced by varying the GO onset time so it is not predictable. The rules encourage participants to make functional anticipatory responses by disproportionately rewarding fast decisions that lead to saccades soon after the GO signal. Thus anticipating GO is encouraged. However, saccades executed too soon, prior to GO, are punished. Ideal performance incorporates fast reaction times based upon an anticipatory strategy. But individuals perform badly if they are too early or, conversely, if they are too slow.
METHODS
Traffic Lights Task
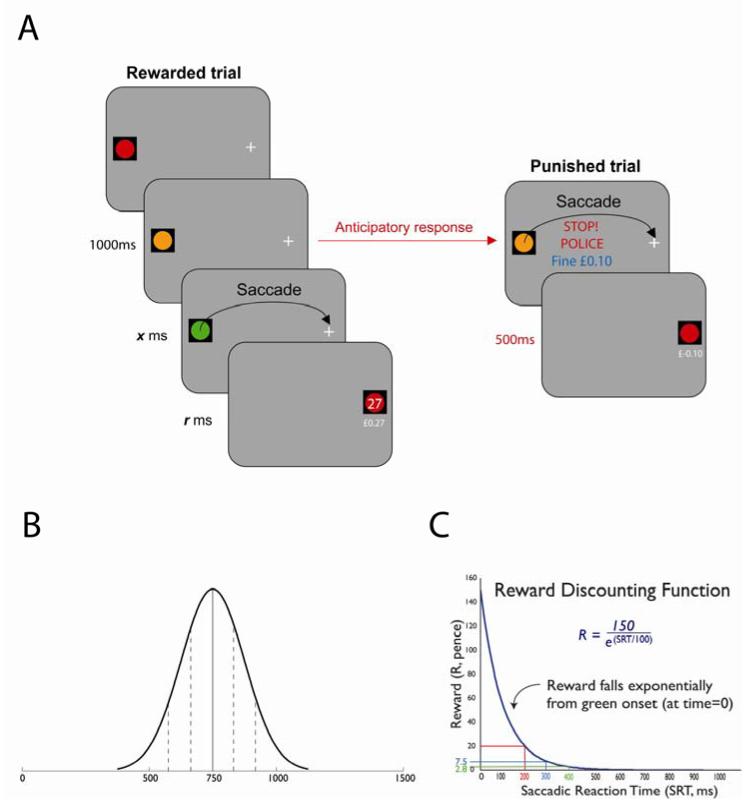
Young subjects consisted of 45 healthy volunteers (mean age = 20; 22 females); older participants comprised 15 healthy volunteers (mean age = 64; 9 female). Participants were told that their main aim was to win as much money as possible. They were asked to make rapid eye movements from a ‘traffic light’ (coloured disc, diameter 3°) to a target cross (3° × 3°), both presented on a computer monitor. The traffic light and target were 10° either side of screen center (Fig. 1). Subjects were requested to fixate the traffic light stimulus while it turned from red (duration 100 ms) through amber to green.
Figure 1.
The Traffic Light Task
A Subjects were instructed to move their eyes as quickly as possible from a traffic light stimulus to a target cross. Saccades made after the green light were rewarded but those executed before the green light incurred a small penalty. B Amber duration was randomly selected on each trial from a normal distribution (mean 750ms, SD 125ms). C Reward was computed by a steep discounting function of saccadic reaction time. The biggest reward was for saccades that coincided with green light onset, but such saccades would have to been programmed before the green light.
The timing of the GO signal (green light) onset was not predictable: it varied from trial to trial, with the duration of the amber light randomly selected from a normal distribution (mean 750 ms, SD 125 ms; Fig 1B). Participants were asked to make their 20° saccade to the target cross as quickly as possible and as soon after the GO signal as possible. They had a maximum of 1000 ms in which to respond.
The reward (R) for a successful saccade was calculated by an exponentially decaying discounting function in the form:
Where A = 150, τ = 100 and t represents the reaction time from green onset (t0) in milliseconds.
This steep discounting function (Fig. 1C) generated disproportionately high rewards for short saccadic reaction times (SRTs). Saccades with latencies of 400 ms after green light onset were rewarded with only 2.8 pence, while SRT = 200 ms generated 20.3p. Saccades with shorter latencies than this were far more highly rewarded, e.g., a response with SRT = 50 ms led to a reward of 91.0p. But to make high rewards, subjects would have to anticipate green light onset because saccades typically take ~200 ms to programme (C T White et al., 1962). In other words, they would have to make a decision – take a risk – to programme a saccade before the onset of the GO signal.
However, saccades that were actually made before the green light incurred a small, fixed penalty of 10p. Error trials were accompanied by an unpleasant audible beep and a visual warning, ‘STOP POLICE! Fine £0.10.’. Subjects received a payment equivalent to their mean reward for 50 trials; overall they completed 10 blocks of 50 trials. To perform well, participants therefore needed to make as many rewarded anticipations as possible, while keeping errors to a minimum. They had to make a choice of whether to stay (wait longer) or go and risk a small penalty for the possibility of a large reward.
On gaze arriving at the target cross (fixation tolerance 2°), subjects received both aural and visual feedback on their performance. They were shown the reward (in pence), and a running total beneath (in pounds). For rewards of less than 20p, participants heard a ‘ping’. For rewards of 20p or more, they heard a more rewarding ‘kerching!’ sound. The target cross was then replaced by a red light (circle) and a target cross now appeared on the opposite side of the screen to begin the next trial. To perform optimally, subjects should therefore make as many anticipations as possible, but as few errors as possible.
Apparatus and Data Acquisition
An EyeLink 1000 infra-red video-based eye tracker (SR Research Ltd, Ontario, Canada) recorded eye position at 1000 Hz. Task stimuli were displayed on a 22” CRT monitor (1024×768 pixels, refresh rate 150 Hz) at 60cm.. Stimuli were programmed in C/C++ and run on a PC. The eye tracker was controlled by a separate PC networked to the stimulus/display PC. Eye position data were acquired in real time and exported into Matlab R2008a (The Mathworks, Massachusetts, USA) for analysis.
Control saccadic reaction time (SRT) task
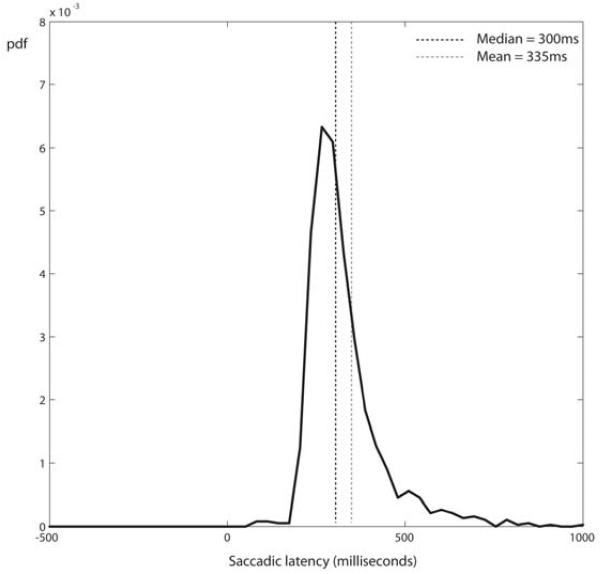
Young participants were also tested on a control, non-rewarded saccadic reaction time (SRT) task (Figure 2). In this paradigm, the red light was followed immediately by green, with no amber light in between. Red light duration was chosen at random from a uniform distribution in the range500-1000 ms (mean 750 ms). This task allowed us to obtain response distributions for purely ‘reactive’ saccades – programmed in response to green onset, without anticipation of the GO signal.
Figure 2.
Control saccadic reaction time (SRT) task response distribution for young controls. Participants showed a typical, positively skewed, “recinormal” distribution of saccadic latencies. pdf = probability distribution function.
RESULTS
Saccadic distributions in young controls
Typical saccadic reaction time tasks produce latency distributions with a single ‘quasi-normal’ distribution which is positively skewed. Since the skew can be removed by re-plotting on a reciprocal time axis, the distribution is given the name ‘recinormal’ (Carpenter and Williams, 1995a). Performance on the control SRT task produced such a distribution (Fig. 2) with a mean reaction time of 335 ms (SD 148 ms) and median of 300ms for young volunteers.
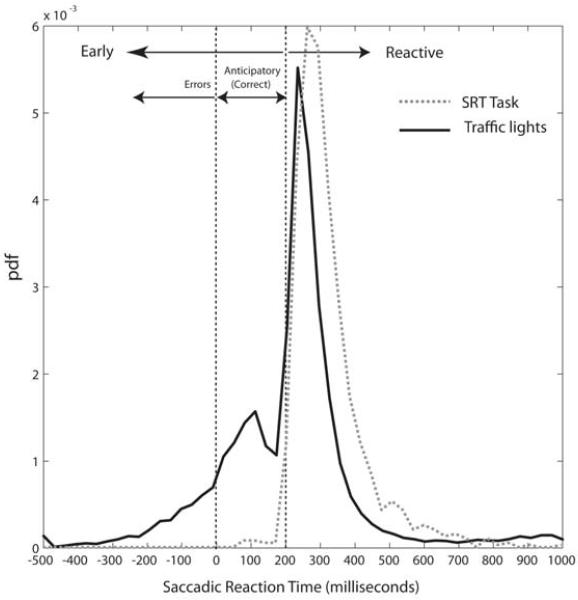
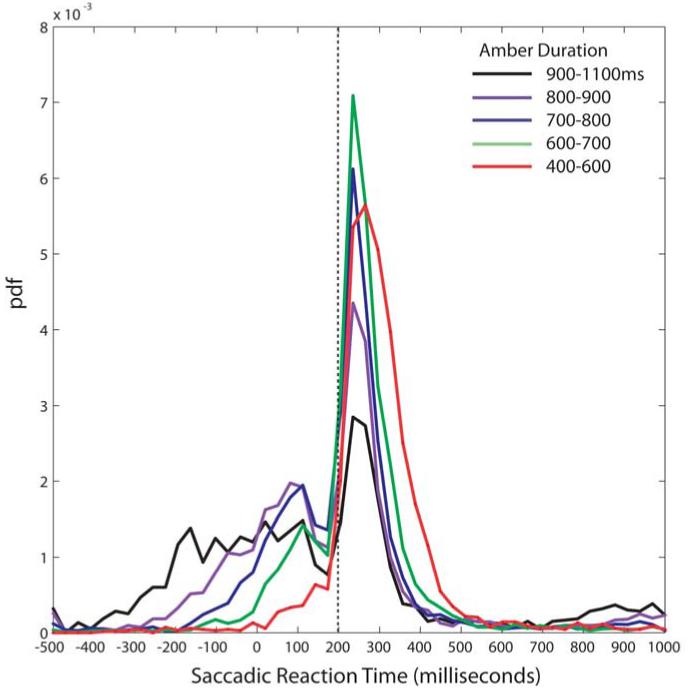
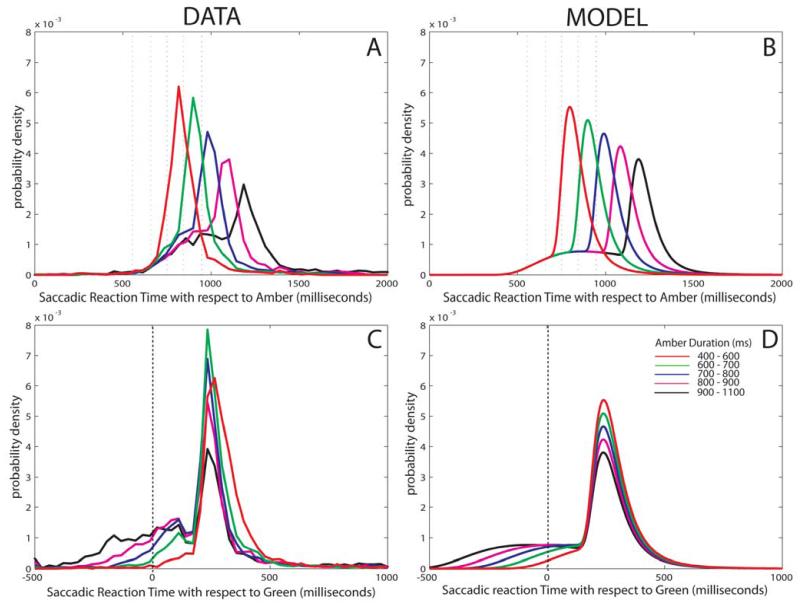
On the traffic light task, however, the overall distribution plotted with respect to green onset was bimodal (Fig. 3), consisting of two distinct distributions: a ‘late’ distribution which corresponded well to the distribution of saccades on the SRT task (cf. Fig. 2) and an ‘early’ distribution of saccades. Plotting saccadic distributions as a function of amber duration revealed that as amber duration increased, the frequency of early saccades increased, while that of late saccades reduced (Fig. 4). The peak latency of the later distribution remained essentially invariant across amber durations.
Figure 3.
Traffic Light Task response distributions for young controls.
A bimodal distribution was apparent consisting of a population ‘early’ (anticipatory) saccades and ‘late’ (reactive) saccades. The latter were of similar latency to those seen in the SRT task. pdf = probability distribution function.
Figure 4.
Saccadic response distributions varied with amber duration
Displaying the probability density function (pdf) according to the amber duration in each trial reveals two important features of the task response First, the longer the amber duration, the more likely is an early, anticipatory saccade. Second, the latency of the reactive distribution is appears constant for all amber durations. Zero refers to green light onset.
Given that saccades take ~200 ms to programme and execute (C T White et al., 1962), the early population of saccades might be considered anticipatory in nature, while the later population might be considered reactive – responses triggered by the onset of the green light. However, for any given saccade it is not possible definitively to determine whether it arose from the early or late population of responses. We therefore modelled our data to enable us to choose an appropriate ‘cut-off’ time for counting the number of ‘anticipatory’ responses.
Linear rise-to-threshold model predicts likelihood of saccades arising from reactive and anticipatory distributions
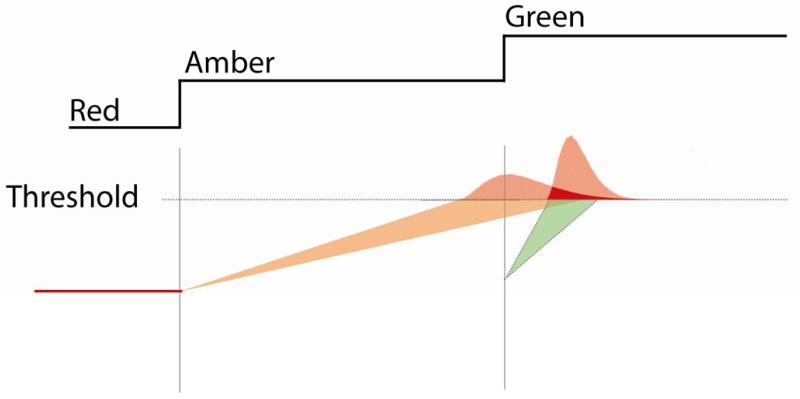
The positively skewed, ‘recinormal’ distribution of saccades has been well modelled by Carpenter’s LATER model (Carpenter and Williams, 1995a). Moreover, in tasks in which the saccade target might be anticipated distributions have been modelled by two LATER units competing in a ‘two horse race’ (Story and Carpenter, 2008). Such models assume that a decision threshold must be reached to initiate a saccade (Figure 5). Reaching that threshold depends upon the accumulation of evidence in favour of making the decision. In the traffic lights task, as time passes following amber onset, there is increasing expectation of the green light. This form of evidence is accrued slowly. Once the green light comes on, however, there is 100% evidence, and the GO signal therefore would be expected to lead to rapid accumulation of evidence in favour of generating a saccade.
Figure 5.
How two LATER Units might describe the observed data.
It is assumed that a certain decision threshold must be reached to initiate a saccade. This threshold may be reached through two forms of ‘evidence’. As time passes following the amber onset, there is increasing expectation of the green light. This form of evidence is accrued slowly. Once the green light is lit, there is 100% evidence of the requirement for a saccade, so a faster decision process is initiated. Depending upon the amber duration and prior knowledge of the amber duration distribution, one process will win the race on any given trial. As these are biological systems, there is also noise (variability) in the rate of rise of each process. This results in a recinormal distribution of saccadic latencies even in the presence of identical trial conditions.
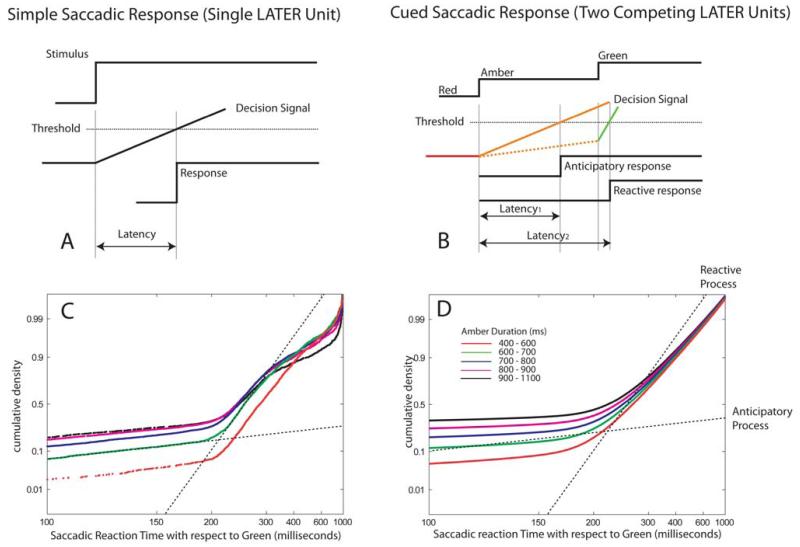
To model the data from the traffic light task, we assumed two processes, one triggered by the amber light and the other by the green light. The distribution of reactive saccades would be described by a rapid rise-to-threshold process that is evoked by the appearance of the green light. We further hypothesised that anticipatory saccades, driven by an increasing expectation of the GO signal, would be described by a separate, slower and independent rise-to-threshold triggered by the amber light onset. Thus we have two rise-to-threshold processes competing to reach decision threshold and, according to this model, a saccade is generated by whichever process is first to reach threshold (Figs. 5 and 6).
Figure 6.
Young volunteer data modeled as two linear rise-to-threshold processes.
(A) Linear rise-to-threshold models predict simple saccadic response distributions. (B) We used a model which incorporates two LATER units to estimate means and variances for both reactive and anticipatory response distributions. In this case, saccadic latency depends upon the slope of each linear rising process (and the variability of the slope of each process from trial to trial). For short amber durations, the reactive process, which is steep, will usually reach threshold first (denoted by green line). For longer amber durations, however, the anticipatory process (amber line) triggered by amber onset may reach threshold before the reactive process does. In this example an error occurred because the amber-triggered process reached threshold before green onset. (C) Plotting responses on reciprobit axes demonstrates the existence of the two linear rise-to-threshold processes, one starting at amber onset (anticipatory), the other in response to green onset (reactive). (D) The gradients and variabilities of these processes were estimated using maximum likelihood estimation and used to parameterize two separate LATER units to model the distributions.
The likelihood of the first, slow-rising anticipatory process reaching the threshold increases as amber duration lengthens. For very short amber durations, therefore, there is not sufficient time for an anticipatory saccade to be generated, and the green light triggers a rapidly rising reactive process which reaches threshold first. Nearly all the saccades for short amber durations would therefore arise from the reactive distribution. By contrast, in trials with long amber durations many anticipatory saccades occur because there is sufficient time for the anticipatory process to reach threshold before the reactive process is triggered.
Formally, the probability that a saccade has occurred by time t following amber onset (i.e. the cumulative probability distribution) is given by:
Where ΨA and ΨR indicate cumulative recinormal distributions describing anticipatory and reactive processes, respectively. Each distribution is parameterized by a mean (μ) and variance (σ2) of the rate-of-rise, and defined in terms of the standard cumulative normal distribution Φ as follows, for t > 0:
Anticipations, Rewards and Errors
We used maximum likelihood estimation (Myung, 2003) to obtain best-fitting mean and variance parameters for each distribution (Fig. 6). The model used four parameters: the mean and variance of the rate of the rise-to-threshold process triggered by the amber onset and similarly the mean and variance of the rate-of-rise of the process triggered by the GO signal. Maximum likelihood parameter estimates were obtained using the Nelder-Mead simplex method (fminsearch in MATLAB).
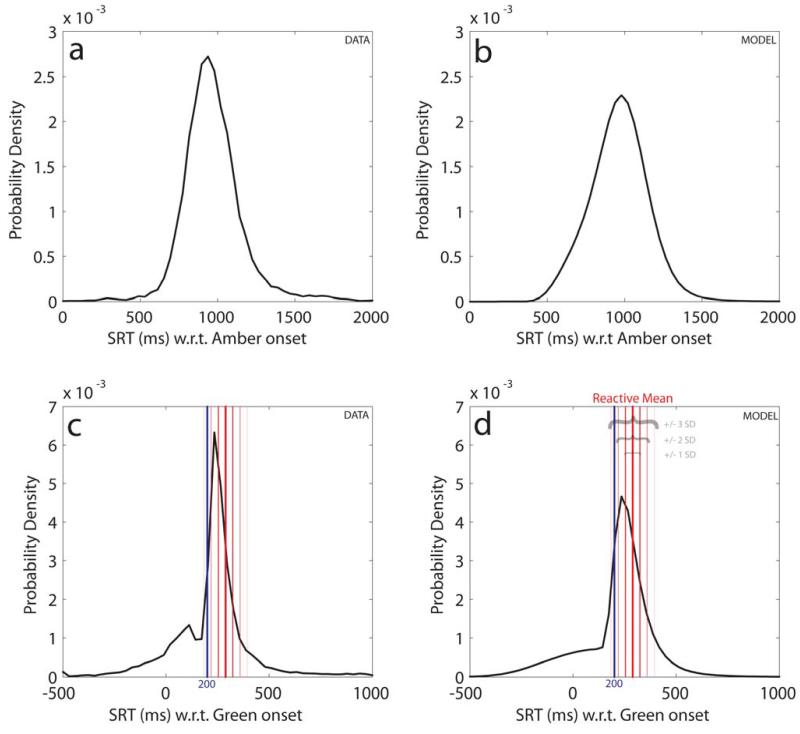
Population data for all saccades are shown in the left panels of Fig. 7, with corresponding distributions produced by the model on the right. The data are further decomposed into distributions for different amber durations in Fig. 8, with real data on the left and model performance using four parameters to the right. Note that if the distributions are plotted with respect to amber onset, one might get the impression there was only one distribution. However, plotting all the data with respect to green onset or decomposing the results as a function of amber duration (even when plotted with respect to amber onset) reveals the bimodal distribution.
Figure 7.
Saccadic response distributions and model distributions.
Raw data (left panels) and modelled probability distributions (right panels) derived from four parameters (gradient and variance for two rise-to-threshold processes) estimated by maximum likelihood estimation. Plotted with respect to amber onset (a & b), there is a single homogeneous distribution of saccades. However, plotted with respect to the green light onset, the true bimodal distribution is revealed (c & d).
Figure 8.
Saccade distributions as a function of amber duration: data and model findings.
Using maximum likelihood estimation to estimate means and standard deviations for two recinormal distributions, the data (A & C) is well modeled (B & D). Note how the anticipatory component increases with amber duration.
In the case of young subjects, the model estimated a group-average median response time for the reactive distribution of 289 ms (SD 32 ms) from green onset. We decided to use a cut-off of less than 200 ms SRT to classify saccades as being from the anticipatory distribution. This value corresponds to ~2.5 SDs from the reactive distribution mean, and for the group the model estimates that 91% of saccades >200 ms from green onset would be from the reactive distribution, while 82% of saccades prior to 200 ms would be from the anticipatory distribution. (If we use a cut-off of 185 ms the corresponding values would both be 90%, but for pragmatic purposes and ease of use in future studies we have kept to 200 ms as differences between these cut-offs makes little material difference to the overall pattern of findings discussed below).
When modelled individually, 200 ms was a minimum of two standard deviations below the median reactive response time for each young subject. The group-average median response time for the anticipatory distribution, now computed from amber onset, was 1344 ms (SD 52 ms). Using the 200 ms cut-off, a total of 30.2% of young volunteers’ saccades were computed using this model to be from the anticipatory process. Just over two-thirds of these saccades occurred between green onset and 200 ms following it, comprising 21.1% (SD 11.1) of all saccades. Thus these saccades were highly rewarded.
Overall reward correlated highly with the percentage of anticipatory responses (R2 = 0.42, P < 0.05). A weaker but still strongly significant negative correlation between overall mean reaction time and reward was also found (R2 = 0.30, P < 0.05). Percentage errors were not significantly correlated with overall reward (R2 = 0.041, P=0.18) but recall that errors were all penalised by a small, flat loss of 10 p, regardless of how early they were made with respect to the GO signal onset. Overall, young volunteers made on average 17p per trial (min 7p, max 28p, SD 4.5p).
Saccadic distributions in older controls
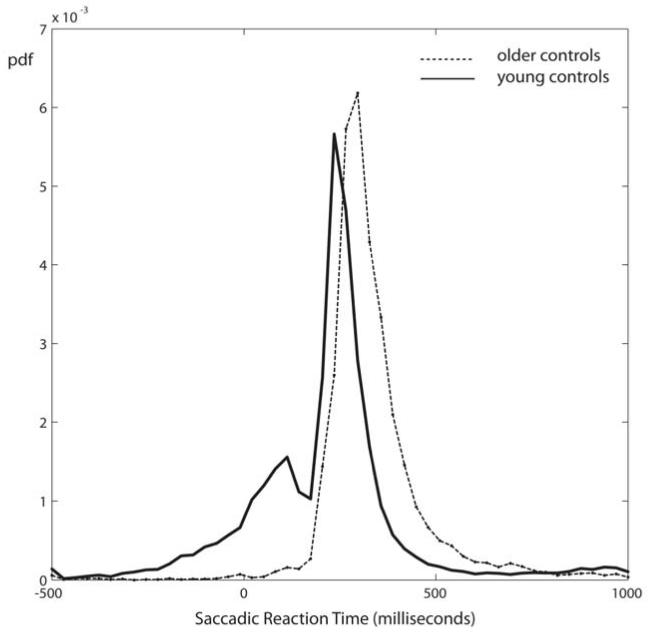
In contrast to the younger test subjects, older participants did not produce very many anticipatory responses (Fig. 9). The saccade response distribution for this group did not show a bimodal distribution when plotted with respect to green onset. Instead the shape of the overall distribution for older subjects was very similar to the reactive part of the younger subject distribution. Indeed, if we consider only responses of young controls made after 200ms (the ‘reactive’ distribution), then the mean RT (319 ms, SD 73 ms) was almost identical to the older volunteers (mean 320ms, SD 80ms).
Figure 9.
Traffic Light Task saccadic distributions in older volunteers
Older controls showed little or no anticipation despite a similar reactive distribution latency to young controls. The distribution more closely resembles that generated by young controls in the SRT task. Data for young controls on the traffic lights task is shown here by the dashed line.
Due to the lack of an anticipatory saccade distribution in older participants, overall they earned less reward on the task. They made considerably less reward per trial than the young group, with a mean of 10p per trial (min 4p, max 20p, SD 4.1). The correlation between the number of anticipations and reward was not significant (R2 = 0.19, P > 0.05), unlike in younger participants. However, reward correlated inversely with mean latency (R2 = 0.50, P < 0.05). Similarly to the younger group, errors did not correlate significantly with reward (R2 = 0.002, P > 0.05).
DISCUSSION
We have developed a simple saccadic task that can measure decision-making when participants are required to make rapid choices (stay or go) under risk. The task generated two groups of responses in young, healthy volunteers: a reactive distribution and an anticipatory distribution. The two distributions can be modelled by separately-parameterised linear rise-to-threshold decision processes. The earlier process is triggered by the amber light and rises slowly to decision threshold. In trials with shorter amber durations, the GO signal triggers the fast-rising reactive process which reaches threshold before the anticipatory process can trigger a saccade. By contrast, trials of longer amber duration allow the anticipatory process to rise to threshold and generate a saccade before the green light onset. There are therefore increasing numbers of anticipatory responses with increasing amber durations. Note that neither monetary reward nor auditory feedback is necessary to observe the behaviour we present here; we have found that similar results arise if feedback is given simply as points, using the same exponentially decaying reward function.
Task performance, measured as reward obtained, correlated strongly with the percentage of anticipatory, correct responses (i.e., 0-200 ms after the GO signal). These are programmed before green onset because it takes ~200 ms to execute a saccade (C T White et al., 1962). Thus participants had to take a decision about whether to stay and wait, or make a response before the green light, risking the possibility of a small penalty against a potentially large reward. Young adults therefore made what might be called functionally-useful anticipations. They were willing to take a risk and make early responses because overall this would optimize overall reward. However, in older subjects, we found little evidence of anticipatory behaviour,
Elderly participants seemed to adopt a more cautious approach, deciding not to make very many risky decisions, perhaps because they were less motivated by the potential rewards and/or more sensitive to the penalty of going too early. Changes in the brain with aging are known to alter patterns of decision-making (Brown and Ridderinkhof, 2009), perhaps related to differential sensitivity to rewards versus losses (Samanez-Larkin et al., 2007). Our paradigm might be sensitive enough to detect such changes, but we need to interpret the results presented here with caution as our sample was small. The same applies for the finding that reactive response latencies in the elderly appeared to be similar to that of young people. One possible implication of this finding for psychomotor slowing with age is that the latter might in fact be due to reduction of premature responding.
The task presented here might also be useful in studying decision-making in clinical populations, particularly those who appear to be susceptible to impulsive choices. Pathological impulsivity has been characterized as rapid decision-making under risk (Moeller et al., 2001). On this paradigm, one might expect many erroneous, early responses would be characteristic of such behaviour. Of course, there are many existing measures used to index impulsive decision-making (Aragues et al., 2011; Schonberg et al., 2011) but few, if any, examine risky choices under tight time constraints. Paradigms such as the STOP signal task have been employed to assess how rapidly participants cancel an ongoing motor plan. But although the STOP task measures the ability to exert inhibitory control it does not involve a choice to take a risky decision, unlike the traffic lights paradigm.
One important aspect of our new paradigm is that performance can be modelled using an existing framework that has been used to understand the control of saccadic eye movements: the linear rise-to-threshold (Carpenter and Williams, 1995a). A similar conceptual framework has also been used to model performance on the STOP task, but this time with a race between excitatory activity triggered by the early GO cue and inhibitory or braking activity evoked by the later STOP signal. Such a ‘two-horse race’ also serves as the basis for our modelling, but with the rise-to-threshold of activity (or accumulation of evidence) evoked by the amber or green light both leading to the same result: execution of a response.
Story and Carpenter have used dual LATER units to predict saccadic reaction times in various oculomotor tasks, but their focus was on modelling expectation from fixation offset and response following target onset (Story et al., 2008). The traffic lights task puts participants in a very different context where they have to decide whether to take a risk to initiate a response in the absence of a GO signal. Embedded within an existing behavioural and physiological framework, it has the potential to be applied in many different circumstances to assess rapid decision-making under risk in health and disease.
Acknowledgements
We thank our participants and Angela Yu for help with data collection. This study was supported by The Wellcome Trust and the NIHR/CBRC at UCLH/UCL.
REFERENCES
- Aragues M, Jurado R, Quinto R, Rubio G. Laboratory Paradigms of Impulsivity and Alcohol Dependence: A Review. Eur Addict Res. 2011;17:64–71. doi: 10.1159/000321345. [DOI] [PubMed] [Google Scholar]
- Bechara A, Damasio H, Tranel D, Anderson SW. Dissociation Of Working Memory from Decision Making within the Human Prefrontal Cortex. J. Neurosci. 1998;18:428–437. doi: 10.1523/JNEUROSCI.18-01-00428.1998. [DOI] [PMC free article] [PubMed] [Google Scholar]
- Bickel WK, Odum AL, Madden GJ. Impulsivity and cigarette smoking: delay discounting in current, never, and ex-smokers. Psychopharmacology. 1999;146:447–454. doi: 10.1007/pl00005490. [DOI] [PubMed] [Google Scholar]
- Brown SBRE, Ridderinkhof KR. Aging and the neuroeconomics of decision making: A review. Cognitive, Affective, & Behavioral Neuroscience. 2009;9:365–379. doi: 10.3758/CABN.9.4.365. [DOI] [PubMed] [Google Scholar]
- White CT, Eason RG, Bartlett NR. Latency and duration of eye movements in the horizontal plane. J Opt Soc Am. 1962;52:210–213. doi: 10.1364/josa.52.000210. [DOI] [PubMed] [Google Scholar]
- Carpenter RH, Williams ML. Neural computation of log likelihood in control of saccadic eye movements. Nature. 1995a;377:59–62. doi: 10.1038/377059a0. [DOI] [PubMed] [Google Scholar]
- Carpenter RHS, Williams MLL. Neural computation of log likelihood in control of saccadic eye movements. Nature. 1995b;377:59–62. doi: 10.1038/377059a0. [DOI] [PubMed] [Google Scholar]
- Clark L, Bechara A, Damasio H, Aitken MRF, Sahakian BJ, Robbins TW. Differential effects of insular and ventromedial prefrontal cortex lesions on risky decision-making. Brain. 2008;131:1311–1322. doi: 10.1093/brain/awn066. [DOI] [PMC free article] [PubMed] [Google Scholar]
- Clark L, Robbins TW, Ersche KD, Sahakian BJ. Reflection impulsivity in current and former substance users. Biol. Psychiatry. 2006;60:515–522. doi: 10.1016/j.biopsych.2005.11.007. [DOI] [PubMed] [Google Scholar]
- Dickman SJ. Functional and dysfunctional impulsivity: personality and cognitive correlates. J Pers Soc Psychol. 1990;58:95–102. doi: 10.1037//0022-3514.58.1.95. [DOI] [PubMed] [Google Scholar]
- Glimcher PW. The neurobiology of visual-saccadic decision making. Annu. Rev. Neurosci. 2003;26:133–179. doi: 10.1146/annurev.neuro.26.010302.081134. [DOI] [PubMed] [Google Scholar]
- Hodgson T, Chamberlain M, Parris B, James M, Gutowski N, Husain M, Kennard C. The role of the ventrolateral frontal cortex in inhibitory oculomotor control. Brain. 2007;130:1525–1537. doi: 10.1093/brain/awm064. [DOI] [PubMed] [Google Scholar]
- Hutton SB. Cognitive control of saccadic eye movements. Brain Cogn. 2008;68:327–340. doi: 10.1016/j.bandc.2008.08.021. [DOI] [PubMed] [Google Scholar]
- Moeller FG, Barratt ES, Dougherty DM, Schmitz JM, Swann AC. Psychiatric aspects of impulsivity. Am J Psychiatry. 2001;158:1783–1793. doi: 10.1176/appi.ajp.158.11.1783. [DOI] [PubMed] [Google Scholar]
- Murphy SE, Longhitano C, Ayres RE, Cowen PJ, Harmer CJ, Rogers RD. The role of serotonin in nonnormative risky choice: the effects of tryptophan supplements on the “reflection effect” in healthy adult volunteers. J Cogn Neurosci. 2009;21:1709–1719. doi: 10.1162/jocn.2009.21122. [DOI] [PubMed] [Google Scholar]
- Myung IJ. Tutorial on maximum likelihood estimation. Journal of Mathematical Psychology. 2003;47:90–100. [Google Scholar]
- Samanez-Larkin GR, Gibbs SEB, Khanna K, Nielsen L, Carstensen LL, Knutson B. Anticipation of monetary gain but not loss in healthy older adults. Nat. Neurosci. 2007;10:787–791. doi: 10.1038/nn1894. [DOI] [PMC free article] [PubMed] [Google Scholar]
- Schonberg T, Fox CR, Poldrack RA. Mind the gap: bridging economic and naturalistic risk-taking with cognitive neuroscience. Trends Cogn. Sci. (Regul. Ed.) 2011;15:11–19. doi: 10.1016/j.tics.2010.10.002. [DOI] [PMC free article] [PubMed] [Google Scholar]
- Story GW, Carpenter RHS. Dual LATER-unit model predicts saccadic reaction time distributions in gap, step and appearance tasks. Exp Brain Res. 2008;193:287–296. doi: 10.1007/s00221-008-1624-1. [DOI] [PubMed] [Google Scholar]


