

Abstract
Although mass spectrometry is a century old technology, we are entering into an exciting time for the analysis of molecular information directly from complex biological systems. In this viewpoint article, we highlight emerging mass spectrometric methods and tools used by the natural product community and give a perspective of future directions where the mass spectrometry field is migrating towards over the next decade.
Introduction
All natural product (NP) scientists use mass spectrometry in their research, whether for the required sub 5 parts per million (ppm) parent mass high-resolution data for publication or as a part of the discovery workflow. Occasionally, mass spectrometry is used for assisting in structure elucidation but usually this occurs when other methods such as 1D and 2D NMR1, 2, X-ray3, UV-Vis signatures4, 5, and degradation studies are exhausted. NP scientists, typically, do not yet take full advantage of the modern capabilities of mass spectrometry. It is our viewpoint that mass spectrometry, when used appropriately, can rival and may even surpass NMR in assisting in the initial characterization of NPs. One of the strengths of mass spectrometry is that very small quantities of sample are required and therefore the ability to gain as much structural information from a single mass spectrum would be enormously powerful. The mass spectrometry structural analysis workflows, however, are just beginning to emerge.
Mass spectrometry (MS) has experienced major instrumental advances in the past ten years. Progress in ionization techniques, mainly the development of ambient ionization sources, has led to the analysis of samples in the free environment outside of the mass spectrometer6, 7. Additionally, significant progress in terms of mass resolution and accuracy has been reached leading to a reachable 24 million resolution and higher with sub parts per billion (ppb) mass accuracy8, while resolutions greater than 40,000 and mass accuracies below 1 ppm are common on user friendly instruments9, 10. Mass spectrometers have been progressively adapted to routine use with easier instructions to operate and maintain instruments, making this analytical tool accessible to a wider community of scientists. The ease of use, sensitivity, and robustness combined with reasonable costs of instrumentation has driven NP investigators to adopt mass spectrometry for day-to-day laboratory usage.
Excitingly, modern mass spectrometry is beginning to be used, not only in the early therapeutic discovery or other biotechnological applications but also for NPs discovery. Furthermore DNA sequencing has been informing us in the past decade that the NP production potential of biological systems is much greater that was appreciated prior to sequencing advances. Similarly these observed biosynthetic “potentials” and ecological roles of NPs has prompted investigations to move from one molecule at a time to the analysis/characterization of how multitudes of molecules converge towards a phenotype or the complete molecular diversity in a given ecosystem. Studies such as these require that workflows be developed that can be used to capture the full molecular complexity in any given sample. Atmospheric ionization is one such method that captures complexity and can be used to track molecules in situ.
In this perspective review, we highlight the emerging mass spectrometry tools for NP investigation by overviewing many the emerging ionization methods and instrumentation advances with emphasizing their potential for NPs analysis. We will also provide the emerging imaging mass spectrometry techniques for spatial mapping of NPs in a biological sample. Finally, we will outline the development of new powerful tools to process MS data that will allow faster dereplication and structural elucidation of metabolites, leading to a boom in screening new biologically active compounds in the upcoming years.
Ion sources and instrumentation
Recent developments
Mass spectrometry's fourth Nobel prize came with the development of electrospray ionization11 and matrix assisted laser desorption ionization (MALDI)12,13 in the 1980's. These innovations allowed MS to be utilized for biological applications. Since then, the NPs community has embraced, utilized, and advanced both techniques extensively. Of particular relevance to the NP scientist, is the resurgence of ambient ionization methods following Graham Cooks' seminal work on desorption electrospray ionization mass spectrometry (DESI) in 200414 and Robert B. Cody's work on Direct Analysis in Real Time (DART) in 200515. Both methods offered the ability to generate mass spectrometry data at atmospheric pressure without the need for sample preparation. The DESI method employs electrospray of charged droplets of organic solvent on the surface of the sample via a gas jet resulting in desorption of materials (Figure 1-a), while DART allows direct analysis simply by exposure of the sample to a stream of gas excited by heated plasma (Figure 1-b).
Figure 1.
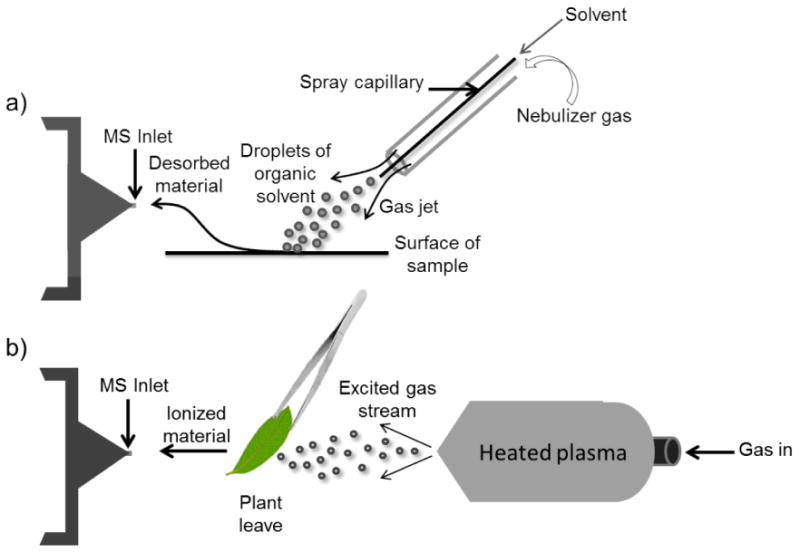
Two representative atmospheric ionization sources. a) DESI and b) DART ionization methods.
Since the development of DESI and DART as atmospheric ionization methods enabling the direct analysis of molecules from biological samples, more than 30 new and hybrid techniques have emerged6, 16, 17, creating an acronym alphabet soup. It is important to note that each of these different technologies have various applications that enables one to survey the molecular aspects of our natural world. Several studies have reported applications of ambient ionization in capturing NPs from plants and microorganisms. Examples of direct screening of plant metabolites using DESI include characterization of terpene glycosides from Stevia leaves18, and alkaloids from poisonous plants19 among others. Recent applications of DART analysis of plants include detection of volatile organic compounds such as monoterpenes and flavonoides from several species of eucalyptus20, Cassia sieberiana21, and detection of curcumin and its derivatives from turmeric22. Other applications of ambient ionization for NP analysis from microorganisms include DART analysis of alkaloids from a marine-derived fungus23, direct analysis of metabolites from cyanobacteria using Laser Ablation Electrospray Ionization (LAESI)24, and from Pseudomonas and Bacillus strains using nanoDESI25.
Not only have atmospheric ionization methods advanced, but also the instrumentation itself has significantly improved. Of particular relevance to the NP community is the increased sensitivity provided by implementing powerful ion optics with improved ion transmission in the development of sensitive and easy-to-use commercial high resolution mass spectrometers such as Q-TOFs (Quadrupole-Time of flight) with a single point lock mass internal calibration26, LTQ-Orbitrap hybrid and Fourier transform ion cyclotron (FT-ICR)27, 28. High resolution instruments are becoming necessary for NP identification by providing accurate mass measurements for the determination of chemical formula in addition to MS/MS spectra of compounds generating high confidence in structural elucidation. Coupling high resolution MS instruments to separation devices such as gas chromatography (GC)29, liquid chromatography (LC)30, 31 provides additional separation of molecules from a complex sample without extensive purification. One of the most relevant progresses in this field is the introduction of ultra-performance liquid chromatography (UPLC), leading to improvements in chromatographic peak resolution, sensitivity, separation speed, and spectral quality32. Examples of recent applications of LC - high resolution MS for NP analysis include dereplication of fungal metabolites33 and a high-throughput analysis of phytochemicals in a plant extract34.
What the future holds
Further progress in instrumentation will continue to emerge in the following years; routine use of mass spectrometry will no longer only be by the highly trained analytical researchers but also by a wider community of scientists from diverse fields. Ambient ionization is a promising technique for the development of such portable and miniaturized mass spectrometers for routine workflows inside laboratories as well as for outside field work35-38. High pressure portable mass spectrometers weighing only 2 kg and equipped with diminutive ion traps are now commercially available39, and have already begun to demonstrate their potential in forensic analysis and at airports for rapid detection of trace amounts of drugs and explosives.
Although this may seem far-fetched, most modern mass spectrometers can already detect just a few hundred ions. It should be expected that in the not too distant future mass spectrometer detectors will enable routine analysis of perhaps a single ion. When this becomes possible one can imagine quantification of the signal in similar ways as cell sorting is used to quantify cellular responses. The ability to quantitate accurately with mass spectrometry would significantly change the way biology is studied.
Spatial mapping of NPs
Recent advances
Imaging mass spectrometry (IMS) was first popularized by R. Caprioli in 1997, using a MALDI ionization method40. In the past decade, imaging mass spectrometry has risen from a novelty mass spectrometry method to a powerful strategy in understanding the spatial distribution of molecules in biological systems. This has not gone unnoticed by the NP scientists that are exploring the use of IMS to discover new NPs as well as delineating the functional roles of NP through spatial mapping. In imaging mass spectrometry, an MS spectrum is obtained while the location of the ionization is connected to the location where the ions came from. Initially this was extensively applied to molecular histology41-43. Imaging mass spectrometry was used to spatially map the molecules within a tissue section in a dataset. It bypassed the limitations of both tissue homogenization and antibody staining methods, which require a preliminary knowledge of target molecule(s). MALDI-IMS involves four key steps. First, the sample (tissue section, bacterial colony or an entire organism) is mounted on a conductive support, then a thin layer of matrix is applied onto the sample surface, allowing molecular ionization and desorption upon laser irradiation. The sample mounted on conductive support is then positioned on a sample stage under vacuum. The sample stage is programmed to move following a predefined x and y raster which allows the laser to scan the entire sample surface. At each sample spot, a mass spectrum and the corresponding x and y coordinates at which the mass spectrum was acquired are recorded. Finally, a 2D image of the sample is reconstructed displaying the spatial distribution of each detected molecule present within the sample. MALDI-IMS is the most widely used imaging approach as it involves the use of a soft ionization method that allows detection of intact molecules with a wide range of m/z coverage allowing molecules of up to 100 kDa to be detected. MALDI-IMS has been extensively applied for NP analysis, by providing 2D spatial distribution of secondary metabolites from several living organisms44. Some of the examples include use of MALDI-IMS to investigate production of antibiotics by symbiotic Streptomyces in the larval cocoon of beewolf digger wasps45 and by Streptomyces and other actinomycetes in leaf-cutting ants46, 47, production of NPs in bacterial co-cultures48-51, gut52, plants 53, and marine organisms54 including cyanobacteria55, zoanthids56 and marine sponges55, 57-59.
Recent advances in IMS software tools60-63 have led to the development of 3D IMS displaying spatial distribution in an entire biological sample64. 3D MALDI IMS is performed by assembling IMS images obtained on consecutive sections of a given sample, such as tissue sections or agar slices from -microbial cultures, with predefined spatial intervals. 3D MALDI imaging has been used to capture the depth profiles of bacterial metabolites secreted within the agar medium which was not possible previously using 2D IMS65. These findings emphasize the relevance of 3D IMS, as an emergent approach for NP discovery, in understanding the molecular interplay at controlling and driving ecology in complex biological systems.
Although MALDI-IMS is providing spectacular new insights in the spatial distribution of NP, it suffers from various limitations. The most important issue is the interference caused by the matrix composed of small molecules mainly detected in the low m/z range leading to ion interference with NP ions44, 51. Additionally, reproducibility of MALDI-imaging is still a challenge as ionization is driven by the quality of crystals obtained. Thus, the use of ambient ionization based IMS approaches, such as DESI, could be a good alternative to alleviate MALDI-IMS limitations for NP research.
DESI-IMS is an emerging technique and is bestowed with various advantages over MALDI-IMS. Lack of sample preparation and the ability to ionize the sample under ambient conditions make DESI-IMS very attractive for imaging of intact biological samples when compared to MALDI-IMS. Recent applications of DESI-IMS in the NP field include the determination of specific distribution of bromophycolides on the surface of algae Callophycus serratus and their role in anti-fungal defense66, 67. The potential of DESI imaging in NP research has recently been exploited and the initial reports that have emerged highlight the power of this tool in exploring functions of surface associated NPs in their native environment.
One of the main limitations of IMS approaches (MALDI and DESI) is the low spatial resolution of hundreds of microns. An alternative to this issue would be the use of Secondary Ion Mass Spectrometry (SIMS) imaging. This technique is based on directing a focused ion beam of primary ions (e.g Cs+, Au+, Xe+) on the sample surface, resulting in emission of secondary charged ions. The main advantage of SIMS for imaging is the ability to focus the primary ion beam to 100 nm68, leading to generation of high spatial resolution images that allow investigations at the subcellular scale. The utility of SIMS-IMS in NPs research has been demonstrated by looking at metabolite distributions in bacteria such as Bacillus subtilis69 and Streptomyces coelicolor70, 71. Although SIMS-IMS overcomes the limitation of spatial resolution, the inherent requirement for flat surfaces poses a challenge since most biological samples are not usually flat44.
Among all imaging techniques, MALDI-IMS is the most widely and frequently used method to date for NP imaging due to its better accessibility and well documented user protocols. It has now become a routine tool used by scientists to investigate NPs distribution in biological samples. Without doubt, this technique will continue to dominate in NP imaging field in the foreseeable future. MALDI-IMS complements DESI-IMS, SIMS-IMS and other IMS methods, and these techniques, when used in conjunction, will enable better understanding of NP function in a biological system. Furthermore, a significant increase in atmospheric ionization-IMS applications in the field of NP research is expected to rise in the upcoming years as the lack of sample preparation is the key for rapid screening of NP.
What the future holds
Over the next years, we can look forward to significant advances in IMS approaches in terms of sample preparation, data analysis, software and new instrumentations aiming at improving the resolution and mass accuracy of IMS. IMS in the field of NPs has mainly been performed on low resolution instruments employing TOF and ion trap analyzers. However, these analyzers lack mass resolution and accuracy, which is incompatible with accurate compound identification72 especially when employing workflows involving database mining. Adapting high resolution instrumentations such as Q-TOF, Ion cyclotron resonance and Orbitrap systems for use in IMS applications will overcome this limitation and will considerably increase the quality of data73. These advancements will enable accurate measurement of MS/MS data for further molecular identification and rapid dereplication. Furthermore, IMS of NPs has been performed at a spatial resolution of 100-800 μm so far, which hampers the investigation of subcellular localization of intact molecules. Over the next decade, availability of more efficient ionization sources and more sensitive detectors will enable visualization of intact NPs at the subcellular level. At the opposite end, the concept of IMS will be used to define the chemical ecological principles of interspecies interactions at a much larger scale. One can envision that with these technological advancements, mapping of NPs, for example, on mountain ranges or at a global scale will become feasible.
Analysis of complex samples
Beyond LC-MS and honing in on one specific NP, there is limited work done to capture the full chemo-diversity in a given sample. In part this is due to the complexity of samples. Identification of one molecule is already challenging, imagine dealing with hundreds if not thousands of molecules. Genomics has dealt with the transition to “Big Data” very effectively but the analysis of NPs at this scale is still lagging behind, in part because the technologies that enable one to capture complex samples are trailing. There are several technologies that are emerging that capture the complexity that are enabling the analysis of complex mixtures with mass spectrometry. First, the faster scan rates of modern mass spectrometry instruments. Some are now capable of capturing MS/MS spectra at greater than 40 scans per second74. This is important to obtain deeper insight into the molecular diversity of a sample. There is also a movement to make mass spectrometry data collection systematic or data independent75. Swath is one approach that has seen utility in proteomics76 but less so in metabolomics or NP research. It is likely that such an approach will enable a much more systematic analysis of complex NP samples. Ion mobility is another emerging tool that separates ions based on hydrodynamic radius and charge. One can understand this by comparing an aerodynamic car with a non-aerodynamic car; between the two, the aerodynamic car will move faster. Ion mobility operates via a similar principle. Thus far, there are a few studies from the NP community that have used ion mobility77, 78. Most exciting potential of ion mobility MS is the capability to separately detect different region- and stereo isomers. As mass spectrometers are becoming more sensitive, more data is collected. We have not yet learned how to deal with the complexity of all the information that is generated. Molecular networking mentioned in the dereplication section below, is one tool that is beginning to address this problem. It is expected that major inroads into software and algorithms to tease apart such mixtures at the structural level will become the standard mode of operation in many NP laboratories in the decade to come.
Dereplication and structural elucidation by mass spectrometry
Recent advances
Dereplication, the process of identifying molecules for which the structure is already known is an integral part of the NP discovery workflow79. In the metabolomics community this process is referred to as “finding known unknowns” after a Rumsfeld quote for the presence of weapons of mass destruction in Iraq80. Dereplication is critical to the discovery workflow so that known molecules can be triaged from further analysis quickly and efficiently in order to save time and resources81.
Currently, the cost associated with solving a single structure can range dramatically overall when factors like laboratory equipment, solvents, and personnel time are taken into consideration. A conservative estimate would be that it takes an experienced NP chemist about three months to fully elucidate a structure. Over this time period the researcher would need to extract a large amount of biomass or grow a microbial producer, then following this there would be successive rounds of purifications. Depending on the compound, this can range from days to weeks or longer. Upon purification of an ideal amount, one would need about 48 hours' NMR time with typical recharge being about $15 per hour. It would take an experienced researcher to have a planar structure in about one week, and then further studies for stereo-chemical assignments and physical data collection and verifications would be required. We estimate these costs to be around $15,000 (personnel time, solvents, NMR/MS recharge, media, columns, etc). These estimates are for one structure, under the most ideal conditions. These costs can be easily lowered when dereplication can be accomplished or quickly raised for complex molecules with poor chromatographic properties produced in low overall titer. For some molecules the cost of complete structure elucidation can be over one million dollars. We would like to suggest that any advances or hyphenated techniques that reduce the price of one structure down to hundreds of dollars rather than thousands or tens of thousands should be universally adopted in the academic discovery workflow and is a goal the community as a whole should strive towards.
In the context of the discovery workflow, the main usage of mass spectrometry based dereplication is typically coupled with liquid chromatography with a diode array detector. Typically the instruments are not configured to collect tandem or MS/MS data33. With this configuration, the MS1, UV signatures, and taxonomic classifications are then dereplicated using in-house or external databases. Most databases are far from comprehensive and it requires a researcher use many different databases in the initial dereplication efforts. Many times, due to a time lag between when databases are updated, or the applied dereplication workflow simply missed a known molecule, it is common to proceed with a full structural elucidation for any given compound. As elaborated above this process can be both time consuming and expensive. Currently, the majority of dereplication workflows can be further expedited if users are willing to incorporate the sensitive capabilities of modern mass spectrometry. Although semi-automated workflows using databases have been established82-84, the majority of dereplication is still a combination of manual interpretation of the data (UV signature, mass spectrometry data or NMR data) coupled with searching different databases such as AntiMarin85, AntiBase74, 85, Dictionary of Natural Products86, MarinLit, Scifinder, and Beilstein to name a few. In principle, metabolomics databases that allow one to search based on an MS and/or MS/MS patterns such as Massbank87, Metlin88, NIST89, LIPIDMAPS90(Table 1) could be consulted, but these databases are rarely consulted because there are few NPs present in the databases. Emerging de novo informatics tools can predict fragmentation data from imported structures or partial structures and then match it to the experimental fragmentation spectra Such approaches are aiding in the dereplication of certain subclasses of ribosomally-synthesized and post-translationally-modified peptides NPs91, non-ribosomal peptides91-94, and lipids95 (Table 2).
Table 1. Representative spectrum based dereplication databases.
| Description | www-link | Types of NPs |
|---|---|---|
| Massbank87 | http://www.massbank.jp/ | Any but main focus is primary metabolites |
| Metlin88 | http://metlin.scripps.edu/index.php | Any but main focus is primary human metabolites |
| LipidMAPS90 | http://www.lipidmaps.org/tools/index.html | Lipids, sterols and some polyketides |
| Human metabolome database96 | http://www.hmdb.ca/spectra/ms_ms/search | Human metabolites |
| GNPS: Global Natural Product Social Molecular Networking | To be submitted. Contact the Dorrestein (pdorrestein@ucsd.edu) and Bandeira (bandeira@ucsd.edu)labs | Any |
Table 2. Mass spectrometry predicted spectra dereplication databases.
| Description | www-link | Types of NPs |
|---|---|---|
| Cycloquest : Database Search for Cyclic Peptides91 | http://cyclo.ucsd.edu/cycloquest/user/w6njgUeoIiOxl3bP/7k68EdTvyx797RS4 | Cyclic, cyclic/linear hybrids/linear RiPP (Ribosomally-synthesized and post-translationally-modified peptides) |
| Dereplication of Cyclic/Branch-Cyclic Peptides using Norine Database | http://cyclo.ucsd.edu/dereplication/user/w6njgUeoIiOxl3bP/CXpEMsv4HxH7Qaq9 | NRP (Non ribosomal peptides) |
| NRP Dereplication93 | http://rofl.ucsd.edu/nrp/derep.cgi | NRP (Non ribosomal peptides) |
| Chemoinformatic library-based and informatic search strategy for natural products94 | http://www-novo.cs.uwaterloo.ca:8180/isnap/ | NRP (Non ribosomal peptides) |
| Lipidblast95 | http://fiehnlab.ucdavis.edu/projects/LipidBlast | Lipids |
Microbial dereplication is emerging as a useful prioritization strategy for the discovery workflow as well. Many researchers conduct 16S/18S analysis to characterize environmental isolates, however this classification does not give insight into the diversity of NPs produced97. Therefore chemistry based strain dereplication is becoming more prevalent98-100. Bugni and others have begun to use LC-MS based work-flows in combination with multi-variable analysis such as principle component analysis (PCA) to prioritize and dereplicate microorganisms in order to focus on strains with the potential to produce novel chemistries101-103. Many of the processing software that comes with mass spectrometers has some form of multivariable analysis embedded to allow users to make global assessments of entire data sets, making this approach accessible to anyone. These global assessments could be applied to large biomass collections to discover collections which contain unique chemistries. These microbial and multivariate analyses work well when the sample size is well defined to a small number of samples, but we anticipate that this approach becomes less informative (or harder to interpret) when sample size increases into the thousands. Alternative algorithms or pre-filtering of the data before applying the computational analyses may overcome such limitations.
Structure elucidation
Mass spectrometry has as much structural elucidation potential as NMR, yet it is not widely used in this context. In part this is due to the lack of development of mass spectrometry structure elucidation based workflows by the community. Currently mass spectrometry is several orders of magnitude more sensitive than NMR and MS can be used to more efficiently analyze complex mixtures. One of the biggest reasons MS is not frequently applied to discovery workflows is due to a limited number of established rules and workflows that can be applied, but creative informatics approaches are currently overcoming these limitations.
NP scientists and informaticians have joined forces in recent years to begin tackling this problem. The goal of these efforts is to understand and deconvolute mass spectrometry data to provide information on the molecule at the structural level. In other words, if you have mass spectrometry data on a specific molecule, how much structural information is present in the given MS data set? This MS based NP elucidation is just at the early stages. Herein we highlight the three major areas of development: (1) comparative dereplication workflow, (2) complete de novo structure prediction workflows, and (3) workflows that incorporate genomic information together with the mass spectrometry data.
In comparative dereplication based structural analysis, spectra of related molecules are compared and the structure of an unknown but related sample can be inferred based on similarities from MS/MS features, much like comparing structurally related analogues and inferring differences in 1H NMR. These efforts have focused on the adaptation of algorithmic solutions designed to locate novel post-translational modifications of proteinogenic peptides in proteomic experiments to map structural relationships of peptidic NPs (Non ribosomal peptides: NRP; ribosomally-synthesized and post-translationally-modified peptides: RiPPs). Comparative spectral analysis can be extended to other classes of molecules as well. One such example is molecular networking which established that spectral patterns found in MS/MS spectra can be used for both dereplication and identification of structural analogues104-108. Molecular networking is an informatics approach that compares all MS/MS data in an experiment and creates a map of mass spectral structural space25. This results in the display of molecular families where molecules with related MS/MS spectra cluster together105. As an example, UPLC-MS/MS data was collected on a FDA-approved drug library (Selleckchem) and as shown in Figure 2, the tetracycline antibiotics (doxycycline, methacycline, minocycline, and oxytetracycline) clustered together due to the similarity in their chemical structures and hence fragmentation patterns. This is a strategy to dereplicate related molecules108.
Figure 2.
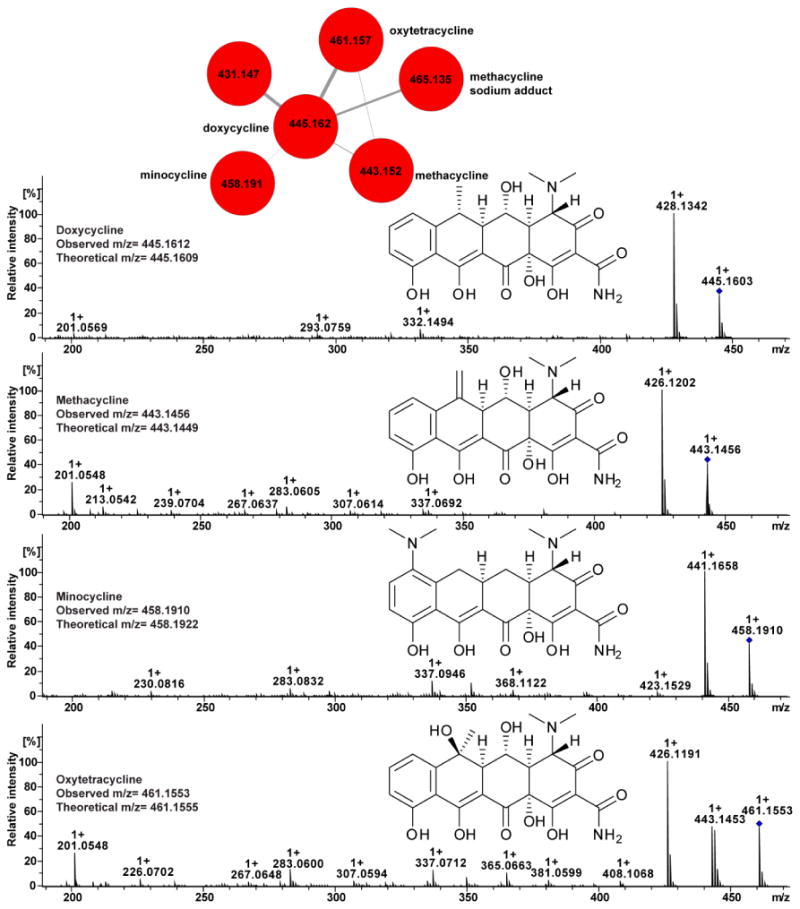
Molecular networking of MS/MS spectra of tetracycline antibiotics: Doxycycline (m/z 445), Methacycline (m/z 443), Minocycline (m/z 458) and Oxytetracycline (m/z 461).
The second approach is the complete de novo prediction of a planar structure of a NP based on the fragmentation patterns (Table 3). The first successful demonstration of this approach was for cyclic peptide NPs93. In this case, multiple mass shifts that are repeatedly observed can be used as redundant information to obtain a sequence of masses corresponding to individual amino acids. The structural prediction of such cyclic peptides is enhanced by the use of fragmentation trees. Additional tools to de novo predict cyclic peptides continue to be developed91, 109. More recently the de novo structure prediction has been extended to other structural classes of NPs with fragmentation trees110. Fragmentation trees can be used both for substructure prediction and ultimately towards the assembly of putative planar structures. It is worth noting that these tools are at the early stages of development still, and their utility in proof-of-principle studies has been well documented. It is expected that these tools will become very sophisticated over the next 10 years. Currently, there are two key limitations for advancing these tools for use by NP scientists. Firstly, to develop good tools, informaticians and computer scientists require a large amount of representative data, which for many complex and structurally diverse NPs is not yet available. Secondly, successful algorithm development relies on close working relationships between computer scientists and NP scientists so that each may contribute their specific knowledge towards addressing the shortcomings and pitfalls in data analysis and interpretation. This collaborative interaction needs to happen more frequently with open dialogues between the different scientific specialties.
Table 3. Mass spectrometry based structural elucidation tools.
| Description | www-link | Types of NPs |
|---|---|---|
| Multistage De Novo Sequencing of Cyclic Peptides115 | http://cyclo.ucsd.edu/multistage/user/lqhdHFb2Xl2SzGGI | Linear and cyclic peptides RiPP and NRP |
| De novo Sequencing of Linear/Cyclic Peptides | http://cyclo.ucsd.edu/denovo/user/lqhdHFb2Xl2SzGGI | Linear and cyclic peptides RiPP and NRP |
| Genome based RiPPquest | http://cyclo.ucsd.edu:4567/ms_ripper_full | RiPP |
| Genome based NRPquest | http://cyclo.ucsd.edu:4568/nrpquest_full | NRP |
| Partial sequence tags for cyclic peptides | http://rofl.ucsd.edu/nrp/tagging.cgi | NRP and RiPP |
| Cyclone: de novo sequencing of cyclic peptides109 | http://ms.biomed.cas.cz/MSTools/ | Cyclic peptides (NRP) |
| IDing Unknowns with Fragmentation Trees110, 116 | Contact the Boecker lab (sebastian.boecker@uni-jena.de) | Any, can provide structural class |
As our understanding of the biosynthetic machinery for NPs is advanced, it is becoming possible to use genomic information as a way to connect MS/MS signatures to their biosynthetic machineries while lending insight into the structure as well. The combination of the genetic analysis and the MS/MS signature can reveal significant details about the structure of the molecule. For example when the mass spectrometry data of a secreted factor from a microbe reveals that it matches to oligosaccharide signatures, one can look at the genome for gene clusters that have that biosynthetic machinery imbedded in them. The specific gene candidates that build sugars can be readily found on the genome and gives insight into the nature of the sugar moiety. For instance, if the neighboring sugar gene cluster has known biosynthetic features, such as a polyketide synthase, one knows to mine the data for a hybrid polyketide-oligosacharide. At a minimum, we can establish the link between molecules and the genes that are responsible for their production, but often, through the iterative analysis and further inspection of the gene cluster the process reveals additional structural details. This workflow has been established for peptide NPs and is termed peptidogenomics111 and for sugar containing NPs is termed glycogenomics112. It is likely that other classes of NPs give specific and characteristic MS/MS signatures and can be connected to their biosynthetic machinery in a similar fashion.
Finally there are hybrid and automated NMR113 and MS/MS workflows114. The design of these workflows have been largely been developed by biotechnology companies and has seen limited development in academic based discovery workflows. The goal of these workflows is to take molecular information and MS/MS information to determine all possible molecular details of a molecule and then put together all possible structures and then score and identify the structure that best represents all the data.
What the future holds
Imagine a researcher running an entire inventory of NP extracts and within seconds dereplicating all the known molecules, as well as structurally related analogues, and for the unknown molecules identifying the structural classes they belong to. This situation can be possible and the first generation workflows are currently being developed. In the next decade(s) one can expect that fully integrated workflows are developed where entire data sets from one spectrum to sets containing millions of spectra are characterized rapidly. In all cases the candidate structural class and any distinct structural details the MS provides will occur in one analysis run. This potential will only be possible if the community gets involved, shares and contributes data, and works to annotate the chemistry as a community. It becomes a crowdsourcing for molecular and structure elucidations. The first step towards this is being built where researchers can upload data of known molecules and the entire data set irrespective of the number of files. Such data repositories have been incredibly useful in the sequencing world and for the protein structure elucidation community with the development of the protein data bank and Genbank, respectivly. However one can make such databases interactive and they can be automatically queried and correlated. This alone will be incredibly valuable to the NP community. Further, one can comment and subscribe to data sets to get information and continuous identifications as new data is added to this repository. Finally there should be wiki style annotation of data. Combine this effort with the creation of a community for the development of new tools it will become possible to perform large scale analysis of NPs. This type of crowdsourcing approach, is a concept we refer to as global NP social molecular networking, is intended to be a large open source database for the collection and storage of all data. It is expected, that if the current trends hold, depositing all data in a publicly accessible repositories will become mandated by most funding bodies in the next few years. The most exciting aspect of the crowdsource-style annotation is the prospect of something collected in 2014 becoming useful in the year 2023 as someone may provide a comment or upload a spectrum of a known molecule related to the data that was uploaded in 2014. In other words it will provide a mechanism to learn from the data beyond the publication and specific laboratory personnel. Perhaps with all these advances in mass spectrometry as well as advances in other structure elucidation methodologies not a part of this review3, 117, the cost of discovery of known NPs can be brought to a few dollars each while the cost of structure elucidation of new chemical entities can be pushed to below a few hundred dollars.
Conclusion
The ability to capture and characterize NPs by mass spectrometry is improving significantly. Advances in methodology and instrumentation established mass spectrometry as an indispensable tool for facile and speedy metabolite identifications. The main benefit of mass spectrometry progress in the NPs field is the reduction as much as possible of sample preparation steps allowing for time and sample savings, and a faster and direct screening of NPs from live biological samples, using ambient ionization methods. Furthermore, future development of new algorithms to process MS data will lead to an establishment of standardized workflows for an easier and faster dereplication of NPs, leading to a significant increase of new NPs discovery in the upcoming years.
Much of the development of new and improved mass spectrometers is extensively oriented towards simpler instruments that can be used in routine by a broad community of scientists. Future progress in the development of miniaturized mass spectrometers will allow performing “bench-top mass spectrometry” and the use of these instruments outside of laboratories, leading to a significantly extended range of applications in NPs field, especially, if the data collection is automatically tracked with GPS making automated global MS analysis possible.
Moving forward, the future for both NPs and mass spectrometry is bright. Collaborations and the merging of informatics with advances in instrumentation will lead to the creation of unique and automated workflows. These workflows will expedite the discovery process by allowing for rapid dereplication which in turn will save researchers time, money, and lower the quantity of precious sample needed for a full structure elucidation to sub microgram quantities. As mass spectrometers become less complex and reasonably priced, we expect mass spectrometry based structure elucidation workflows to become common place in the NPs field.
Acknowledgments
A. Bouslimani is, in part, supported by the Keck foundation and the San Diego Center for Systems Biology Pilot Project (SDCSB) NIH GM085764. L.M. Sanchez is supported, in part, by National Institutes of Health IRACDA K12 GM068524 grant award. N. Garg is, in part, supported by UCSD Clinical and Translational Research Institute Pilot award. The support to Dorrestein laboratory was provided by NIH AI095125, GM097509, GM094802 and European Union 7th Framework Programme grant 305259. We further acknowledge Bruker and NIH (GMS10RR029121) for the support of the shared instrumentation infrastructure. We thank C.J. Schulze for scientific discussions.
References
- 1.Robinette SL, Brueschweiler R, Schroeder FC, Edison AS. Acc Chem Res. 2012;45:288–297. doi: 10.1021/ar2001606. [DOI] [PMC free article] [PubMed] [Google Scholar]
- 2.Forseth RR, Schroeder FC. Curr Opin Chem Biol. 2011;15:38–47. doi: 10.1016/j.cbpa.2010.10.010. [DOI] [PMC free article] [PubMed] [Google Scholar]
- 3.Inokuma Y, Yoshioka S, Ariyoshi J, Arai T, Hitora Y, Takada K, Matsunaga S, Rissanen K, Fujita M. Nature. 2013;501:262–262. doi: 10.1038/nature11990. [DOI] [PubMed] [Google Scholar]
- 4.Klitgaard A, I A, Andersen MR, Larsen TO, Frisvad JC, Nielsen KF. Anal Bioanal Chem. 2014;406:1933–1943. doi: 10.1007/s00216-013-7582-x. [DOI] [PMC free article] [PubMed] [Google Scholar]
- 5.Nielsen KF, Mansson M, Rank C, Frisvad JC, Larsen TO. J Nat Prod. 2011;74:2338–2348. doi: 10.1021/np200254t. [DOI] [PubMed] [Google Scholar]
- 6.Monge ME, Harris GA, Dwivedi P, Fernandez FM. Chem Rev. 2013;113:2269–2308. doi: 10.1021/cr300309q. [DOI] [PubMed] [Google Scholar]
- 7.Ding X, Duan Y. Mass Spectrom Rev. 2013 doi: 10.1002/mas.21415. [DOI] [PubMed] [Google Scholar]
- 8.Nikolaev EN, Boldin IA, Jertz R, Baykut G. J Am Soc Mass Spectrom. 2011;22:1125–1133. doi: 10.1007/s13361-011-0125-9. [DOI] [PubMed] [Google Scholar]
- 9.Junot C, Fenaille F, Colsch B, Becher F. Mass Spectrom Rev. 2013 doi: 10.1002/mas.21401. [DOI] [PubMed] [Google Scholar]
- 10.Di Girolamo F, Lante I, Muraca M, Putignani L. Curr Org Chem. 2013;17:2891–2905. doi: 10.2174/1385272817888131118162725. [DOI] [PMC free article] [PubMed] [Google Scholar]
- 11.Fenn JB, Mann M, Meng CK, Wong SF, Whitehouse CM. Science. 1989;246:64–71. doi: 10.1126/science.2675315. [DOI] [PubMed] [Google Scholar]
- 12.Karas M, Hillenkamp F. Anal Chem. 1988;60:2299–2301. doi: 10.1021/ac00171a028. [DOI] [PubMed] [Google Scholar]
- 13.Hillenkamp F, Karas M. Methods Enzymol. 1990;193:280–295. doi: 10.1016/0076-6879(90)93420-p. [DOI] [PubMed] [Google Scholar]
- 14.Takats Z, Wiseman JM, Gologan B, Cooks RG. Science. 2004;306:471–473. doi: 10.1126/science.1104404. [DOI] [PubMed] [Google Scholar]
- 15.Cody RB, Laramee JA, Durst HD. Anal Chem. 2005;77:2297–2302. doi: 10.1021/ac050162j. [DOI] [PubMed] [Google Scholar]
- 16.Harris GA, Galhena AS, Fernandez FM. Anal Chem. 2011;83:4508–4538. doi: 10.1021/ac200918u. [DOI] [PubMed] [Google Scholar]
- 17.Weston DJ. Analyst. 2010;135:661–668. doi: 10.1039/b925579f. [DOI] [PubMed] [Google Scholar]
- 18.Jackson AU, Tata A, Wu C, Perry RH, Haas G, West L, Cooks RG. Analyst. 2009;134:867–874. doi: 10.1039/b823511b. [DOI] [PubMed] [Google Scholar]
- 19.Talaty N, Takats Z, Cooks RG. Analyst. 2005;130:1624–1633. doi: 10.1039/b511161g. [DOI] [PubMed] [Google Scholar]
- 20.Maleknia SD, Vail TM, Cody RB, Sparkman DO, Bell TL, Adams MA. Rapid Commun Mass Spectrom. 2009;23:2241–2246. doi: 10.1002/rcm.4133. [DOI] [PubMed] [Google Scholar]
- 21.Kpegba K, Agbonon A, Petrovic AG, Amouzou E, Gbeassor M, Proni G, Nesnas N. J Nat Prod. 2011;74:455–459. doi: 10.1021/np100090e. [DOI] [PubMed] [Google Scholar]
- 22.Kim HJ, Jang YP. Phytochem Anal. 2009;20:372–377. doi: 10.1002/pca.1136. [DOI] [PubMed] [Google Scholar]
- 23.Watts KR, Loveridge ST, Tenney K, Media J, Valeriote FA, Crews P. J Org Chem. 2011;76:6201–6208. doi: 10.1021/jo2009593. [DOI] [PMC free article] [PubMed] [Google Scholar]
- 24.Parsiegla G, Shrestha B, Carriere F, Vertes A. Anal Chem. 2012;84:34–38. doi: 10.1021/ac202831w. [DOI] [PubMed] [Google Scholar]
- 25.Watrous J, Roach P, Alexandrov T, Heath BS, Yang JY, Kersten RD, van der Voort M, Pogliano K, Gross H, Raaijmakers JM, Moore BS, Laskin J, Bandeira N, Dorrestein PC. Proc Natl Acad Sci U S A. 2012;109:E1743–E1752. doi: 10.1073/pnas.1203689109. [DOI] [PMC free article] [PubMed] [Google Scholar]
- 26.Glauser G, Veyrat N, Rochat B, Wolfender JL, Turlings TC. J Chromatogr A. 2013;1292:151–159. doi: 10.1016/j.chroma.2012.12.009. [DOI] [PubMed] [Google Scholar]
- 27.Savory JJ, Kaiser NK, McKenna AM, Xian F, Blakney GT, Rodgers RP, Hendrickson CL, Marshall AG. Anal Chem. 2011;83:1732–1736. doi: 10.1021/ac102943z. [DOI] [PubMed] [Google Scholar]
- 28.Park KH, Kim MS, Baek SJ, Bae IH, Seo SW, Kim J, Shin YK, Lee YM, Kim HS. Plant Methods. 2013;9:15. doi: 10.1186/1746-4811-9-15. [DOI] [PMC free article] [PubMed] [Google Scholar]
- 29.Hernandez F, Sancho JV, Ibanez M, Abad E, Portoles T, Mattioli L. Anal Bioanal Chem. 2012;403:1251–1264. doi: 10.1007/s00216-012-5844-7. [DOI] [PubMed] [Google Scholar]
- 30.Xie C, Zhong D, Yu K, Chen X. Bioanalysis. 2012;4:937–959. doi: 10.4155/bio.12.43. [DOI] [PubMed] [Google Scholar]
- 31.Maurer HH. J Chromatogr A. 2013;1292:19–24. doi: 10.1016/j.chroma.2012.08.069. [DOI] [PubMed] [Google Scholar]
- 32.Wilson ID, Nicholson JK, Castro-Perez J, Granger JH, Johnson KA, Smith BW, Plumb RS. J Proteome Res. 2005;4:591–598. doi: 10.1021/pr049769r. [DOI] [PubMed] [Google Scholar]
- 33.El-Elimat T, Figueroa M, Ehrmann BM, Cech NB, Pearce CJ, Oberlies NH. J Nat Prod. 2013;76:1709–1716. doi: 10.1021/np4004307. [DOI] [PMC free article] [PubMed] [Google Scholar]
- 34.Park KH, Kim MS, Baek SJ, Bae IH, Seo SW, Kim J, Shin YK, Lee YM, Kim HS. Plant Methods. 2013;9 doi: 10.1186/1746-4811-9-15. [DOI] [PMC free article] [PubMed] [Google Scholar]
- 35.Fico M, Maas JD, Smith SA, Costa AB, Ouyang Z, Chappell WJ, Cooks RG. Analyst. 2009;134:1338–1347. doi: 10.1039/b822140e. [DOI] [PubMed] [Google Scholar]
- 36.Fico M, Yu M, Ouyang Z, Cooks RG, Chappell WJ. Anal Chem. 2007;79:8076–8082. doi: 10.1021/ac0711384. [DOI] [PubMed] [Google Scholar]
- 37.Gao L, Li G, Cooks RG. J Am Soc Mass Spectrom. 2010;21:209–214. doi: 10.1016/j.jasms.2009.10.005. [DOI] [PubMed] [Google Scholar]
- 38.Ouyang Z, Noll RJ, Cooks RG. Anal Chem. 2009;81:2421–2425. doi: 10.1021/ac900292w. [DOI] [PubMed] [Google Scholar]
- 39.M908: The world's first handheld mass spectrometer. http://www.908devices.com/products.
- 40.Caprioli RM, Farmer TB, Gile J. Anal Chem. 1997;69:4751–4760. doi: 10.1021/ac970888i. [DOI] [PubMed] [Google Scholar]
- 41.Eriksson C, Masaki N, Yao I, Hayasaka T, Setou M. Mass Spectrom. 2013;2:S0022. doi: 10.5702/massspectrometry.S0022. [DOI] [PMC free article] [PubMed] [Google Scholar]
- 42.Sugiura Y, Setou M. J Neuroimmune Pharmacol. 2010;5:31–43. doi: 10.1007/s11481-009-9162-6. [DOI] [PubMed] [Google Scholar]
- 43.Kim HK, Reyzer ML, Choi IJ, Kim CG, Kim HS, Oshima A, Chertov O, Colantonio S, Fisher RJ, Allen JL, Caprioli RM, Green JE. J Proteome Res. 2010;9:4123–4130. doi: 10.1021/pr100302b. [DOI] [PMC free article] [PubMed] [Google Scholar]
- 44.Esquenazi E, Yang YL, Watrous J, Gerwick WH, Dorrestein PC. Nat Prod Rep. 2009;26:1521–1534. doi: 10.1039/b915674g. [DOI] [PubMed] [Google Scholar]
- 45.Kroiss J, Kaltenpoth M, Schneider B, Schwinger MG, Hertweck C, Maddula RK, Strohm E, Svatos A. Nat Chem Biol. 2010;6:261–263. doi: 10.1038/nchembio.331. [DOI] [PubMed] [Google Scholar]
- 46.Haeder S, Wirth R, Herz H, Spiteller D. Proc Natl Acad Sci U S A. 2009;106:4742–4746. doi: 10.1073/pnas.0812082106. [DOI] [PMC free article] [PubMed] [Google Scholar]
- 47.Barke J, Seipke RF, Gruschow S, Heavens D, Drou N, Bibb MJ, Goss RJ, Yu DW, Hutchings MI. BMC Biol. 2010;8:109. doi: 10.1186/1741-7007-8-109. [DOI] [PMC free article] [PubMed] [Google Scholar]
- 48.Yang JY, Phelan VV, Simkovsky R, Watrous JD, Trial RM, Fleming TC, Wenter R, Moore BS, Golden SS, Pogliano K, Dorrestein PC. J Bacteriol. 2012;194:6023–6028. doi: 10.1128/JB.00823-12. [DOI] [PMC free article] [PubMed] [Google Scholar]
- 49.Gonzalez DJ, Haste NM, Hollands A, Fleming TC, Hamby M, Pogliano K, Nizet V, Dorrestein PC. Microbiology. 2011;157:2485–2492. doi: 10.1099/mic.0.048736-0. [DOI] [PMC free article] [PubMed] [Google Scholar]
- 50.Yang YL, Xu Y, Straight P, Dorrestein PC. Nat Chem Biol. 2009;5:885–887. doi: 10.1038/nchembio.252. [DOI] [PMC free article] [PubMed] [Google Scholar]
- 51.Shih CJ, Chen PY, Liaw CC, Lai YM, Yang YL. Nat Prod Rep. 2014 doi: 10.1039/C3NP70091G. [DOI] [PubMed] [Google Scholar]
- 52.Rath CM, Alexandrov T, Higginbottom SK, Song J, Milla ME, Fischbach MA, Sonnenburg JL, Dorrestein PC. Anal Chem. 2012;84:9259–9267. doi: 10.1021/ac302039u. [DOI] [PMC free article] [PubMed] [Google Scholar]
- 53.Anderson DMG, Carolan VA, Crosland S, Sharples KR, Clench MR. Rapid Commun Mass Spectrom. 2009;23:1321–1327. doi: 10.1002/rcm.3973. [DOI] [PubMed] [Google Scholar]
- 54.Simmons TL, Coates RC, Clark BR, Engene N, Gonzalez D, Esquenazi E, Dorrestein PC, Gerwick WH. Proc Natl Acad Sci U S A. 2008;105:4587–4594. doi: 10.1073/pnas.0709851105. [DOI] [PMC free article] [PubMed] [Google Scholar]
- 55.Esquenazi E, Coates C, Simmons L, Gonzalez D, Gerwick WH, Dorrestein PC. Mol Biosyst. 2008;4:562–570. doi: 10.1039/b720018h. [DOI] [PMC free article] [PubMed] [Google Scholar]
- 56.Genji T, Fukuzawa S, Tachibana K. Mar Biotechnol. 2010;12:81–87. doi: 10.1007/s10126-009-9202-5. [DOI] [PubMed] [Google Scholar]
- 57.Yarnold JE, Hamilton BR, Welsh DT, Pool GF, Venter DJ, Carroll AR. Mol Biosyst. 2012;8:2249–2259. doi: 10.1039/c2mb25152c. [DOI] [PubMed] [Google Scholar]
- 58.Sanchez LM, Dorrestein PC. Nat Chem. 2013;5:155–157. doi: 10.1038/nchem.1583. [DOI] [PMC free article] [PubMed] [Google Scholar]
- 59.Graupner K, Scherlach K, Bretschneider T, Lackner G, Roth M, Gross H, Hertweck C. Angew Chem Int Ed. 2012;51:13173–13177. doi: 10.1002/anie.201206658. [DOI] [PubMed] [Google Scholar]
- 60.Trim PJ, Djidja MC, Muharib T, Cole LM, Flinders B, Carolan VA, Francese S, Clench MR. J Proteomics. 2012;75:4931–4940. doi: 10.1016/j.jprot.2012.07.016. [DOI] [PubMed] [Google Scholar]
- 61.Alexandrov T, Kobarg JH. Bioinformatics. 2011;27:i230–238. doi: 10.1093/bioinformatics/btr246. [DOI] [PMC free article] [PubMed] [Google Scholar]
- 62.Ye H, Greer T, Li L. Bioanalysis. 2011;3:313–332. doi: 10.4155/bio.10.201. [DOI] [PMC free article] [PubMed] [Google Scholar]
- 63.Alexandrov T, Chernyavsky I, Becker M, von Eggeling F, Nikolenko S. Anal Chem. 2013;85:11189–11195. doi: 10.1021/ac401420z. [DOI] [PubMed] [Google Scholar]
- 64.Seeley EH, Caprioli RM. Anal Chem. 2012;84:2105–2110. doi: 10.1021/ac2032707. [DOI] [PMC free article] [PubMed] [Google Scholar]
- 65.Watrous JD, Phelan VV, Hsu CC, Moree WJ, Duggan BM, Alexandrov T, Dorrestein PC. ISME J. 2013;7:770–780. doi: 10.1038/ismej.2012.155. [DOI] [PMC free article] [PubMed] [Google Scholar]
- 66.Lane AL, Nyadong L, Galhena AS, Shearer TL, Stout EP, Parry RM, Kwasnik M, Wang MD, Hay ME, Fernandez FM, Kubanek J. Proc Natl Acad Sci U S A. 2009;106:7314–7319. doi: 10.1073/pnas.0812020106. [DOI] [PMC free article] [PubMed] [Google Scholar]
- 67.Esquenazi E, Dorrestein PC, Gerwick WH. Proc Natl Acad Sci U S A. 2009;106:7269–7270. doi: 10.1073/pnas.0902840106. [DOI] [PMC free article] [PubMed] [Google Scholar]
- 68.Kraft ML, Klitzing HA. Biochim Biophys Acta. 2014 doi: 10.1016/j.bbalip.2014.03.003. [DOI] [PubMed] [Google Scholar]
- 69.Debois D, Hamze K, Guerineau V, Le Caer JP, Holland IB, Lopes P, Ouazzani J, Seror SJ, Brunelle A, Laprevote O. Proteomics. 2008;8:3682–3691. doi: 10.1002/pmic.200701025. [DOI] [PubMed] [Google Scholar]
- 70.Vaidyanathan S, Fletcher JS, Goodacre R, Lockyer NP, Micklefield J, Vickerman JC. Anal Chem. 2008;80:1942–1951. doi: 10.1021/ac701921e. [DOI] [PubMed] [Google Scholar]
- 71.Vaidyanathan S, Fletcher JS, Lockyer NP, Vickerman JC. Appl Surf Sci. 2008;255:922–925. doi: 10.1016/j.apsusc.2008.05.255. [DOI] [PMC free article] [PubMed] [Google Scholar]
- 72.Jungmann JH, Heeren RMA. J Proteomics. 2012;75:5077–5092. doi: 10.1016/j.jprot.2012.03.022. [DOI] [PubMed] [Google Scholar]
- 73.Rompp A, Spengler B. Histochem Cell Biol. 2013;139:759–783. doi: 10.1007/s00418-013-1097-6. [DOI] [PMC free article] [PubMed] [Google Scholar]
- 74.Bruker Daltonics Q-TOF newsletter. http://www.bruker.com/fileadmin/user_upload/8-PDF-Docs/Separations_MassSpectrometry/Literature/literature2013/Newsletters/1820231_QTOF_Newsletter_06-2013_eBook.pdf.
- 75.Rath CM, Yang JY, Alexandrov T, Dorrestein PC. J Am Soc Mass Spectrom. 2013;24:1167–1176. doi: 10.1007/s13361-013-0608-y. [DOI] [PMC free article] [PubMed] [Google Scholar]
- 76.Collins BC, Gillet LC, Rosenberger G, Roest HL, Vichalkovski A, Gstaiger M, Aebersold R. Nat Methods. 2013;10:1246–1253. doi: 10.1038/nmeth.2703. [DOI] [PubMed] [Google Scholar]
- 77.Esquenazi E, Daly M, Bahrainwala T, Gerwick WH, Dorrestein PC. Bioorg Med Chem. 2011;19:6639–6644. doi: 10.1016/j.bmc.2011.06.081. [DOI] [PubMed] [Google Scholar]
- 78.Goodwin CR, Fenn LS, Derewacz DK, Bachmann BO, McLean JA. J Nat Prod. 2012;75:48–53. doi: 10.1021/np200457r. [DOI] [PMC free article] [PubMed] [Google Scholar]
- 79.Lang G, Mayhudin NA, Mitova MI, Sun L, van der Sar S, Blunt JW, Cole ALJ, Ellis G, Laatsch H, Munro MHG. J Nat Prod. 2008;71:1595–1599. doi: 10.1021/np8002222. [DOI] [PubMed] [Google Scholar]
- 80.Little JL, Cleven CD, Brown SD. J Am Soc Mass Spectrom. 2011;22:348–359. doi: 10.1007/s13361-010-0034-3. [DOI] [PubMed] [Google Scholar]
- 81.Bugni TS, Harper MK, McCulloch MWB, Whitson EL. Natural Product Chemistry for Drug Discovery. Royal Society of Chemistry; 2010. pp. 272–298. [Google Scholar]
- 82.Tu Y, Yan B. Methods Mol Biol. 2012;918:117–126. doi: 10.1007/978-1-61779-995-2_9. [DOI] [PubMed] [Google Scholar]
- 83.Tu Y, Jeffries C, Ruan H, Nelson C, Smithson D, Shelat AA, Brown KM, Li XC, Hester JP, Smillie T, Khan IA, Walker L, Guy K, Yan B. J Nat Prod. 2010;73:751–754. doi: 10.1021/np9007359. [DOI] [PMC free article] [PubMed] [Google Scholar]
- 84.Bugni TS, Harper MK, McCulloch MW, Reppart J, Ireland CM. Molecules. 2008;13:1372–1383. doi: 10.3390/molecules13061372. [DOI] [PMC free article] [PubMed] [Google Scholar]
- 85.Laatsch H. Antibase, A Data Base for Rapid Dereplication and Strcuture Determination of Microbial Natural Products. Wiley-VCH; Weinheim, Germany: 2013. [Google Scholar]
- 86.Dictionary of Natural Products. Chapman & Hall Chemical Database; 2013. [Google Scholar]
- 87.Horai H, Arita M, Kanaya S, Nihei Y, Ikeda T, Suwa K, Ojima Y, Tanaka K, Tanaka S, Aoshima K, Oda Y, Kakazu Y, Kusano M, Tohge T, Matsuda F, Sawada Y, Hirai MY, Nakanishi H, Ikeda K, Akimoto N, Maoka T, Takahashi H, Ara T, Sakurai N, Suzuki H, Shibata D, Neumann S, Iida T, Funatsu K, Matsuura F, Soga T, Taguchi R, Saito K, Nishioka T. J Mass Spectrom. 2010;45:703–714. doi: 10.1002/jms.1777. [DOI] [PubMed] [Google Scholar]
- 88.Smith CA, O'Maille G, Want EJ, Qin C, Trauger SA, Brandon TR, Custodio DE, Abagyan R, Siuzdak G. Ther Drug Monit. 2005;27:747–751. doi: 10.1097/01.ftd.0000179845.53213.39. [DOI] [PubMed] [Google Scholar]
- 89.The National Institute of Standards and Technology (NIST) 2012 http://www.nist.gov/index.html.
- 90.Sud M, Fahy E, Cotter D, Brown A, Dennis EA, Glass CK, Merrill AH, Murphy RC, Raetz CRH, Russell DW, Subramaniam S. Nucleic Acids Res. 2007;35:D527–D532. doi: 10.1093/nar/gkl838. [DOI] [PMC free article] [PubMed] [Google Scholar]
- 91.Mohimani H, Liu WT, Mylne JS, Poth AG, Colgrave ML, Tran D, Selsted ME, Dorrestein PC, Pevzner PA. J Proteome Res. 2011;10:4505–4512. doi: 10.1021/pr200323a. [DOI] [PMC free article] [PubMed] [Google Scholar]
- 92.Mohimani H, Yang YL, Liu WT, Hsieh PW, Dorrestein PC, Pevzner PA. Proteomics. 2011;11:3642–3650. doi: 10.1002/pmic.201000697. [DOI] [PMC free article] [PubMed] [Google Scholar]
- 93.Ng J, Bandeira N, Liu WT, Ghassemian M, Simmons TL, Gerwick WH, Linington R, Dorrestein PC, Pevzner PA. Nat Methods. 2009;6:596–599. doi: 10.1038/nmeth.1350. [DOI] [PMC free article] [PubMed] [Google Scholar]
- 94.Ibrahim A, Yang L, Johnston C, Liu X, Ma B, Magarvey NA. Proc Natl Acad Sci U S A. 2012;109:19196–19201. doi: 10.1073/pnas.1206376109. [DOI] [PMC free article] [PubMed] [Google Scholar]
- 95.Kind T, Liu KH, Lee do Y, DeFelice B, Meissen JK, Fiehn O. Nat Methods. 2013;10:755–758. doi: 10.1038/nmeth.2551. [DOI] [PMC free article] [PubMed] [Google Scholar]
- 96.Wishart DS, Jewison T, Guo AC, Wilson M, Knox C, Liu YF, Djoumbou Y, Mandal R, Aziat F, Dong E, Bouatra S, Sinelnikov I, Arndt D, Xia JG, Liu P, Yallou F, Bjorndahl T, Perez-Pineiro R, Eisner R, Allen F, Neveu V, Greiner R, Scalbert A. Nucleic Acids Res. 2013;41:D801–D807. doi: 10.1093/nar/gks1065. [DOI] [PMC free article] [PubMed] [Google Scholar]
- 97.Hakvaag S, Fjaervik E, Josefsen KD, Ian E, Ellingsen TE, Zotchev SB. Mar Drugs. 2008;6:620–635. doi: 10.3390/md6040620. [DOI] [PMC free article] [PubMed] [Google Scholar]
- 98.Engene N, Choi H, Esquenazi E, Rottacker EC, Ellisman MH, Dorrestein PC, Gerwick WH. Environ Microbiol. 2011;13:1601–1610. doi: 10.1111/j.1462-2920.2011.02472.x. [DOI] [PMC free article] [PubMed] [Google Scholar]
- 99.Hou Y, Braun DR, Michel CR, Klassen JL, Adnani N, Wyche TP, Bugni TS. Anal Chem. 2012;84:4277–4283. doi: 10.1021/ac202623g. [DOI] [PMC free article] [PubMed] [Google Scholar]
- 100.Vynne NG, Mansson M, Nielsen KF, Gram L. Mar Biotechnol. 2011;13:1062–1073. doi: 10.1007/s10126-011-9369-4. [DOI] [PubMed] [Google Scholar]
- 101.Samat N, Tan PJ, Shaari K, Abas F, Lee HB. Anal Chem. 2014;86:1324–1331. doi: 10.1021/ac403709a. [DOI] [PubMed] [Google Scholar]
- 102.Hou Y, Tianero MD, Kwan JC, Wyche TP, Michel CR, Ellis GA, Vazquez-Rivera E, Braun DR, Rose WE, Schmidt EW, Bugni TS. Org Lett. 2012;14:5050–5053. doi: 10.1021/ol3022758. [DOI] [PMC free article] [PubMed] [Google Scholar]
- 103.Carr G, Poulsen M, Klassen JL, Hou Y, Wyche TP, Bugni TS, Currie CR, Clardy J. Org Lett. 2012;14:2822–2825. doi: 10.1021/ol301043p. [DOI] [PMC free article] [PubMed] [Google Scholar]
- 104.Liu WT, Lamsa A, Wong WR, Boudreau PD, Kersten R, Peng Y, Moree WJ, Duggan BM, Moore BS, Gerwick WH, Linington RG, Pogliano K, Dorrestein PC. J Antibiot. 2014;67:99–104. doi: 10.1038/ja.2013.99. [DOI] [PMC free article] [PubMed] [Google Scholar]
- 105.Nguyen DD, Wu CH, Moree WJ, Lamsa A, Medema MH, Zhao X, Gavilan RG, Aparicio M, Atencio L, Jackson C, Ballesteros J, Sanchez J, Watrous JD, Phelan VV, van de Wiel C, Kersten RD, Mehnaz S, De Mot R, Shank EA, Charusanti P, Nagarajan H, Duggan BM, Moore BS, Bandeira N, Palsson BO, Pogliano K, Gutierrez M, Dorrestein PC. Proc Natl Acad Sci U S A. 2013;110:E2611–2620. doi: 10.1073/pnas.1303471110. [DOI] [PMC free article] [PubMed] [Google Scholar]
- 106.Schorn M, Zettler J, Noel JP, Dorrestein PC, Moore BS, Kaysser L. ACS Chem Biol. 2014;9:301–309. doi: 10.1021/cb400699p. [DOI] [PMC free article] [PubMed] [Google Scholar]
- 107.Sidebottom AM, Johnson AR, Karty JA, Trader DJ, Carlson EE. ACS Chem Biol. 2013;8:2009–2016. doi: 10.1021/cb4002798. [DOI] [PMC free article] [PubMed] [Google Scholar]
- 108.Yang JY, Sanchez LM, Rath CM, Liu X, Boudreau PD, Bruns N, Glukhov E, Wodtke A, de Felicio R, Fenner A, Wong WR, Linington RG, Zhang L, Debonsi HM, Gerwick WH, Dorrestein PC. J Nat Prod. 2013;76:1686–1699. doi: 10.1021/np400413s. [DOI] [PMC free article] [PubMed] [Google Scholar]
- 109.Kavan D, Kuzma M, Lemr K, Schug K, Havlicek V. J Am Soc Mass Spectrom. 2013;24:1177–1184. doi: 10.1007/s13361-013-0652-7. [DOI] [PubMed] [Google Scholar]
- 110.Rasche F, Scheubert K, Hufsky F, Zichner T, Kai M, Svatos A, Bocker S. Anal Chem. 2012;84:3417–3426. doi: 10.1021/ac300304u. [DOI] [PubMed] [Google Scholar]
- 111.Kersten RD, Yang YL, Xu Y, Cimermancic P, Nam SJ, Fenical W, Fischbach MA, Moore BS, Dorrestein PC. Nat Chem Biol. 2011;7:794–802. doi: 10.1038/nchembio.684. [DOI] [PMC free article] [PubMed] [Google Scholar]
- 112.Kersten RD, Ziemert N, Gonzalez DJ, Duggan BM, Nizet V, Dorrestein PC, Moore BS. Proc Natl Acad Sci U S A. 2013;110:E4407–4416. doi: 10.1073/pnas.1315492110. [DOI] [PMC free article] [PubMed] [Google Scholar]
- 113.http://www.acdlabs.com/products/enterprise/automation/
- 114.http://www.bruker.com/products/mass-spectrometry-and-separations/software.html
- 115.Bandeira N, Olsen JV, Mann JV, Mann M, Pevzner PA. Bioinformatics. 2008;24:i416–i423. doi: 10.1093/bioinformatics/btn184. [DOI] [PMC free article] [PubMed] [Google Scholar]
- 116.Kasper PT, Rojas-Cherto M, Mistrik R, Reijmers T, Hankemeier T, Vreeken RJ. Rapid Commun Mass Spectrom. 2012;26:2275–2286. doi: 10.1002/rcm.6340. [DOI] [PMC free article] [PubMed] [Google Scholar]
- 117.Hanssen KO, Schuler B, Williams AJ, Demissie TB, Hansen E, Andersen JH, Svenson J, Blinov K, Repisky M, Mohn F, Meyer G, Svendsen JS, Ruud K, Elyashberg M, Gross L, Jaspars M, Isaksson J. Angew Chem Int Ed. 2012;51:12238–12241. doi: 10.1002/anie.201203960. [DOI] [PubMed] [Google Scholar]