

ABSTRACT
Transcription start sites (TSSs) lying inside annotated genes, on the same or opposite strand, have been observed in diverse bacteria, but the function of these unexpected transcripts is unclear. Here, we use the metal-reducing bacterium Shewanella oneidensis MR-1 and its relatives to study the evolutionary conservation of unexpected TSSs. Using high-resolution tiling microarrays and 5′-end RNA sequencing, we identified 2,531 TSSs in S. oneidensis MR-1, of which 18% were located inside coding sequences (CDSs). Comparative transcriptome analysis with seven additional Shewanella species revealed that the majority (76%) of the TSSs within the upstream regions of annotated genes (gTSSs) were conserved. Thirty percent of the TSSs that were inside genes and on the sense strand (iTSSs) were also conserved. Sequence analysis around these iTSSs showed conserved promoter motifs, suggesting that many iTSS are under purifying selection. Furthermore, conserved iTSSs are enriched for regulatory motifs, suggesting that they are regulated, and they tend to eliminate polar effects, which confirms that they are functional. In contrast, the transcription of antisense TSSs located inside CDSs (aTSSs) was significantly less likely to be conserved (22%). However, aTSSs whose transcription was conserved often have conserved promoter motifs and drive the expression of nearby genes. Overall, our findings demonstrate that some internal TSSs are conserved and drive protein expression despite their unusual locations, but the majority are not conserved and may reflect noisy initiation of transcription rather than a biological function.
IMPORTANCE
The first step of gene expression is the initiation of transcription from promoters, which have been traditionally thought to be located upstream of genes. Recently, studies showed that in diverse bacteria, promoters are often located inside genes. It has not been clear if these unexpected promoters are important to the organism or if they result from transcriptional noise. Here, we identify and examine promoters in eight related bacterial species. Promoters that lie within genes on the sense strand are often conserved as locations and in their sequences. Furthermore, these promoters often affect the bacterium’s growth. Thus, many of these unexpected promoters are likely functional. Fewer promoters that lie within genes on the antisense strand are conserved, but the conserved ones seem to drive the expression of nearby genes.
INTRODUCTION
Prokaryotic transcription is not simple. With the development of microarrays and next-generation sequencing technologies, the transcriptomes of many bacteria have been characterized (1–4), and transcription start sites (TSSs) have been determined at single-nucleotide resolution (5–7). These studies have unveiled surprisingly complex transcriptional architectures, including dynamic operon structures that vary across growth conditions or cell states, a wealth of small RNAs, internal promoters, and antisense transcripts (8). A key challenge in microbiology is to elucidate the functions of these unexpected transcripts in bacteria.
Previous studies found that antisense transcription was as common in bacteria as in eukaryotes and archaea. In a few well-studied cases, antisense RNAs (asRNAs) were shown to serve important regulatory roles in mRNA stability, transcription, or translation (9, 10). In Gram-positive bacteria, pervasive antisense transcription was suggested to drive mRNA processing by RNase III because of a correlation between the abundance of the short RNAs on the sense and antisense strands, but such a correlation was not observed for Gram-negative bacteria (11). Recently, Lybecker and colleagues suggested that RNase III is involved in double-stranded RNA (dsRNA) processing in Escherichia coli and they experimentally identified over 300 RNase III-dependent dsRNA-forming asRNAs (12), but the impact of these asRNAs on gene expression is unknown. Assessing the functional significance of asRNAs in diverse bacterial lineages requires further investigation.
TSSs have also been observed in the sense orientation inside known coding sequences. In archaea, these internal TSSs reflect alternative promoters within operons and coding sequences, often with detectable transcription factor-binding sites (13, 14). These internal TSSs have also been found in bacterial species and were suggested to be the TSSs of the downstream genes, to yield short or truncated transcripts, or to be due to incorrect start codon annotations (2, 5). However, the evolutionary conservation and functional significance of these internal TSSs have not been confirmed.
TSSs have also been observed within intergenic regions far from a predicted coding sequence. Many of these intergenic TSSs without a clearly associated CDS encode small noncoding RNAs (ncRNAs), as demonstrated for various bacteria species (1, 2, 5). Given their widespread existence, deeper exploration of ncRNAs in more bacteria lineages will enrich our understanding of ncRNA regulation and function.
Because natural selection maintains functional elements during evolution, comparative analysis provides a powerful approach to examine genome functionality. Recently, it has been reported that antisense transcripts are not conserved between E. coli and Salmonella enterica, which implies that many of these transcripts are nonfunctional (15). In contrast, other comparative studies between different Listeria species (16) and among Campylobacter jejuni strains (17) found a larger proportion of the identified antisense transcripts to be conserved. Many ncRNAs are also conserved across multiple species (18), while some others show great divergence (16). As a step further, Dugar and colleagues took advantage of the comparative information to facilitate TSS annotation, and they found that single nucleotide polymorphisms in the promoter region may lead to strain-specific promoter usage (17).
In this study, we used comparative transcriptomics and the evolutionary conservation of TSSs within a bacterial genus to assess the functional significance of unexpected transcription. We focused on the Gram-negative genus Shewanella, which is of special interest due to the versatile usage of terminal electron acceptors during respiration (19). Like E. coli, Shewanella spp. are facultative anaerobes, but they can also transfer electrons to both soluble and solid metals. As such, Shewanella has been used as a model genus to investigate the reduction of metals and for the potential to bioremediate toxic metals. The 4.97-Mb genome of the best-studied species of the genus, Shewanella oneidensis MR-1, was sequenced in 2002 (20). Genome-wide transcriptome analyses have been described for S. oneidensis MR-1 under various growth conditions (21, 22). However, global transcriptomic characterization at single-nucleotide resolution has yet to be described for Shewanella.
Here, we compared different categories of TSSs in S. oneidensis MR-1 and seven additional species of the Shewanella genus. We found that TSSs within genes were sometimes conserved among Shewanella species, although internal antisense TSSs (aTSSs) were significantly less likely to be conserved than internal TSSs on the sense strand (iTSSs). Furthermore, conserved TSSs within genes have conserved promoter sequences, which implies that they have functional roles. In addition to conserved promoter sequences, we found in the data regarding mutant fitness that iTSSs are regulated and eliminate polar effects, which confirms that these iTSSs are functional. Tiling microarray data suggest that conserved aTSSs often drive the expression of nearby genes on the other strand. Nevertheless, our results demonstrate that most antisense transcripts are nonadaptive by-products of the cellular transcription machinery, as previously reported for the fellow Gram-negative bacterium E. coli (15).
RESULTS AND DISCUSSION
The transcriptome and TSS map of Shewanella oneidensis MR-1.
We used a strand-specific tiling microarray and 5′-end RNA sequencing (5′ RNA-seq) (1, 23) to generate a high-resolution transcriptome structure map for S. oneidensis MR-1. In 5′ RNA-seq, a unique RNA adaptor is ligated to the 5′ ends of RNAs prior to reverse transcription, so that the 5′ ends of transcripts are identified at single-nucleotide precision (1, 23, 24). We collected tiling microarray data from five diverse growth conditions, which were chosen to detect the transcription of most genes from a small set of experiments: Luria-Bertani broth (rich medium), defined medium with lactate as the carbon source (minimal), anaerobic growth with dimethyl sulfoxide (DMSO) or Fe(III) as the electron acceptor, and heat shock. To identify TSSs at nucleotide resolution, we also collected 5′ RNA-seq data for two experiments in each of rich and minimal media. Figure 1A illustrates the tiling and 5′ RNA-seq data for a 2-kb region of the main chromosome (see Table S1 in the supplemental material for a summary of all 5′ RNA-seq libraries).
FIG 1 .

Transcriptome data and promoter motifs of Shewanella oneidensis MR-1. (A) Transcriptome data for the positions between nt 5500 and 7500 on the main chromosome. The top five panels show the normalized log2 intensities from tiling microarrays for LB broth (rich), aerobic growth in a defined minimal medium (minimal), anaerobic growth in a defined medium with either DMSO or ferric citrate [Fe(III)] as the electron acceptor, or post-heat shock (HS). The bottom four panels show the numbers of reads whose beginnings mapped to each position from 5′ RNA-seq analysis for two experiments in LB broth (Rich1 and Rich2) and two experiments for aerobic growth in a defined minimal medium (Minimal1 and Minimal2). High-confidence TSSs are circled. The bottom panel shows the gene annotation. (B to D) Three promoter motifs were determined from 1,127 preliminary TSSs by using MEME (42), and these motifs represent the binding motifs of sigma factors RpoD (σ70) (B), RpoN (σ54) (C), and FliA (σ28) (D).
With 5′ RNA-seq data, peaks can be the result of genuine TSSs or degradation products, as illustrated in Fig. 1A. As described below, we used both the tiling microarray data and promoter motifs to distinguish between these two possibilities. To identify these promoter motifs in an unbiased manner, we first identified an initial set of TSSs by using only the rises in the tiling data and the peaks in the 5′ RNA-seq data (see Materials and Methods). Using these features, we identified a preliminary set of 1,127 potential TSSs; these had a median of 562 reads in the 5′ RNA-seq data from minimal media library 1. These TSSs featured three major promoter motifs (Fig. 1B to D) that were nearly identical to the known motifs for RpoD (σ70), RpoN (σ54), and FliA (σ28) in E. coli, which is a gammaproteobacterium like S. oneidensis MR-1. The major σ70 motif represented over 70% of the potential TSSs. Seven other sigma factors have also been annotated for S. oneidensis MR-1, including three (σ24, σ32, and σ38) that have been characterized (25). σ38 (σS) sites are similar to σ70 sites (26) and may be included within the promoters with σ70-binding motifs. Among 12 predicted σ32-dependent promoters in S. oneidensis MR-1 (22), we observed 5′ RNA-seq reads at the expected locations for all of them, with a median of 558.5 reads in 5′ RNA-seq minimal media library 1. We also examined the six putative binding sites for σ24 (25) and found that five are supported by the 5′ RNA-seq data (median 464 reads in minimal media library 1). Both σ24 (σE) and σ32 are involved in the heat shock response (22, 25), for which we did not generate 5′ RNA-seq data. However, it seems that both σ24 and σ32 have some activity during growth in minimal media.
To systematically identify S. oneidensis MR-1 TSSs with high confidence, we used a semisupervised machine learning approach (23). Using the tiling microarray data, the combined 5′ RNA-seq data from all four experiments, and the σ70 promoter motif identified above, we predicted 6,088 putative TSSs with a false discovery rate (FDR) of less than 1% (see Materials and Methods for details). Lowering the decision cutoffs increases the number of putative TSSs, but this will also increase the FDR (see Fig. S1 in the supplemental material). We found that 82% of the identified TSSs have at least one additional, closely located TSS within 1 to 2 nucleotides (nt). Such “relaxed” TSSs from the same promoters have also been seen in other studies (7, 27) and may represent the imprecise transcriptional activity of RNA polymerase from the same promoter. To avoid redundant calling of the same promoter, we selected only the positions with highest log-odds scores within a 50-nucleotide region. This additional filtering resulted in a conservative set of 2,531 high-confidence TSSs from the original list of 6,088 predictions.
We classified all 2,531 S. oneidensis MR-1 TSSs into four categories based on their locations relative to the computationally predicted gene annotations in S. oneidensis MR-1 (Fig. 2A) (5). We found that 1,831 (72%) of the high-confidence TSSs were located within 200 nt upstream of an annotated start codon (gTSS). The remainder of the identified TSSs were further categorized into 307 iTSSs, 148 aTSSs, and 245 nontranscribed TSSs (nTSSs) (i.e., sites located inside [iTSS] or on the opposite strand [aTSS] of annotated genes or in the intergenic regions [nTSSs]) (Fig. 2B; see also Data Set S1 in the supplemental material for the full list of high-confidence S. oneidensis MR-1 TSSs).
FIG 2 .
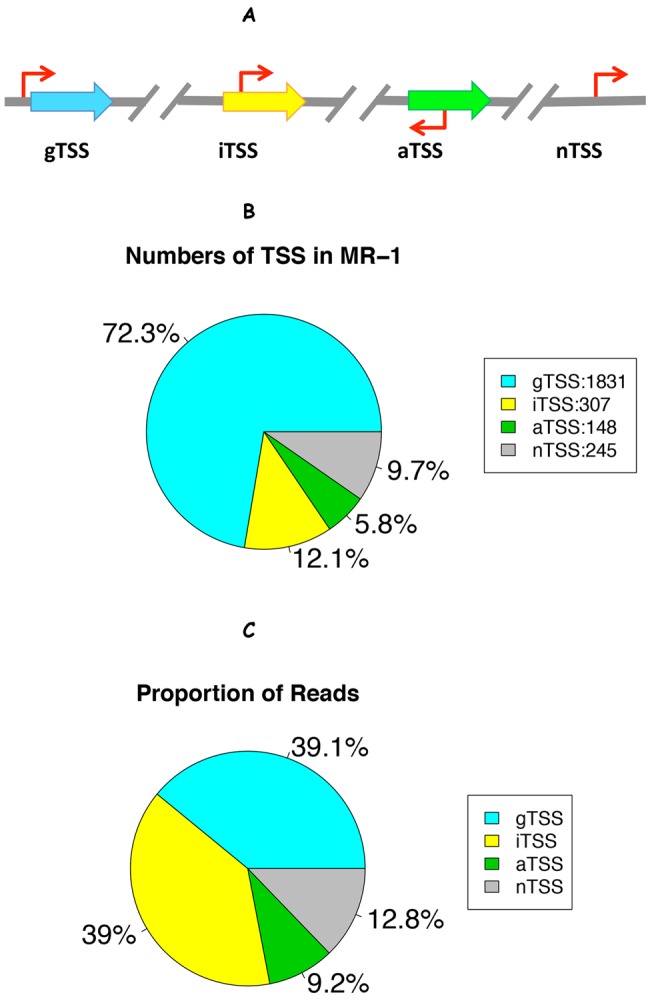
Categorization of Shewanella oneidensis MR-1 TSSs. (A) Schematic illustration of TSS categorization (5): gTSS, within 200-nt regions upstream of an annotated gene; iTSS, inside an annotated gene and on the same strand; aTSS, inside an annotated gene but on the antisense strand; nTSS, in intergenic region and over 200 nt upstream of any annotated gene. (B) The number of high-confidence TSSs (out of 2,531) in each category. (C) The proportion of the total number of 5′ RNA-seq reads whose starts aligned to each category regardless of whether the position was a high-confidence TSS or not (data from minimal medium experiment II).
Reliability of the data and TSS identification.
To test the reliability of our data and the 2,531 high-confidence TSSs we identified for S. oneidensis MR-1, we examined a number of data quality metrics and directly compared our results to those obtained from differential RNA sequencing (dRNA-seq), which identifies primary 5′ ends by comparing a library made from untreated total RNA to a library made from RNA that is enriched for primary transcripts (2). To test the reproducibility of our tiling data, we first calculated the overall correlation of the data for rich and minimal media and found that these data were highly correlated (R = 0.90) across all 2.1 million probes. As a second test of the tiling data, we examined the data consistency between probes of the same gene and found that the log2 intensities of adjacent probes in one experiment were also highly correlated (e.g., R = 0.98 for minimal medium). Similar to the tiling data, the counts from 5′ RNA-seq were also highly reproducible between different data sets and different growth conditions (R = 0.73 for two rich medium experiments). In addition, our tiling microarray and 5′ RNA-seq data also showed a high positive correlation between the predicted expression levels for annotated genes (R = 0.59, correlation between the average normalized log2 intensity across each gene in the tiling data and the total number of reads from 5′ RNA-seq within 200 nt upstream of that gene). Taken together, these results demonstrated that our 5′ RNA-seq and tiling microarray data are internally consistent and thus represent genuine transcriptional activities.
To systematically identify noise in the 5′ RNA-seq data, we first counted the proportion of total reads that mapped to each of the four TSS classes (Fig. 2A), regardless of the above identification of high-confidence TSSs (Fig. 2C). The internal TSSs on the sense strand accounted for a higher proportion of the total 5′ RNA-seq reads (39%) than did the high-confidence subset (12%). In other words, many low-confidence peaks were located within protein-coding genes on the sense strand. These low-confidence peaks might come from RNA degradation products, weak transcription start sites, or experimental noise. The high proportion of internal TSSs in the raw mapping results favors the explanation of RNA degradation (Fig. 2C), even though we used terminator 5′-P-dependent exonuclease to degrade transcripts with monophosphate 5′ ends in all 5′ RNA-seq experiments (see Materials and Methods).
Despite the noise in the 5′ RNA-seq data, by combining these data with tiling microarrays and focusing on the TSSs identified with stringent selection criteria (FDR < 1%), we believe that the vast majority of our high-confidence TSSs represent bona fide transcription initiation positions and not experimental artifacts. Four lines of evidence support the reliability of our S. oneidensis MR-1 TSS predictions. First, sequence analysis of the −50 to +10 region around the TSSs revealed enrichment for A·T at positions in the promoter sequence, particularly at the −35 and −10 sites (Fig. 3A), a preference for a purine (A·G) at the +1 site, and a preference for a pyrimidine (C·T) at the −1 site (Fig. 3B). These key transcriptional features are consistent with findings for E. coli (28) and serve as a validation of our identified TSSs in S. oneidensis MR-1. Interestingly, we noticed that A·T was enriched approximately every 10 to 11 bp (Fig. 3), corresponding to the number of nucleotides per turn of DNA. This periodic AT-rich pattern has also been observed in other bacterial species (2, 29) and is thought to enhance DNA curvature and facilitate transcription initiation (30).
FIG 3 .

Sequence characteristics of high-confidence Shewanella oneidensis MR-1 TSSs. (A) Base composition of the 400-nt sequence around high-confidence TSSs, with the TSS at position 0. The shading shows −35 and −10 regions. (B) Sequence logo (44) for the −50/+10 region around the motif-naive TSSs.
Second, our identified S. oneidensis MR-1 TSSs are often associated with a σ70 motif. To avoid circularity in our analysis (because the original, high-confidence TSS set included the σ70 motif in the prediction classifier), we identified 2,196 “motif-naive” S. oneidensis MR-1 TSSs by using only the tiling microarray and 5′ RNA-seq data (see Materials and Methods). For the majority of the motif-naive predicted internal TSSs (52.8% of iTSSs and 53.1% of aTSSs), we observed a significant σ70-like promoter motif (bit score > 5). The percentage of motif-naive predicted gTSSs that met the same σ70 bit score threshold was only moderately higher (67.5%) than for the iTSSs and aTSSs, which suggests that most of these internal TSSs represent genuine promoters.
Third, the S. oneidensis MR-1 TSSs identified in previous studies by lower-throughput methods, such as random amplification of 5′ cDNA ends or primer extension, are consistent with our results (see Table S2 in the supplemental material). We identified TSSs at the exact same positions as previously reported for four different genes, including one (torR) with a TSS with a log-odds slightly lower than our cutoff (8.12 instead of 10). Since this work was focused on the TSSs at unexpected locations, we are more concerned about the specificity of our TSS identification. Therefore, we preferred to use a stringent cutoff for most of our analyses (see Fig. S1 in the supplemental material). For six other genes with reported TSSs, five of them were characterized under conditions for which we do not have 5′ RNA-seq data and are poorly expressed in rich and minimal media. The sixth gene (mxdA) was found in our 5′ RNA-seq data, and we detected a high-confidence TSS 34 nt upstream relative to the previously reported position (see Table S2 in the supplemental material for details).
Last, we compared our high-confidence set of 2,531 S. oneidensis MR-1 TSSs with dRNA-seq data, as dRNA-seq discriminates primary and processed 5′ ends by analyzing cDNA libraries made with two different RNA samples: one treated with terminator exonuclease (TEX[+]) and the other not treated (TEX[−]) (2). Degraded (processed) transcripts with a 5′-monophosphate are expected to be depleted in the TEX[+] sample, leaving the primary transcripts with 5′-triphosphate ends unaffected. Therefore, with dRNA-seq, authentic TSSs are expected to be enriched in the TEX[+] sample relative to the TEX[−] sample. The preparation of the 5′ RNA-seq libraries described above was the same as for the dRNA-seq TEX[+] library, except that 5′ RNA-seq had an extra step to deplete rRNAs from total RNA prior to TEX treatment. We performed dRNA-seq on S. oneidensis MR-1 cultures grown in both rich and minimal media and calculated the log ratio as the difference between the TEX[+] and TEX[−] libraries. Sites that are enriched in the TEX[+] library will have a positive log ratio, and sites that are depleted in the TEX[+] library will have a negative log ratio. Only dRNA-seq reads mapping to the exact same location as the high-confidence TSSs were considered. We found that high-confidence TSSs of all classes (gTSSs, iTSSs, aTSSs, and nTSSs) tended to have significantly more mapped reads in the TEX[+] sample than the TEX[−] sample (P < 0.05, Kolmogorov-Smirnov test for high-confidence versus other TSSs) (see Fig. S2 in the supplemental material). Overall, our dRNA-seq results support the validity of our predictions for all classes of TSSs. Nevertheless, we noticed that 15% of our identified TSSs showed enrichment of reads from the TEX[−] library (2-fold difference in normalized number of mapped reads in the TEX[−] library relative to the TEX[+] library), contrary to the expectation for true TSSs. However, most (88%) of these TEX[−]-enriched TSSs were gTSSs, not unexpected TSSs. These TEX[−] TSSs had about as many 5′ RNA-seq reads as did TSSs that were enriched for reads from the TEX[+] library (P > 0.05, Student’s t test), and manual examination of the tiling microarray data suggests that these TEX[−]-enriched TSSs are genuine. Moreover, the σ70-binding sites for the TEX[−]-enriched TSSs are about as strong as for the TEX[+]-enriched TSSs (both groups have a median bit score of 5.4), which also implies that these TEX[−]-enriched TSSs are genuine primary transcription sites and not the ends of processed RNAs. One potential mechanism for the enrichment of genuine TSSs in the TEX[−] sample is via the native exonuclease activity of SO_1331, an ortholog of E. coli RppH. RppH is a pyrophosphohydrolase that rapidly dephosphorylates the 5′ end of nascent transcripts, and it may contribute to the generation of false negatives in dRNA-seq data sets (31). Thus, although we used the dRNA-seq data to validate our S. oneidensis MR-1 TSSs, we did not use these data to identify high-confidence TSSs.
Comparative transcription start sites of eight Shewanella species.
To assess the conservation of the 2,531 S. oneidensis MR-1 TSSs, we collected 5′ RNA-seq data from seven additional Shewanella species grown in rich and minimal media (Fig. 4A). The evolutionary distance between S. oneidensis MR-1 and the other species varied between 0.01 and 0.14 amino acid substitutions per site for highly conserved proteins (Fig. 4A and B) (32). For comparison, the distance between Escherichia coli and Salmonella enterica is 0.04 (32). For each of the seven additional Shewanella species, we summed the number of reads from the rich and minimal medium experiments. To validate the 5′ RNA-seq data, we selected strong TSSs with at least 250 mapped reads, and we identified a very similar σ70-binding motif for all eight Shewanella species (Fig. 4C).
FIG 4 .

Transcriptome comparison within the Shewanella genus. (A) Species tree from MicrobesOnline (32) and derived from concatenated alignments of highly conserved proteins. (B) Bar plot illustrating the proportion of the TSSs that are conserved (dark gray) and the evolutionary distance (number of substitutions per site among 80 conserved proteins) between S. oneidensis MR-1 and the other Shewanella species (light gray). (C) The major promoter motif of sigma factor RpoD (σ70), determined by using MEME for each Shewanella species. (D) 5′ RNA-seq data from the other seven Shewanella species grown aerobically in rich media, mapped onto the S. oneidensis MR-1 genome. The data from defined minimal medium experiments were similar and are not shown here.
We built pairwise genome alignments between S. oneidensis MR-1 and the other seven Shewanella species by using MAUVE (see Materials and Methods), and we mapped the identified TSSs for each species onto the corresponding positions of S. oneidensis MR-1 (Fig. 4D). We counted the proportion of our identified S. oneidensis MR-1 TSSs that were also observed in the other Shewanella species. We found a strong negative correlation between the TSS conservation percentage and evolutionary distance (Fig. 4B) (R = −0.95), demonstrating a near-linear decay in TSS conservation as a function of evolutionary rate within the Shewanella genus.
Conservation of different types of TSSs.
We defined the transcription of a given S. oneidensis MR-1 TSS as “conserved” if at least 50 total 5′ RNA-seq reads (summing the data from rich and minimal conditions) were observed in at least three additional Shewanella species. This cutoff was chosen such that shuffled data would show a conservation rate under 5% (see Fig. S1B in the supplemental material). Based on this criterion, we found that 63% (1,594 of 2,531) of S. oneidensis MR-1 TSSs were conserved within the Shewanella genus.
Next, we investigated whether the different classes of S. oneidensis MR-1 TSSs were more or less likely to be conserved within the Shewanella genus. Functional TSSs, such as those driving the expression of protein-coding genes, should be under negative (purifying) selection across related species. Indeed, we found that gTSSs showed the highest conservation level (76%) across the Shewanella genus (Fig. 5). Moreover, iTSSs and nTSSs were often conserved (30% and 34%), whereas aTSSs were less likely to be conserved (22%) relative to all the other TSS classes (Fig. 5). The proportion of aTSSs that were conserved was significantly lower than for iTSSs (P < 0.05, Fisher’s exact test). Even with relaxed criteria for selecting S. oneidensis MR-1 TSSs, gTSSs were the most conserved and aTSSs were the least conserved (see Table S3 in the supplemental material). For example, if we lowered the cutoff log-odds value for selecting S. oneidensis MR-1 TSSs from 10 to 6 (FDR < 5%), the conserved proportions become 61%, 16%, 14%, and 7% for gTSSs, nTSSs, iTSSs, and aTSSs, respectively.
FIG 5 .
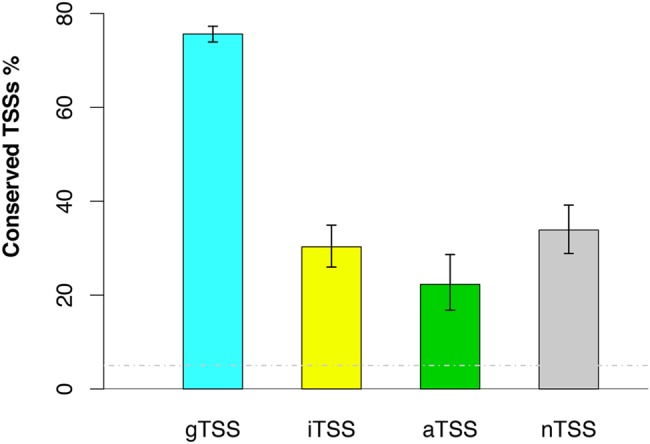
TSSs conservation across eight Shewanella species, as illustrated by the percentages of high-confidence TSSs from S. oneidensis MR-1 that are conserved in other species. The false-positive rate (<5%) was estimated by using shuffled data and is represented as a gray dashed line. Error bars represent 90% confidence intervals.
To test whether the promoters of conserved TSSs were under purifying selection, we examined the sequence conservation at each nucleotide in the promoter regions. The −35 and −10 elements of a typical promoter serve as recognition sites for RNA polymerase and are thus highly conserved compared with other regions (33), as can be seen for gTSS and nTSS (Fig. 6A and B). To avoid circularity in this analysis, we used the set of 2,196 motif-naive S. oneidensis MR-1 TSSs described previously. Given that the conservation of amino acid sequences would bias the conservation of the promoter sequences of iTSSs and aTSSs, we examined only the 4-fold degenerate wobble positions of codons for these two classes of TSSs. To quantify the differences between the conserved sites and divergent sites, we selected the positions that showed high conservation in the major promoter motif σ70 (Fig. 1B) as group C (marked in red in Fig. 6) and the variable positions as group V (marked in blue in Fig. 6). We compared the sequence conservation levels between these two groups of sites and found that both gTSSs and nTSSs showed significant differences (P < 10−15, Student’s t test) (Fig. 6A and B). Using the 4-fold-degenerate wobble positions to assess sequence conservation within protein-coding genes, we found that the promoter sequences for iTSSs were significantly conserved (P < 10−8, Student’s t test) (Fig. 6C). The promoters of conserved aTSSs were also conserved, although to a lesser extent than the other three TSS classes (P < 0.01, Student’s t test) (Fig. 6D). Furthermore, we did not observe significant differences in the conservation levels between variable and conserved positions among TSS classes (gTSS, 0.18; iTSS, 0.19; aTSS, 0.14; nTSS, 0.15; P > 0.05 between any two classes by Student’s t test). These results demonstrated that the promoters of conserved TSSs tend to be under purifying selection regardless of their position relative to genes, although there was a significant difference in transcription conservation among the four classes of TSSs (Fig. 5).
FIG 6 .

Promoter sequence conservation of conserved TSSs. The sequence conservation level is the fraction of the other seven Shewanella species that keep the same base as S. oneidensis MR-1, for each position of the −50/+10 region of TSSs. The red squares highlight the conservation levels of the conserved sites (C) and the blue triangles are for the variable sites (V), as determined from the major promoter motif identified by MEME. (A) TSSs for annotated genes (gTSS); (B) intergenic TSSs (nTSSs); (C) sense internal TSSs (iTSSs); (D) antisense internal TSSs (aTSSs). For panels C and D, only 4-fold-degenerate codon positions were used. Error bars represent 90% confidence intervals.
An alternative explanation for the conserved TSSs within genes is that the promoter sequences are constrained due to other factors, such as constrained codon usage. In this view, the spurious promoters will not be removed by mutation and will appear conserved. We saw indirect evidence supporting this hypothesis: Shewanella core genes (those present in at least 6 of 7 non-MR-1 Shewanella species used in this study) with conserved iTSSs were more highly expressed (median 3.7 versus 2.6, as average normalized log2 intensity from tiling microarray for LB; P < 10−8, Wilcoxon rank sum test) and had a lower synonymous substitution rate (dS; median 2.2 versus 2.7; P < 0.001). However, if this hypothesis were true, then we would expect the internal TSSs on the sense (iTSSs) or antisense (aTSSs) strand to be affected equally. In contrast, we found that the conservation level of aTSSs was significantly lower than that of iTSSs (Fig. 5). Moreover, this hypothesis cannot explain the fact that the −35 and −10 sites are significantly more conserved than the nearby regions for the iTSSs. Therefore, we favor the interpretation that the majority of the conserved iTSSs represent functional promoters rather than evolutionary by-products.
Functionality of unexpected TSSs. (i) Conserved TSSs within genes on the sense strand (iTSS) are functional.
The conservation of S. oneidensis MR-1 iTSSs in other Shewanella species (Fig. 5) suggests that these iTSSs may be maintained for functional reasons. To examine this possibility, we first asked whether the iTSSs are under regulation in S. oneidensis MR-1, with the expectation that conserved transcripts that have evolved with regulation are likely functional. To address this question, we estimated the expression due to iTSSs by comparing the average expression levels of the gene(s) upstream and downstream of the iTSSs from microarray expression data (34). To avoid cases where a probe partially overlaps with cDNA and may not be well hybridized, we used the probes located inside the gene and at least 20 nt away from an iTSS. We found that the expression due to conserved iTSSs was more variable than that for the nonconserved iTSSs (P < 0.01, Kolmogorov-Smirnov test; P < 0.001, Wilcoxon rank sum test) (Fig. 7A), suggesting that some of these conserved iTSSs were regulated under different growth conditions. Additionally, we looked at the enrichment of transcription factor-binding motifs from RegPrecise (35) for each class of conserved TSSs. All classes except for aTSSs showed enrichment for regulatory sites (Fig. 7B). The large error bars for iTSSs and nTSSs are due to a large proportion of these TSSs not having a predicted regulatory motif (Fig. 7B). Taken together, these data suggest that a significant fraction of conserved iTSSs in S. oneidensis MR-1 are regulated and functional.
FIG 7 .
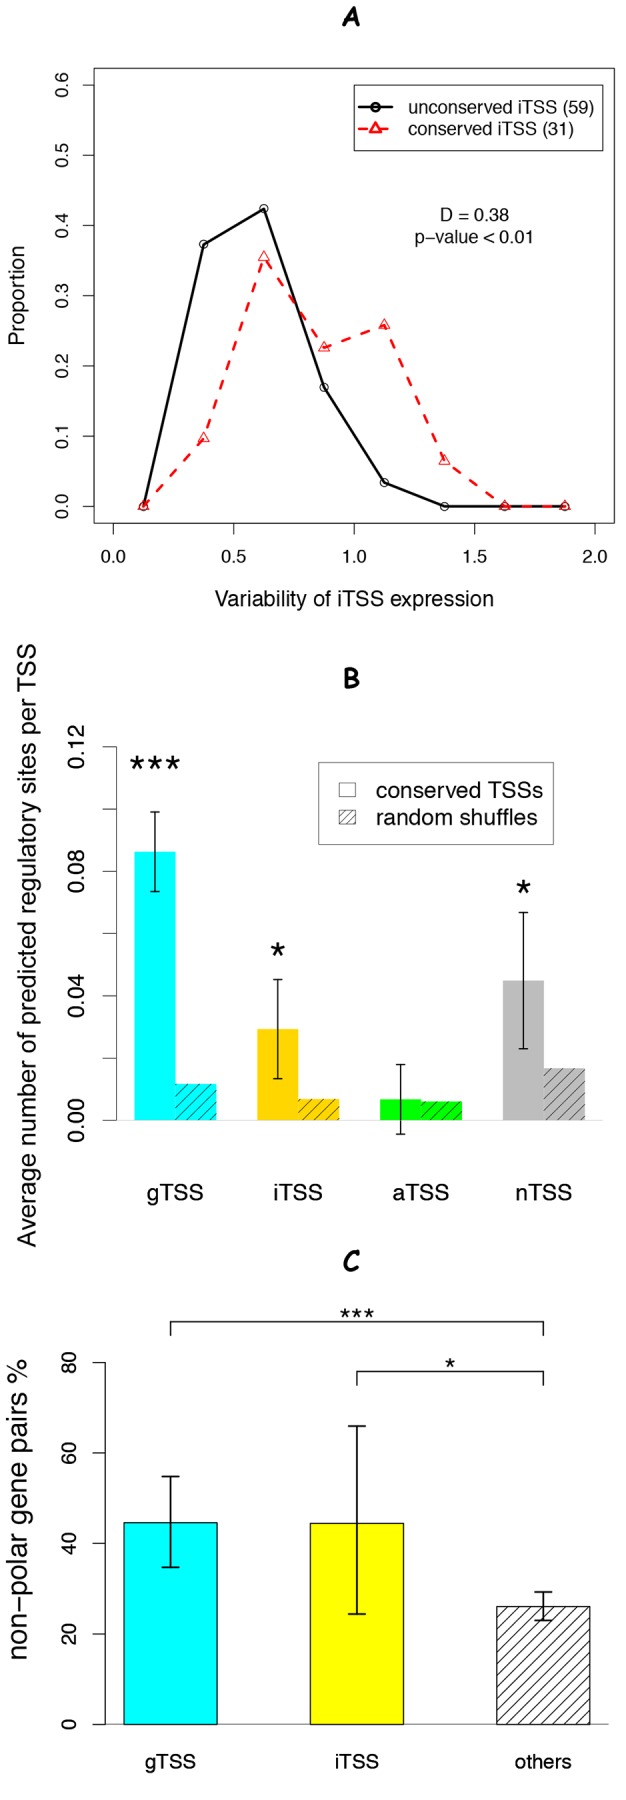
Evidence that conserved sense internal TSSs (iTSSs) are functional. (A) The distribution of the standard deviations of expression due to iTSSs across 74 conditions, as estimated from the difference between gene expression downstream and upstream of a particular iTSS. (B) The average number of predicted regulatory sites within the −50/+10 region of each group. We extracted the position weight matrixes of nine regulatory factors (ArgR, Crp, Fnr, FUR, HexR, LexA, NarP, PsrA, and TyrR) from RegPrecise (35) and scanned for hits with eight or more bits. The significance of the difference from randomly shuffled sequences was estimated by using a paired Student’s t test. (C) The percentage of operon gene pairs that lacked polar effects (upstream gene fitness greater than −0.5 and downstream gene fitness less than −1.5) in at least one experiment for mutant fitness (34). The difference between pairs with internal gTSSs, pairs with iTSSs, or other pairs was tested by using Fisher’s exact test. Error bars indicate 90% confidence intervals. *, P < 0.05; ***, P < 0.001.
Next, we examined whether these conserved iTSSs eliminate polar effects in data for transposon mutant fitness. A polar effect is expected when the transcription of the upstream gene is interrupted (i.e., by a transposon) and the expression of the downstream gene is affected. However, an alternative TSS that exists between the interruption site and the start of the downstream gene may eliminate polar effects under certain conditions. To ensure that enough gene pairs were associated with conserved iTSSs for this analysis, we used lower cutoff values to identify S. oneidensis MR-1 TSSs (log-odds ≥ 6; FDR < 5%) (see Table S3 in the supplemental material). With these relaxed selection criteria, we identified 6,219 S. oneidensis MR-1 TSSs, of which 2,174 were conserved in at least three other Shewanella species. Taking advantage of genome-wide data on mutant fitness for S. oneidensis MR-1 across more than 100 conditions (34), we found that the presence of a conserved iTSS within an upstream gene significantly decreased the occurrence of polar effects (P < 0.05, Fisher’s exact test) (Fig. 7C). The same alleviation of polar effects was observed for operon pairs with an additional gTSS for the downstream genes (P < 0.001, Fisher’s exact test). These two classes differed with regard to whether the TSS locates within the upstream gene (classified as an iTSS) or in the intergenic regions between the two adjacent genes (classified as a gTSS). Indeed, both groups showed significant enrichment of nonpolarity relative to the remaining gene pairs (P < 0.05, Wilcoxon test) (Fig. 7C), demonstrating that a fraction of the conserved iTSSs, as well as the gTSSs that are inside the operons, drive physiologically relevant expression of downstream genes.
To gain further insight into the putative function of the 93 high-confidence, conserved S. oneidensis MR-1 iTSSs, we manually examined these transcriptional start sites in the context of the existing gene models and tiling microarray data. We observed that many of the conserved iTSSs tend to locate near the start or end of annotated genes: 41 (44%) are located inside the last one-third of genes and another 17 (18%) are located inside the first 1/10 of the genes. In contrast, the nonconserved iTSSs were more uniformly distributed within the annotated genes (30% and 15%, respectively; P < 0.05 for both sides, Pearson’s chi-square proportion test). By examining the tiling microarray data, we found that these conserved iTSSs could be explained as real primary TSSs in three ways. First, we found that 25 of the conserved iTSSs, including 17 located within the last one-third of the annotated genes, are likely promoters for downstream genes (Fig. S3A). Second, three iTSSs (all located within the first 1/10 of the annotated genes) are likely due to incorrect annotations of the start codons (SO_2365, SO_3635, SO_3936). Another three conserved iTSSs are putative TSSs for recently annotated sRNAs (rnpB, SO_m028, SO_m006; GenBank AE014299.2), whose annotated starts are just upstream of the TSS (1 nt, 4 nt, and 14 nt, respectively). Altogether, these six iTSSs are probably the primary promoters for these genes. Beyond these explainable cases, eight iTSSs (including six that are close to the 3′ end) appear to produce short transcripts with unknown function (Fig. S3B). All eight of these iTSSs are upstream of potential in-frame start codons but the resulting polypeptides would not contain an entire annotated domain, and so we doubt that these iTSSs produce functional proteins. For the majority of the remaining conserved iTSSs (52 of 54), the gene in which they are located had a stronger primary gTSS upstream of the start codon. Examination of the tiling data revealed that 11 of these iTSSs appeared to produce long transcripts and could be secondary or alternative promoters that drive the production of short forms of proteins, as observed for CheA in E. coli (36). Alternatively, many of these iTSSs could reflect conserved transcriptional noise, as constraints imposed by their function as protein-coding sequences could preserve promoter-like sites.
(ii) Function of conserved aTSSs.
Although aTSSs are less conserved as a group relative to the other three classes of TSSs (Fig. 5), 22% of aTSSs were conserved and the promoter sequences of these conserved aTSSs were under purifying selection (Fig. 6D). Through examination of the tiling microarray data, we found that 91% (30 of 33) of conserved aTSSs drove expression of divergently transcribed genes (see Fig. S3C in the supplemental material), which was significantly more often than for nonconserved aTSSs (18%; P < 10−13, Fisher’s exact test). Given the typical lengths of 5′-untranslated regions (UTRs; median of 52 nt), those aTSSs that drive the expression of the adjacent genes should be close to the 5′ ends of genes within which that they are located. Indeed, we observed an enrichment of the conserved aTSSs at the 5′ ends of the genes: 21 (64%) were located inside the first one-third of genes (compared to 16% for the nonconserved aTSSs; P < 0.001, Pearson’s chi-square proportion test). This suggests that although identified aTSSs are less likely to be conserved than the other TSS classes (Fig. 5), those aTSSs that are conserved within the Shewanella genus are likely functional. In a few cases in bacteria, overlapping UTRs have been shown to act as antisense RNA and generate transcription interference on the overlapping genes (10). However, we did not detect significant negative correlations in expression levels among these divergently transcribed gene pairs with an aTSS driving one of them.
(iii) Lack of function of nonconserved aTSSs.
The transcription and promoter sequences of our detected aTSSs were significantly less conserved than the other three TSS classes (Fig. 5 and 6), indicating that most S. oneidensis MR-1 aTSSs are evolving neutrally. Our finding that aTSSs are less conserved is consistent with recent findings comparing antisense transcription between Escherichia coli and Salmonella enterica (15). Taken together, we propose that most antisense transcription in Gram-negative bacteria is nonfunctional and is produced by spurious promoter-like sequences. Because antisense transcription may be costly to the cell (37), it is usually assumed to perform a functional, physiological role in the cell. However, we found that the expression levels of even the high-confidence aTSSs were significantly lower than those of gTSSs (median total reads of 1,171 versus 2,488; P < 10−10, Wilcoxon rank sum test). This weak expression may result in weak evolutionary pressure against any one of these spurious promoters. Rho-dependent suppression of antisense transcription, as observed in E. coli (38), might contribute to the low expression level of aTSSs in Shewanella.
(iv) Function of conserved nTSSs.
Three lines of evidence suggest that many of the nTSSs have functional roles: (i) 34% of the nTSS have conserved transcription within the Shewanella genus (Fig. 5); (ii) their promoter sequences are conserved (Fig. 6B); (iii) their surrounding sequences are enriched for transcription factor-binding motifs (Fig. 7B). By analyzing the tiling microarray data, we found that 55% (46 of 83) of the conserved nTSSs were the starts of transcription for downstream genes with a long 5′-UTR, which were not classified as gTSSs due to the long distance (>200 nt) from the TSS to the start codon. Of the remaining conserved nTSSs, 31 mapped to short, unannotated expressed regions, including leader-like structures in 5′-UTRs and small RNAs in intergenic regions. Through manual inspection of the data, we identified 25 novel putative ncRNAs in S. oneidensis MR-1 with conserved nTSSs and another 27 with high-confidence but not conserved nTSSs (see Data Set S2 in the supplemental material). These ncRNAs do not include an additional 33 ncRNAs (20/33 have high-confidence TSSs) that were recently updated in the GenBank annotation (AE014299.2). The 25 putative ncRNAs with conserved nTSS all have a conserved nucleotide sequence across the Shewanella genus and all have a conserved secondary structure predicted by CMfinder (39) (see Data Set S2), which implies that these 25 putative ncRNAs are probably functional.
Summary.
In this study, we addressed the conservation and putative function of unexpected transcription within a bacterial genus. We generated high-resolution tiling microarray and 5′ RNA-seq data for Shewanella oneidensis MR-1 and identified 2,531 TSSs with high confidence. We classified these TSSs into four categories based on their genomic positions: gTSSs if associated with annotated genes, iTSSs if inside genes and on the sense strand, aTSSs if inside genes but on the antisense strand, or nTSSs if intergenic and not associated with any annotated genes. Comparison of TSSs among the eight Shewanella species demonstrated that the transcription of gTSSs and nTSSs is highly conserved. We found that 87 (30%) of the iTSSs are also conserved, and their promoter sequences tend to be under purifying selection. The tiling microarray data suggest that most of these conserved internal TSSs drive the expression of nearby genes. The functional importance of conserved iTSSs was further supported by the analysis of their expression variation, the enrichment of regulatory motifs, and the alleviation of polar effects in transposon mutants. In contrast to the other TSS classes, aTSSs were less likely to be conserved (22%), and we conclude that most aTSSs are likely the result of transcriptional noise. Overall, our findings provide insights into the prevalence and role of unexpected bacterial gene expression.
MATERIALS AND METHODS
Strains and media.
The high-resolution tiling microarray data for Shewanella oneidensis MR-1 (ATCC 700550) were collected under five conditions, including rich (aerobic growth in Luria-Bertani broth [LB]), HS (after 10 min of 42°C heat shock), minimal (aerobic growth in defined medium with lactate as the carbon source), DMSO (anaerobic growth in defined medium with lactate as the carbon source and 20 mM DMSO as the electron acceptor), and Fe(III) (anaerobic growth in defined medium with lactate as the carbon source and 10 mM ferric iron citrate as the electron acceptor). Cells were grown at 30°C and harvested at the mid-exponential phase (optical density at 600 nm [OD600], ~0.7 for growth in LB and ~0.4 for growth in minimal medium). For the heat shock experiment, S. oneidensis MR-1 was grown to mid-exponential phase at 30°C in LB and then incubated at 42°C for 10 min before harvesting. Two conditions, aerobic growth in LB and in minimal lactate medium, were used for 5′ RNA-seq analysis in eight diverse Shewanella species: S. oneidensis MR-1, Shewanella sp. MR-4, Shewanella sp. MR-7, Shewanella sp. ANA3, S. putrefaciens CN-32, Shewanella sp. W3-18-1, S. amazonensis SB2B, and Shewanella sp. PV-4. All non-S. oneidensis MR-1 strains were supplied by James Tiedje, Michigan State University.
RNA collection.
Bacterial pellets were typically harvested at mid-log phase and then stored at −80° C. After thawing, RNA was extracted by using RNeasy miniprep columns (Qiagen) with on-column DNase treatment. RNA quality was confirmed with an Agilent Bioanalyzer. rRNA was depleted by using the MICROBExpress kit (Ambion). The resulting mRNA-enriched samples were analyzed using tiling arrays or 5′ RNA-seq.
Tiling microarray experiments.
The S. oneidensis MR-1 tiling microarray experiments were performed as previously described (23). Briefly, first-strand cDNA was synthesized with random hexamer primers and the SuperScript indirect cDNA labeling system (Invitrogen). We added actinomycin D to the reverse transcription reaction mixuture to inhibit second-strand synthesis. First-strand cDNA was labeled with Alexa 555 and hybridized onto a custom-designed Nimblegen array with 2.1 million probes covering both strands. Genomic DNA extracted from stationary-phase cells was also hybridized to the tiling array as a control for differences in probe hybridization efficiency. The Nimblegen microarray slides were scanned on an Axon Instruments Gene Pix 4200A scanner with 100% gain and analyzed with Nimblescan software, with no local alignment and a border value of −1.
5′ RNA-seq and dRNA-seq experiments.
For 5′ RNA-seq experiments, we treated the mRNA-enriched samples with Terminator 5′-phosphate-dependent exonuclease (Epicenter) to remove processed RNAs, including degradation products. The 5′-triphosphate ends of the remaining RNA sample were converted to 5′-monophosphate with RNA 5′-polyphosphatase (Epicenter). We added a sequencing adaptor (5′ ACACUCUUUCCCUACACGACGCUCUUCCGAUCU 3′) to the 5′ end of the transcripts by using T4 RNA ligase (Ambion). We used a random hexamer primer with a sequencing adaptor on the 5′ end (5′ CAAGCAGAAGACGGCATACGAGCTCTTCCGATCTNNNNNN 3′) to obtain first-strand cDNA. We subjected the library to PCR amplification with primers as described in reference 23. During the workflow, RNA samples were purified with RNAClean XP beads and cDNA and PCR products were purified with AMPure XP beads (Agencourt). The first library for S. oneidensis MR-1 in minimal medium (minimal 1) was sequenced on an Illumina Genome Analyzer II; all other libraries were sequenced on an Illumina HiSeq 2000. Both platforms generated single-end 50-nt-long reads. For multiplexing 5′ RNA-seq, we used 3′-end reverse transcription primer 5′-AGACGTGTGCTCTTCCGATCNNNNNN and PCR reverse primer 5′-CAAGCAGAAGACGGCATACGAGATXXXXXXGTGACTGGAGTTCAGACGTGTGCTCTTCCGATC to incorporate the bar codes. In total, four different sets of 5′ RNA-seq data were generated for S. oneidensis MR-1 (2 rich and 2 minimal) and two each for the other seven Shewanella species (1 rich and 1 minimal). The minimal 1 sample for MR-1 was previously described (40).
We also compared our 5′ RNA-seq results with those obtained from dRNA-seq (2), for which libraries were constructed with the following variations from the 5′ RNA-seq protocol: (i) mRNA enrichment by rRNA depletion was not performed; (ii) two parallel samples were processed, with one treated with Terminator 5′-phosphate-dependent exonuclease and the other not treated; (iii) tobacco acid pyrophosphatase (TAP; Epicenter) was used to convert 5′-triphosphate to 5′-monophosphate, because it was used in the published dRNA-seq protocol (2) and is expected to have the same effect as RNA 5′-polyphosphatase for prokaryotic RNAs. We multiplexed and sequenced two pairs of S. oneidensis MR-1 dRNA-seq libraries, in rich and minimal media, with Illumina MiSeq. In order to have more reads for analysis, we sequenced the same libraries twice and combined the reads from these two runs.
Data processing.
For the 5′ RNA-seq data, only the reads that passed the quality filtering (Illumina CASAVA 1.8) were considered. Adapter-only reads were filtered out, and the 3′ adaptor sequences were trimmed off. The trimmed reads were mapped to the corresponding genome sequences by using BOWTIE (version 0.12.7), allowing at most two mismatches and only reporting the reads with uniquely matched genome positions. For S. oneidensis MR-1, we used the genome sequence and gene models in GenBank accession number AE014299.2. Using this approach, 76.3 million reads were mapped for the single-library 5′ RNA-seq on rich medium and 21.2 million on minimal medium, and 2 to 20 million reads were mapped to each sample in the multiplexed 5′ RNA-seq data (see Table S1 in the supplemental material).
For the dRNA-seq data, we combined the reads from two MiSeq runs and mapped the reads in the same way as for 5′ RNA-seq (see Table S1). Then, we calculated the log ratio of the number of reads from TEX[+] and TEX[−] libraries and adjusted the values so that their median was 0.
Promoter sequence analysis.
We first built a preliminary set of 1,127 putative TSSs in S. oneidensis MR-1 by using the combination of tiling microarray and 5′ RNA-seq data in minimal medium (minimal 1 library). First, we identified rises in the tiling microarray data based on local correlations to a step function (41). We then identified peaks from the 5′ RNA-seq data with at least 200 mapped reads and the highest number of reads within a 50-nt region. We called the first preliminary set of putative TSSs from 5′ RNA-seq peaks if the TSS was within 60 nt of a rise in the tiling microarray data and was located within a 200-nt neighboring region of the first base of an annotated gene. We extracted the positions −50 to +1 relative to these TSSs and determined the major promoter motifs by using MEME (42) to identify ungapped motifs of 30 to 35 nucleotides. We searched for hits to these motifs with Patser (43), scanning the entire genome. We used the motif bit scores for σ70 to help determine the final list of TSSs with high confidence (see below). The TSSs of the other seven Shewanella species were determined as the positions with at least 250 total reads mapped across the two 5′ RNA-seq experiments (because there were no tiling microarray data for the non-S. oneidensis MR-1 species). The promoter motifs for these seven Shewanella species were predicted by MEME and using the methodology applied for S. oneidensis MR-1. The detected motifs were visualized by using a sequence logo generator (44).
Determination of high-confidence TSSs in S. oneidensis MR-1.
We counted the first base of mapped 5′ RNA-seq reads for each position of the S. oneidensis MR-1 genome and considered the positions with reads mapped from any 5′ RNA-seq library as potential TSSs. For MR-1, we determined the TSSs by a semisupervised machine learning approach (23) using the following three groups of features: (i) the number of reads from four sets of 5′ RNA-seq data, (ii) the sharpness of a rise (i.e., local correlation) and the scale of the rise (the difference between the log2 intensity before and after the rise) in five tiling experiments (41), and (iii) the bit score of the best hit to the MEME promoter motif of σ70. For each feature, the positive training set was chosen as “high confidence” according to the other features. The negative training set was a group of 10,000 randomly chosen locations from the entire genome. The log-odds of the subfeatures within groups i or ii were combined by using logistic regression. The integrated log-odds values were summed as for a naive Bayesian classifier analysis under the assumption that the features were conditionally independent. The false discovery rate was estimated by using a randomized data set generated by replacing the locations of all potential TSSs with random positions, recomputing all features, and shuffling the integrated log-odds of grouped features from i, ii, and iii. We defined a position as a TSS if its final log-odds was ≥10 (FDR = 0.59%), which generated 6,088 TSSs. Given that many TSSs had weaker peaks nearby, we selected the sites with the highest log-odds value within each 50-nt window, resulting in 2,531 high-confidence TSSs from the list of 6,088 TSSs.
For the promoter motif analysis, we aimed to identify TSSs without relying on motifs; in this case, we requested the sum of the other log-odds scores to be at least 8, which gave us 5,229 motif-naive TSSs (FDR < 10%) and 2,196 nonredundant TSSs that had the highest log-odds scores.
By examining the tiling microarray and 5′ RNA-seq data in Artemis, we manually inspected the TSS list and assigned putative interpretations to some of the unexpected TSSs (see Data Set S1 in the supplemental material).
Conservation analysis.
Two kinds of conservation were examined. First, we checked the conservation of transcription. We used two types of alignments—genome-wide mapping with MAUVE (version 2.3.1) (45) and local mapping for the coding sequences with MUSCLE (version 3.6) (46). Specifically, we aligned the S. oneidensis MR-1 main chromosome with the other seven Shewanella genome sequences by using MAUVE. Using the tree orthologs from these seven species against S. oneidensis MR-1 from MicrobesOnline (32), we generated pairwise alignments for their protein sequences by using MUSCLE. We only kept one-to-one orthologs with sequence identity of no less than 40%. These alignments were back-translated into nucleotide sequences that were used for correcting the MAUVE-generated alignments in the protein-coding regions. Given an alignment, the TSSs in S. oneidensis MR-1 were compared against each other Shewanella species to determine if there were significant numbers of reads mapped at the aligned locations. We defined an S. oneidensis MR-1 TSS as “conserved” if its corresponding positions in at least three other Shewanella species had at least 50 reads from the combined rich and minimal 5′ RNA-seq data sets. Using shuffled data, we estimated the false-positive rate for conserved promoter identification to be under 5%.
Second, we computed the promoter sequence conservation of the conserved S. oneidensis MR-1 TSSs. To avoid potential bias, the high-confidence S. oneidensis MR-1 TSS set for the conservation analysis was generated without the bit scores (motif-naïve predictions [see above]). To quantify the conservation of each S. oneidensis MR-1 promoter sequence, we examined the aligned sequences (−50 to +10 sequences around the conserved TSSs) only in other Shewanella species that had a 5′ RNA-seq peak at the corresponding location. Therefore, the conservation scores for different S. oneidensis MR-1 TSSs were derived from different sets of Shewanella species. The conservation level at each nucleotide was calculated as the fraction of these species that had the same nucleotide as in S. oneidensis MR-1. The conservation values were separated based on their relative position at each codon. For the internal TSSs, the TSSs whose upstream regions contained a coding sequence shorter than 40 nt were excluded, because their promoter regions were flanked by the noncoding sequences. Additionally, only the wobble positions from 4-fold-degenerate codons were considered. We applied Student’s t test to calculate the significance of the difference in the conservation levels between the conserved promoter sites (−35, −34, −12, −11, and −7) and divergent promoter sites (−31, −27 to −21, −16, −13, and −5 to −1), which we selected by using the promoter motif of σ70 in S. oneidensis MR-1.
Identification and conservation of putative noncoding RNAs.
We identified previously unannotated, noncoding RNAs from the transcript ends based on sharp rises or drops in the tiling microarray data. We manually examined each candidate and generated a list of 52 putative noncoding RNAs (see Data Set S2 in the supplemental material). We mapped the identified high-confidence S. oneidensis TSSs to the starts of these putative noncoding RNA candidates. Lastly, we determined if the candidates had conserved secondary structures by using CMfinder 2.0 (39), with the homologous sequences from the other seven Shewanella species from the MAUVE alignment and from other genera identified by BLASTN (E < 1e−5).
Statistical tools.
All statistical analyses were conducted in R 2.13 or 2.15 (http://r-project.org/).
Data availability.
All tiling and 5′ RNA-Seq data are available in the Gene Expression Omnibus (GEO; GSE58337). All data and the major codes are available from the authors’ website (http://genomics.lbl.gov/supplemental/ShewanellaTSS/Shewanella_TSS_WS.htm).
SUPPLEMENTAL MATERIAL
Cutoff for identifying high-confidence and conserved Shewanella oneidensis MR-1 TSSs. (A) The FDR, the number of called TSSs, and the number of genes with a TSS assigned as a function of the log-odds threshold. We used a log-odds of >10 (FDR < 1% [red arrow]) to define the high-confidence S. oneidensis MR-1 TSSs. The pink dashed line represents the estimated FDR at 1%. (B) The ROC (receiver operating characteristic) curve for varying the number of species (k) and the number of mapped reads to call conserved TSSs. More than three species with at least 50 reads mapped were picked as the threshold, giving an FP less than 5% (green arrow). Download
Comparison between 5′ RNA-seq and dRNA-seq. Distribution of the log2 ratio of mapped reads from exonulease-treated (TEX[+]) versus untreated (TEX[−]) samples. Solid red lines represent TSSs called by the combination of 5′ RNA-seq and tiling data with high confidence (log-odds > 10). Dashed black lines represent the rest of the 5′ RNA-seq peaks. (A) TSS for annotated genes (gTSS); (B) intergenic TSS (nTSS); (C) sense internal TSS (iTSS); (D) antisense internal TSS (aTSS). Download
Transcriptome structures for three types of conserved TSSs within genes. (A) An iTSS initiates the transcription of the downstream gene. (B) An iTSS generates truncated transcripts. (C) An aTSS drives expression of a divergently transcribed gene. The position for an identified iTSS or aTSS in each plot was marked by vertical dashed lines and red arrows. Download
Summary of RNA-seq experiments described in this study. The reads for dRNA-seq experiments were combined from two runs of MiSeq.
Consistency between our identified Shewanella oneidensis MR-1 TSSs and those reported in previous literature.
Effect of different log-odds cutoffs on TSS identification for Shewanella oneidensis MR-1.
List of identified transcription start sites. Download
List of identified novel non-coding RNAs (ncRNAs). Download
ACKNOWLEDGMENTS
We thank Rachel Brem for helpful discussions on promoter conservation and alternative explanations for conserved internal TSSs.
This work was conducted by ENIGMA (Ecosystems and Networks Integrated with Genes and Molecular Assemblies), which is supported by the Office of Science, Office of Biological and Environmental Research, U.S. Department of Energy, contract number DE-AC02-05CH11231. Curation of the annotation was supported by the Genomic Science Program (GSP), Office of Biological and Environmental Research, U.S. Department of Energy, and is a contribution of the Pacific Northwest National Laboratory (PNNL) Foundational Scientific Focus Area.
A.P.A., A.M.D., M.N.P., and W.S. conceived of the project. W.S. and A.M.D. collected data. W.S., M.N.P., and M.F.R. analyzed the results. W.S., A.P.A., A.M.D., and M.N.P. wrote the paper.
Footnotes
Citation Shao W, Price MN, Deutschbauer AM, Romine MF, Arkin AP. 2014. Conservation of transcription start sites within genes across a bacterial genus. mBio 5(4):e01398-14. doi:10.1128/mBio.01398-14.
REFERENCES
- 1. Cho BK, Zengler K, Qiu Y, Park YS, Knight EM, Barrett CL, Gao Y, Palsson BO. 2009. The transcription unit architecture of the Escherichia coli genome. Nat. Biotechnol. 27:1043–1049. 10.1038/nbt.1582 [DOI] [PMC free article] [PubMed] [Google Scholar]
- 2. Sharma CM, Hoffmann S, Darfeuille F, Reignier J, Findeiss S, Sittka A, Chabas S, Reiche K, Hackermüller J, Reinhardt R, Stadler PF, Vogel J. 2010. The primary transcriptome of the major human pathogen Helicobacter pylori. Nature 464:250–255. 10.1038/nature08756 [DOI] [PubMed] [Google Scholar]
- 3. Toledo-Arana A, Dussurget O, Nikitas G, Sesto N, Guet-Revillet H, Balestrino D, Loh E, Gripenland J, Tiensuu T, Vaitkevicius K, Barthelemy M, Vergassola M, Nahori MA, Soubigou G, Régnault B, Coppée JY, Lecuit M, Johansson J, Cossart P. 2009. The Listeria transcriptional landscape from saprophytism to virulence. Nature 459:950–956. 10.1038/nature08080 [DOI] [PubMed] [Google Scholar]
- 4. Qiu Y, Cho BK, Park YS, Lovley D, Palsson BO, Zengler K. 2010. Structural and operational complexity of the Geobacter sulfurreducens genome. Genome Res. 20:1304–1311. 10.1101/gr.107540.110 [DOI] [PMC free article] [PubMed] [Google Scholar]
- 5. Mitschke J, Georg J, Scholz I, Sharma CM, Dienst D, Bantscheff J, Voss B, Steglich C, Wilde A, Vogel J, Hess WR. 2011. An experimentally anchored map of transcriptional start sites in the model cyanobacterium Synechocystis sp. PCC6803. Proc. Natl. Acad. Sci. U. S. A. 108:2124–2129. 10.1073/pnas.1015154108 [DOI] [PMC free article] [PubMed] [Google Scholar]
- 6. Raghavan R, Sage A, Ochman H. 2011. Genome-wide identification of transcription start sites yields a novel thermosensing RNA and new cyclic AMP receptor protein-regulated genes in Escherichia coli. J. Bacteriol. 193:2871–2874. 10.1128/JB.00398-11 [DOI] [PMC free article] [PubMed] [Google Scholar]
- 7. Salgado H, Peralta-Gil M, Gama-Castro S, Santos-Zavaleta A, Muñiz-Rascado L, García-Sotelo JS, Weiss V, Solano-Lira H, Martínez-Flores I, Medina-Rivera A, Salgado-Osorio G, Alquicira-Hernández S, Alquicira-Hernández K, López-Fuentes A, Porrón-Sotelo L, Huerta AM, Bonavides-Martínez C, Balderas-Martínez YI, Pannier L, Olvera M, Labastida A, Jiménez-Jacinto V, Vega-Alvarado L, Del Moral-Chávez V, Hernández-Alvarez A, Morett E, Collado-Vides J. 2013. RegulonDB v8.0: omics data sets, evolutionary conservation, regulatory phrases, cross-validated gold standards and more. Nucleic Acids Res. 41:D203–D213 [DOI] [PMC free article] [PubMed] [Google Scholar]
- 8. Sorek R, Cossart P. 2010. Prokaryotic transcriptomics: a new view on regulation, physiology and pathogenicity. Nat. Rev. Genet. 11:9–16. 10.1038/nrg2695 [DOI] [PubMed] [Google Scholar]
- 9. Georg J, Hess WR. 2011. cis-antisense RNA, another level of gene regulation in bacteria. Microbiol. Mol. Biol. Rev. 75:286–300. 10.1128/MMBR.00032-10 [DOI] [PMC free article] [PubMed] [Google Scholar]
- 10. Sesto N, Wurtzel O, Archambaud C, Sorek R, Cossart P. 2013. The excludon: a new concept in bacterial antisense RNA-mediated gene regulation. Nat. Rev. Microbiol. 11:75–82. 10.1038/nrmicro2934 [DOI] [PubMed] [Google Scholar]
- 11. Lasa I, Toledo-Arana A, Dobin A, Villanueva M, de los Mozos IR, Vergara-Irigaray M, Segura V, Fagegaltier D, Penadés JR, Valle J, Solano C, Gingeras TR. 2011. Genome-wide antisense transcription drives mRNA processing in bacteria. Proc. Natl. Acad. Sci. U. S. A. 108:20172–20177. 10.1073/pnas.1113521108 [DOI] [PMC free article] [PubMed] [Google Scholar]
- 12. Lybecker M, Zimmermann B, Bilusic I, Tukhtubaeva N, Schroeder R. 2014. The double-stranded transcriptome of Escherichia coli. Proc. Natl. Acad. Sci. U. S. A. 111:3134–3139. 10.1073/pnas.1315974111 [DOI] [PMC free article] [PubMed] [Google Scholar]
- 13. Koide T, Reiss DJ, Bare JC, Pang WL, Facciotti MT, Schmid AK, Pan M, Marzolf B, Van PT, Lo FY, Pratap A, Deutsch EW, Peterson A, Martin D, Baliga NS. 2009. Prevalence of transcription promoters within archaeal operons and coding sequences. Mol. Syst. Biol. 5:285. 10.1038/msb.2009.42 [DOI] [PMC free article] [PubMed] [Google Scholar]
- 14. Yoon SH, Reiss DJ, Bare JC, Tenenbaum D, Pan M, Slagel J, Moritz RL, Lim S, Hackett M, Menon AL, Adams MW, Barnebey A, Yannone SM, Leigh JA, Baliga NS. 2011. Parallel evolution of transcriptome architecture during genome reorganization. Genome Res. 21:1892–1904. 10.1101/gr.122218.111 [DOI] [PMC free article] [PubMed] [Google Scholar]
- 15. Raghavan R, Sloan DB, Ochman H. 2012. Antisense transcription is pervasive but rarely conserved in enteric bacteria. mBio 3(4):e00156-12. 10.1128/mBio.00156-12 [DOI] [PMC free article] [PubMed] [Google Scholar]
- 16. Wurtzel O, Sesto N, Mellin JR, Karunker I, Edelheit S, Bécavin C, Archambaud C, Cossart P, Sorek R. 2012. Comparative transcriptomics of pathogenic and non-pathogenic Listeria species. Mol. Syst. Biol. 8:583. 10.1036/msb.2012.11 [DOI] [PMC free article] [PubMed] [Google Scholar]
- 17. Dugar G, Herbig A, Förstner KU, Heidrich N, Reinhardt R, Nieselt K, Sharma CM. 2013. High-resolution transcriptome maps reveal strain-specific regulatory features of multiple Campylobacter jejuni isolates. PLoS Genet. 9:e1003495. 10.1371/journal.pgen.1003495 [DOI] [PMC free article] [PubMed] [Google Scholar]
- 18. Bernick DL, Dennis PP, Lui LM, Lowe TM. 2012. Diversity of Antisense and other non-coding RNAs in Archaea Revealed by Comparative small RNA sequencing in four Pyrobaculum Species. Front. Microbiol. 3:231. 10.3389/fmicb.2012.00231 [DOI] [PMC free article] [PubMed] [Google Scholar]
- 19. Fredrickson JK, Romine MF, Beliaev AS, Auchtung JM, Driscoll ME, Gardner TS, Nealson KH, Osterman AL, Pinchuk G, Reed JL, Rodionov DA, Rodrigues JL, Saffarini DA, Serres MH, Spormann AM, Zhulin IB, Tiedje JM. 2008. Towards environmental systems biology of Shewanella. Nat. Rev. Microbiol. 6:592–603. 10.1038/nrmicro1947 [DOI] [PubMed] [Google Scholar]
- 20. Heidelberg JF, Paulsen IT, Nelson KE, Gaidos EJ, Nelson WC, Read TD, Eisen JA, Seshadri R, Ward N, Methe B, Clayton RA, Meyer T, Tsapin A, Scott J, Beanan M, Brinkac L, Daugherty S, DeBoy RT, Dodson RJ, Durkin AS, Haft DH, Kolonay JF, Madupu R, Peterson JD, Umayam LA, White O, Wolf AM, Vamathevan J, Weidman J, Impraim M, Lee K, Berry K, Lee C, Mueller J, Khouri H, Gill J, Utterback TR, McDonald LA, Feldblyum TV, Smith HO, Venter JC, Nealson KH, Fraser CM. 2002. Genome sequence of the dissimilatory metal ion-reducing bacterium Shewanella oneidensis. Nat. Biotechnol. 20:1118–1123. 10.1038/nbt749 [DOI] [PubMed] [Google Scholar]
- 21. Beliaev AS, Klingeman DM, Klappenbach JA, Wu L, Romine MF, Tiedje JM, Nealson KH, Fredrickson JK, Zhou J. 2005. Global transcriptome analysis of Shewanella oneidensis MR-1 exposed to different terminal electron acceptors. J. Bacteriol. 187:7138–7145. 10.1128/JB.187.20.7138-7145.2005 [DOI] [PMC free article] [PubMed] [Google Scholar]
- 22. Gao H, Wang Y, Liu X, Yan T, Wu L, Alm E, Arkin A, Thompson DK, Zhou J. 2004. Global transcriptome analysis of the heat shock response of Shewanella oneidensis. J. Bacteriol. 186:7796–7803. 10.1128/JB.186.22.7796-7803.2004 [DOI] [PMC free article] [PubMed] [Google Scholar]
- 23. Price MN, Deutschbauer AM, Kuehl JV, Liu H, Witkowska HE, Arkin AP. 2011. Evidence-based annotation of transcripts and proteins in the sulfate-reducing bacterium Desulfovibrio vulgaris Hildenborough. J. Bacteriol. 193:5716–5727. 10.1128/JB.05563-11 [DOI] [PMC free article] [PubMed] [Google Scholar]
- 24. Wurtzel O, Sapra R, Chen F, Zhu Y, Simmons BA, Sorek R. 2010. A single-base resolution map of an archaeal transcriptome. Genome Res. 20:133–141. 10.1101/gr.100396.109 [DOI] [PMC free article] [PubMed] [Google Scholar]
- 25. Gassman NR, Ho SO, Korlann Y, Chiang J, Wu Y, Perry LJ, Kim Y, Weiss S. 2009. In vivo assembly and single-molecule characterization of the transcription machinery from Shewanella oneidensis MR-1. Protein Expr. Purif. 65:66–76. 10.1016/j.pep.2008.11.013 [DOI] [PMC free article] [PubMed] [Google Scholar]
- 26. Typas A, Hengge R. 2006. Role of the spacer between the -35 and -10 regions in sigmas promoter selectivity in Escherichia coli. Mol. Microbiol. 59:1037–1051. 10.1111/j.1365-2958.2005.04998.x [DOI] [PubMed] [Google Scholar]
- 27. Mendoza-Vargas A, Olvera L, Olvera M, Grande R, Vega-Alvarado L, Taboada B, Jimenez-Jacinto V, Salgado H, Juárez K, Contreras-Moreira B, Huerta AM, Collado-Vides J, Morett E. 2009. Genome-wide identification of transcription start sites, promoters and transcription factor binding sites in E. coli. PLoS One 4:e7526. 10.1371/journal.pone.0007526 [DOI] [PMC free article] [PubMed] [Google Scholar]
- 28. Kim D, Hong JS, Qiu Y, Nagarajan H, Seo JH, Cho BK, Tsai SF, Palsson BO. 2012. Comparative analysis of Regulatory elements between Escherichia coli and Klebsiella pneumoniae by Genome-Wide Transcription Start site Profiling. PLoS Genet. 8:e1002867. 10.1371/journal.pgen.1002867 [DOI] [PMC free article] [PubMed] [Google Scholar]
- 29. Petersen L, Larsen TS, Ussery DW, On SL, Krogh A. 2003. RpoD promoters in Campylobacter jejuni exhibit a strong periodic signal instead of a -35 box. J. Mol. Biol. 326:1361–1372. 10.1016/S0022-2836(03)00034-2 [DOI] [PubMed] [Google Scholar]
- 30. Asayama M, Ohyama T. 2005. Curved DNA and Prokaryotic promoters, p 37–51 In DNA conformation and transcription. Springer Verlag, Berlin, Germany [Google Scholar]
- 31. Singh N, Wade JT. 2014. Identification of regulatory RNA in bacterial genomes by genome-scale mapping of transcription start sites. Methods Mol. Biol. 1103:1–10. 10.1007/978-1-62703-730-3_1 [DOI] [PubMed] [Google Scholar]
- 32. Dehal PS, Joachimiak MP, Price MN, Bates JT, Baumohl JK, Chivian D, Friedland GD, Huang KH, Keller K, Novichkov PS, Dubchak IL, Alm EJ, Arkin AP. 2010. MicrobesOnline: an integrated portal for comparative and functional genomics. Nucleic Acids Res. 38:D396–D400. 10.1093/nar/gkp919 [DOI] [PMC free article] [PubMed] [Google Scholar]
- 33. Vassylyev DG, Sekine S, Laptenko O, Lee J, Vassylyeva MN, Borukhov S, Yokoyama S. 2002. Crystal structure of a bacterial RNA polymerase holoenzyme at 2.6-A resolution. Nature 417:712–719. 10.1038/nature752 [DOI] [PubMed] [Google Scholar]
- 34. Deutschbauer A, Price MN, Wetmore KM, Shao W, Baumohl JK, Xu Z, Nguyen M, Tamse R, Davis RW, Arkin AP. 2011. Evidence-based annotation of gene function in Shewanella oneidensis MR-1 using genome-wide fitness profiling across 121 conditions. PLoS Genet. 7:e1002385. 10.1128/MMBR.00032-10 [DOI] [PMC free article] [PubMed] [Google Scholar]
- 35. Novichkov PS, Laikova ON, Novichkova ES, Gelfand MS, Arkin AP, Dubchak I, Rodionov DA. 2010. RegPrecise: a database of curated genomic inferences of transcriptional regulatory interactions in prokaryotes. Nucleic Acids Res. 38:D111–D118. 10.1093/nar/gkp894 [DOI] [PMC free article] [PubMed] [Google Scholar]
- 36. Smith RA, Parkinson JS. 1980. Overlapping genes at the cheA locus of Escherichia coli. Proc. Natl. Acad. Sci. U. S. A. 77:5370–5374. 10.1073/pnas.77.9.5370 [DOI] [PMC free article] [PubMed] [Google Scholar]
- 37. Shearwin KE, Callen BP, Egan JB. 2005. Transcriptional interference—a crash course. Trends Genet. 21:339–345. 10.1016/j.tig.2005.04.009 [DOI] [PMC free article] [PubMed] [Google Scholar]
- 38. Peters JM, Mooney RA, Grass JA, Jessen ED, Tran F, Landick R. 2012. Rho and NusG suppress pervasive antisense transcription in Escherichia coli. Genes Dev. 26:2621–2633. 10.1101/gad.196741.112 [DOI] [PMC free article] [PubMed] [Google Scholar]
- 39. Yao Z, Weinberg Z, Ruzzo WL. 2006. CMfinder—a covariance model based RNA motif finding algorithm. Bioinformatics 22:445–452. 10.1093/bioinformatics/btk008 [DOI] [PubMed] [Google Scholar]
- 40. Price MN, Deutschbauer AM, Skerker JM, Wetmore KM, Ruths T, Mar JS, Kuehl JV, Shao W, Arkin AP. 2013. Indirect and suboptimal control of gene expression is Widespread in Bacteria. Mol. Syst. Biol. 9:660. 10.1038/msb.2013.16 [DOI] [PMC free article] [PubMed] [Google Scholar]
- 41. Güell M, van Noort V, Yus E, Chen WH, Leigh-Bell J, Michalodimitrakis K, Yamada T, Arumugam M, Doerks T, Kühner S, Rode M, Suyama M, Schmidt S, Gavin AC, Bork P, Serrano L. 2009. Transcriptome complexity in a genome-reduced bacterium. Science 326:1268–1271. 10.1126/science.1176951 [DOI] [PubMed] [Google Scholar]
- 42. Bailey TL, Elkan C. 1994. Fitting a mixture model by expectation maximization to discover motifs in biopolymers. Proc. Int. Conf. Intell. Syst. Mol. Biol. 2:28–36 [PubMed] [Google Scholar]
- 43. Hertz GZ, Stormo GD. 1999. Identifying DNA and protein patterns with statistically significant alignments of multiple sequences. Bioinformatics 15:563–577 [DOI] [PubMed] [Google Scholar]
- 44. Crooks GE, Hon G, Chandonia JM, Brenner SE. 2004. WebLogo: a sequence logo generator. Genome Res. 14:1188–1190. 10.1101/gr.849004 [DOI] [PMC free article] [PubMed] [Google Scholar]
- 45. Darling AE, Mau B, Perna NT. 2010. progressiveMauve: multiple genome alignment with gene gain, loss and rearrangement. PLoS One 5:e11147. 10.1371/journal.pone.0011147 [DOI] [PMC free article] [PubMed] [Google Scholar]
- 46. Edgar RC. 2004. MUSCLE: multiple sequence alignment with high accuracy and high throughput. Nucleic Acids Res. 32:1792–1797. 10.1093/nar/gkh340 [DOI] [PMC free article] [PubMed] [Google Scholar]
Associated Data
This section collects any data citations, data availability statements, or supplementary materials included in this article.
Supplementary Materials
Cutoff for identifying high-confidence and conserved Shewanella oneidensis MR-1 TSSs. (A) The FDR, the number of called TSSs, and the number of genes with a TSS assigned as a function of the log-odds threshold. We used a log-odds of >10 (FDR < 1% [red arrow]) to define the high-confidence S. oneidensis MR-1 TSSs. The pink dashed line represents the estimated FDR at 1%. (B) The ROC (receiver operating characteristic) curve for varying the number of species (k) and the number of mapped reads to call conserved TSSs. More than three species with at least 50 reads mapped were picked as the threshold, giving an FP less than 5% (green arrow). Download
Comparison between 5′ RNA-seq and dRNA-seq. Distribution of the log2 ratio of mapped reads from exonulease-treated (TEX[+]) versus untreated (TEX[−]) samples. Solid red lines represent TSSs called by the combination of 5′ RNA-seq and tiling data with high confidence (log-odds > 10). Dashed black lines represent the rest of the 5′ RNA-seq peaks. (A) TSS for annotated genes (gTSS); (B) intergenic TSS (nTSS); (C) sense internal TSS (iTSS); (D) antisense internal TSS (aTSS). Download
Transcriptome structures for three types of conserved TSSs within genes. (A) An iTSS initiates the transcription of the downstream gene. (B) An iTSS generates truncated transcripts. (C) An aTSS drives expression of a divergently transcribed gene. The position for an identified iTSS or aTSS in each plot was marked by vertical dashed lines and red arrows. Download
Summary of RNA-seq experiments described in this study. The reads for dRNA-seq experiments were combined from two runs of MiSeq.
Consistency between our identified Shewanella oneidensis MR-1 TSSs and those reported in previous literature.
Effect of different log-odds cutoffs on TSS identification for Shewanella oneidensis MR-1.
List of identified transcription start sites. Download
List of identified novel non-coding RNAs (ncRNAs). Download
Data Availability Statement
All tiling and 5′ RNA-Seq data are available in the Gene Expression Omnibus (GEO; GSE58337). All data and the major codes are available from the authors’ website (http://genomics.lbl.gov/supplemental/ShewanellaTSS/Shewanella_TSS_WS.htm).