

ABSTRACT
We analyzed the transcriptome of Escherichia coli K-12 by strand-specific RNA sequencing at single-nucleotide resolution during steady-state (logarithmic-phase) growth and upon entry into stationary phase in glucose minimal medium. To generate high-resolution transcriptome maps, we developed an organizational schema which showed that in practice only three features are required to define operon architecture: the promoter, terminator, and deep RNA sequence read coverage. We precisely annotated 2,122 promoters and 1,774 terminators, defining 1,510 operons with an average of 1.98 genes per operon. Our analyses revealed an unprecedented view of E. coli operon architecture. A large proportion (36%) of operons are complex with internal promoters or terminators that generate multiple transcription units. For 43% of operons, we observed differential expression of polycistronic genes, despite being in the same operons, indicating that E. coli operon architecture allows fine-tuning of gene expression. We found that 276 of 370 convergent operons terminate inefficiently, generating complementary 3′ transcript ends which overlap on average by 286 nucleotides, and 136 of 388 divergent operons have promoters arranged such that their 5′ ends overlap on average by 168 nucleotides. We found 89 antisense transcripts of 397-nucleotide average length, 7 unannotated transcripts within intergenic regions, and 18 sense transcripts that completely overlap operons on the opposite strand. Of 519 overlapping transcripts, 75% correspond to sequences that are highly conserved in E. coli (>50 genomes). Our data extend recent studies showing unexpected transcriptome complexity in several bacteria and suggest that antisense RNA regulation is widespread.
IMPORTANCE
We precisely mapped the 5′ and 3′ ends of RNA transcripts across the E. coli K-12 genome by using a single-nucleotide analytical approach. Our resulting high-resolution transcriptome maps show that ca. one-third of E. coli operons are complex, with internal promoters and terminators generating multiple transcription units and allowing differential gene expression within these operons. We discovered extensive antisense transcription that results from more than 500 operons, which fully overlap or extensively overlap adjacent divergent or convergent operons. The genomic regions corresponding to these antisense transcripts are highly conserved in E. coli (including Shigella species), although it remains to be proven whether or not they are functional. Our observations of features unearthed by single-nucleotide transcriptome mapping suggest that deeper layers of transcriptional regulation in bacteria are likely to be revealed in the future.
INTRODUCTION
Escherichia coli burst into the realm of model organisms with the discovery of conjugation by Joshua Lederberg in 1946 (1). Just 15 years later, Francois Jacob and Jacque Monod proposed the operon model in E. coli (2). For two-thirds of a century, E. coli has been an important vehicle for scientific investigation, playing a role in research resulting in no fewer than 10 Nobel prizes (1–10). The E. coli K-12 genome was among the early ones sequenced (11) and E. coli is unique among model organisms, possessing biochemical or genetic evidence for functions for ca. 75% of its known genes, making it arguably the best understood organism (12). Examination of its genome sequence confirmed what had long been surmised, that genes of related function are frequently arranged in operons (13–15).
Soon after the discovery of the lac operon, it became clear that not all operons are transcribed as discrete units of information neatly arranged end to end on the genome. First, it was recognized that regions of phage lambda are transcribed on complementary strands (16). Over the next 40 years, operons were studied, one or two at a time, in line with the technology of the day, revealing occasional glimpses of transcriptional complexity arising from overlapping, divergent (17, 18) and convergent operons (19, 20). Second, the perception of transcriptome complexity was forever changed when it was found that at least one antisense (AS) transcription start site is associated with nearly one-half (46%) of Helicobacter pylori genes (21). There is also a substantial amount of AS transcription in E. coli (22–24). While some researchers suggested that extensive AS transcription is a “by-product” of the transcription machinery, largely because AS transcripts did not appear to be conserved in enteric bacteria (25), others concluded the opposite, that AS RNA has an important role in transcriptional regulation (26–32). The recent identification and sequencing of 316 potentially functional double-stranded RNAs in E. coli is a step toward laying the argument to rest (33). The “excludon” concept of AS RNA control of divergent operons ascribes an important function to overlapping, complementary transcripts (34). A recent study of Staphylococcus aureus suggests that AS transcripts drive RNase III-mediated RNA processing, although a comparison of the AS RNA content of selected bacteria led the authors to infer that the mechanism is prevalent in Gram positives but absent in Gram negatives (30). Amid the mounting evidence for transcriptional complexity in bacteria and the finding that AS transcripts are prevalent in bacteria, we undertook a comprehensive transcriptome analysis of E. coli.
RNA sequencing (RNA-Seq) offers tremendous power for high-resolution transcriptome analysis. However, the fullness of its power has yet to be realized for E. coli, because all previous studies of the E. coli transcriptome failed to annotate both the 5′ and 3′ transcript ends and hence operons were not precisely mapped. We therefore developed an organizational schema described herein to precisely map RNA-Seq reads across entire operons, including both the 5′ and 3′ transcript ends, and to annotate these data in the context of the operon arrangement on the transcriptome. Though others used tiling microarray technology to address bacterial transcriptome organization (28, 35), tiling arrays did not have the resolving power to define transcript ends precisely or to elucidate operons with multiple promoters. More recent transcriptome mapping studies of E. coli relied on 5′ end mapping to identify transcription start sites (TSSs) (36, 37). However, our own critical examination of these data sets revealed extensive discrepancies that call into question many candidate TSSs, reinforcing the need for alternative promoter-mapping strategies (38). Recent RNA-Seq analyses of E. coli were also unfortunately not designed to map transcript ends accurately because they relied on randomly primed cDNA synthesis (39) or they had a resolution of only ca. 50 nucleotides due to low sequence read coverage (40). The recent development of differential RNA-Seq technology allowed mapping TSSs in Helicobacter pylori (21) and Salmonella enterica (29, 41); however, operon architecture was not determined because the 3′ ends were not mapped. In evaluating these approaches, we recognized that identification of both 5′ and 3′ transcript ends is essential for precise mapping of transcriptional regulatory features.
Considering the foundational role of E. coli in the life sciences, high-resolution RNA-Seq will stimulate progress by unambiguous mapping of the features that control transcription. To annotate operons and characterize their response to carbon starvation, we obtained a time series of RNA samples from wild-type E. coli K-12 BW38028 cultures grown to stationary phase on chemically defined, carbon source-limited (glucose) minimal medium. We chose these conditions because they are intrinsic to the physiology that allows E. coli to colonize the mammalian intestine yet survive in the environment until encountering a new host and, in the case of E. coli pathogens, cause disease (42). We analyzed these RNA samples by deep sequencing with a strand-specific RNA ligation approach (43) that ensures full read coverage and precise mapping of both the 5′ and 3′ transcript ends. In practice, only three transcriptional features are needed to define operon architecture, regardless of complexity. These are the 5′ ends (promoters), the 3′ ends (terminators), and sufficient RNA-Seq read coverage to connect the ends, which together define operons (Fig. 1). Our analyses revealed an unprecedented high-resolution view of E. coli operon architecture. Our analytical approach allowed us to test the hypothesis that bacterial operon structure accommodates substantial transcriptional complexity. We offer our annotated E. coli K-12 operon map as a community resource upon which others can participate in annotating additional transcriptional regulatory features (GEO accession no. GSE52059).
FIG 1 .

Single-nucleotide resolution of promoters and terminators in example complex operons. (A) The bolA operon contains transcription units (TUs) P-453657:T-454091 (red arrow) and S-453688:T-454091 (orange arrow). RNA-Seq data are shown in a JBrowse visualization of positive-strand (red) transcription in logarithmic- and stationary-phase samples (average from three replicates). The base count data were normalized and log2 transformed such that track heights in JBrowse are directly comparable. (B) bolA promoter region showing primary promoter P-453576 and secondary promoter S-453658 at single-nucleotide resolution (drawn to scale). (C) Plot of promoter usage (average count of 10 bases beginning at TSS) and TU usage (average count of bases within TU) for 10 growth curve time points showing bolA induction upon entry into stationary phase (see Fig. S1 for growth curve). (D) Terminator usage (average counts of 10 bases preceding and following terminator) is shown for T-1066062, which is shared by converging operons agp on positive strand (red) and wrbA-yccJ on negative strand (blue).
RESULTS AND DISCUSSION
Single-nucleotide resolved RNA-Seq data sets.
E. coli K-12 has served as an important model organism for more than a half century and was the first bacterium analyzed by DNA microarray technology (44, 45). While several other bacteria have now been analyzed by RNA-Seq (21, 26, 28, 31, 41, 47–49), the limited RNA-Seq studies of E. coli have not provided single-nucleotide resolution (39, 40). Herein, we used a strand-specific RNA ligation-based RNA-Seq strategy, which when coupled with a robust analytical approach, allowed us to define transcriptional features across the whole E. coli genome at single-nucleotide resolution. We acquired time series of RNA samples from duplicate cultures of E. coli K-12 BW38028 and its isogenic rpoS mutant BW39452 during logarithmic- and stationary-phase growth on glucose-limited minimal medium (see Fig. S1 in the supplemental material). In total, we sequenced 26 RNA samples to generate a data set of 72.1 million uniquely mapped sequence reads corresponding to 5.5 gigabases of RNA-Seq data (see Table S1). Appropriate temporal expression of bolA, a known glucose starvation-inducible gene (50), confirmed that our RNA-Seq data correctly represented the growth conditions (Fig. 1). Our ongoing analyses of the RpoS regulon will be reported elsewhere. The correlation between replicate cultures was >0.96 (see Fig. S1); this level of biological replication provides a reliable view of the E. coli K-12 transcriptome (Fig. 2). The data are available at GEO (accession no. GSE52059).
FIG 2 .

Genome-wide promoter locations and annotated transcriptome map of a selected region. (A) Promoters aligned by genome location. Line heights correspond to normalized, TEX-enriched promoter usage values (see text for details), shown for logarithmic phase (black) and stationary phase (orange). (B) Annotated regulatory features of a selected region of the genome. Positive-strand RNA-Seq data (red) and negative-strand data (blue) were normalized for comparison between logarithmic- and stationary-phase samples. Primary promoters and corresponding TUs (red) are indicated by arrows extending from promoter to terminator, as are secondary promoters (orange), internal promoters (purple), and AS promoters (green). Beginning on the left, rmf is transcribed from a primary promoter and depending on growth conditions terminates either before or within the ycbZ-fabA operon, which has a primary promoter upstream of ycbZ, an internal promoter within ycbZ, and a secondary promoter upstream of fabA. matP is transcribed from primary and secondary promoters. ompA is transcribed from a secondary promoter in logarithmic phase and is cotranscribed from the primary promoter of the sulA-ompA operon during stationary phase. An AS TU that overlaps the sulA sense transcript is turned on in stationary phase. The sxy and yccF-yccS operons converge. Finally, mgsA is transcribed as an independent TU from a secondary promoter in logarithmic phase and also is expressed in the yccT-mgsA operon from a promoter that is active only in stationary phase. (C) Plot of TU base counts for ycbZ-fabA operon, colorized according to color scheme in panel B; (D) TU plot of sulA-ompA operon; (E) TU plot of yccFS operon; (F) TU plot of yccT-mgsA operon.
We developed an in-house computational tool to convert the binary read alignment (BAM) files to base count (WIG) files to facilitate single-nucleotide resolution analyses. We normalized our base count data by using a strategy analogous to the total count approach (51) for normalizing gene-specific read alignments. Accordingly, the resulting WIG files contain only the base location and the number of times each base is read (sequenced) and are >100-fold smaller than the sample read alignment (SAM) files. Advantages of this simple base count approach are severalfold: first, the data are inherently more computable; second, normalization of base count data makes all samples directly comparable and eliminates transcription unit (TU) length bias; third, the base counts of individual features can be computed and queried at any desired resolution from single nucleotide to an entire operon.
Since we analyzed RNA-Seq reads at the base count level, the normalized base counts can be readily averaged across any range of bases to calculate the relative usage of transcriptional features, including promoters, terminators, TUs, and operons (Fig. 1). We empirically determined the number of bases used to calculate promoter usage by comparing the single base count value at the TSS to 3-, 5-, 10-, and 20-base averages, each beginning at the TSS. In practice, the shorter base count lengths were highly variable, presumably because of staggered starts that are occasionally observed in primer extension experiments (52) and were frequently observed in the RNA-Seq data sets. However, a 20-base-count length was too long to allow discrimination of closely spaced promoters. We therefore used 10-base average counts for quantifying promoter usage (Fig. 1). The same 10-base average worked well for calculating terminator efficiency by comparing the 10-base average counts before and after the termination site (Fig. 1 and 3). We used these base count values to calculate the usage of individual transcription features as well as the impact of operon structure on relative TU and gene expression.
FIG 3 .

Balanced transcript coverage of the sdhCDAB-sucABCD operon achieved by complex interaction of internal terminator and secondary promoter. (A) JBrowse instance showing coverage data; (B) terminator usage in logarithmic (WT_log_cmb_pos) and stationary (WT_stat_cmb_pos) phase; (C) TU coverage time series.
Promoter mapping.
Our search for promoters was driven by mapping of putative TSSs on the basis of (i) enrichment with terminator exonuclease (TEX), which degrades RNA molecules with 5′-monophosphate ends and consequently enriches for 5′-triphosphate ends corresponding to the nucleotide initiated de novo by RNA polymerase (18); (ii) promoter motif analysis; (iii) consensus among replicate data sets; and (iv) sigma factor-specific RNA polymerase binding (SELEX). None of these approaches alone is comprehensive, because each gives rise to false-positive results and fails to find all TSSs (20). For example, TEX treatment does not enrich for some TSSs because RppH phosphatase activity removes the 5′-triphosphates (53). Additionally, not all promoters have consensus motifs that can be identified by computer algorithms (54), nor do all promoters bind RNA polymerase in vitro (55).
To facilitate promoter mapping, we wrote a simple algorithm to search for changes in base count values exceeding 2-fold in replicate TEX-enriched and coverage data sets (n = 14, wild-type [WT] and rpoS culture samples from log and stationary phase). The TSSs of highly expressed genes were apparent in all 14 replicates. However, since the 14 samples represented both logarithmic- and stationary-phase samples, expression of some promoters was condition specific. In order to generate transcriptome maps that are condition independent for annotating the response to many conditions in the future, we chose a consensus in which three replicates of either logarithmic- or stationary-phase samples have TSSs at the identical base locations as a starting point for promoter mapping. This conservative strategy revealed 11,329 putative TSSs, a value that is similar to the number of promoters found by Thomason and Storz (submitted for publication), and includes known promoters of weakly expressed genes. However, this number far exceeds the expected promoter density on the E. coli genome, thus exemplifying the need to use a multifaceted approach to confirm promoters. To identify candidate promoters missed by TSS mapping of regions that had few RNA-Seq reads, we employed genomic SELEX screening, which was developed for quick identification of genes under the control of specific transcription factors (57). Confirmation of tentative TSS’s by RNAP binding was previously employed for promoter mapping of Salmonella enterica serovar Typhimurium (29). Sites that bound RpoD in vitro, exceeding a conservative signal-to-background ratio threshold of 3.0, and corresponded to RNA-Seq reads expressed in vivo identified 1,254 additional candidate promoters (see Fig. S2 in the supplemental material).
Next, we used a bioinformatics approach to search the 50-bp sequences immediately upstream of the 12,583 putative TSSs for promoter motifs by using FIMO software (58) to screen against a library of E. coli promoter motifs available at DPInteract (59). We found it was necessary to modify the RpoD promoter library according to the characterization of 554 promoters by Mitchell et al. (60), which demonstrated that the RpoD consensus promoter has −10 and −35 regions with spacing of 14 to 20 bases between promoter elements. The search output was restricted to promoter sequences correctly positioned within ±3 bases of the TSS, with E values corresponding to P values of <0.02. This multifaceted approach yielded 5,653 putative RpoD-dependent promoters, which we evaluated further by manual annotation, which involved direct visual observation.
A visual graphic environment (JBrowse [61]) interfaced to an Oracle database facilitated manual annotation documentation. From the list of candidate promoters, we created a JBrowse track at the corresponding base locations, each displaying a “clickable” URL call to the database that automatically recorded the base location and allowed manual entry of metadata, including the type of promoter, regulatory information supported by differential expression analysis, and comments. We annotated only promoters that could be experimentally associated with operons, by using RNA-Seq data as described in the next section. This comprehensive strategy yielded 2,122 vegetative promoters (Fig. 2), which more than doubled the 811 individually characterized E. coli promoters annotated in RegulonDB and calls into question several thousand candidate promoters that were identified by less reliable high-throughput strategies (35, 38). The promoter data set (see Table S2) is dominated by primary promoters (P), defined as the furthest upstream promoter in an operon (66.3%), with a lower number of secondary promoters (S) that are intergenic and downstream of P promoters (19.6%), internal promoters (I) that are intragenic (9.8%), and AS (4.2%) promoters. All possible arrangements and orientations of these promoter types were observed and collectively generated substantial complexity in the transcriptome (Fig. 2).
It is well known that promoter strength, i.e., quality, varies greatly (60) and that variability is reflected in our data set. To quantify promoter quality, we scored the four criteria (metrics) used to map candidate promoters (see Table S2). The promoter quality score was calculated by applying a weighted matrix on the basis of 10 points, where TEX enrichment carries a weight of 4, the promoter motif score carries a weight of 3, the TSS consensus (between replicates) score carries a weight of 2, and the SELEX score carries a weight of 1. The resulting analyses yielded promoters scored on a scale of 0 to 10. The TEX enrichment metric reflects the number of instances among four TEX replicates in which the ratio of TEX-treated versus non-TEX-treated base counts (10-base-count average beginning at the TSS) for a sample exceeded 2-fold. The promoter motif score was calculated in quartiles of E values for RpoD-dependent promoter motifs as determined by using FIMO. The TSS consensus score was calculated as the number of occurrences of a TSS at a precise base location divided by the total number of samples evaluated (n = 14). The final metric was the presence or absence of SELEX-determined RpoD binding, which was scored as a 1 or 0. The 2,122 promoters ranged in score from 10 to 0.14, with the top 10% of promoters scoring above 7.8, the bottom 10% scoring below 2.9, and the average promoter scoring 5.5.
We found no strong correlation between promoter usage (average count of first 10 transcribed bases) and promoter confidence scores or promoter motif scores (see Fig. S3 in the supplemental material), which is in agreement with an earlier report (60). However, we did find a weak correlation between promoter usage and TU usage (average count of bases from promoter to terminator) (see Fig. S3). We confirmed that TU usage and RNA half-life (62) (measured under similar conditions) do not correspond, as noted previously. Nevertheless, promoter and TU usage values do reflect the physiologically relevant transcript level, as the RNA concentration in the cell is determined both by the frequency of transcription initiation and the rate of RNA decay, which vary substantially for different transcripts (62).
Operon mapping.
To annotate operons, it was also necessary to map the 3′ transcript ends, which allowed documenting the connections between promoters and the corresponding downstream terminators (Fig. 1). Our criteria for operon annotation were (i) the P promoter must be followed by sequence read coverage across the entire operon, (ii) the mapped 3′ ends must extend beyond the stop codon of the last gene in the operon, (iii) the S and I promoters must increase read coverage of the downstream bases, and (iv) internal terminators must decrease coverage of downstream bases without interrupting contiguous coverage by readthrough transcripts. Our search for 3′ ends that can be associated with annotated promoter(s) by deep sequence read coverage throughout the operon led to mapping 1,774 candidate terminators (see Table S3 in the supplemental material), 264 of which lie within operons and apparently permit partial readthrough transcription of downstream genes, as demonstrated for the sdhCDAB-sucABCD operon (Fig. 3). We evaluated the 1,774 3′ ends by using TransTermHP (63) and confirmed that 623 have sequences characteristic of intrinsic terminators, which extends the number of annotated E. coli terminators previously annotated (227 [38]) by nearly 8-fold. It has been predicted that roughly one-half of terminators are intrinsic (64). The remaining 1,151 terminators that were not confirmed by TransTermHP are candidates for ones requiring Rho or another protein factor for termination. Since there is no computational approach to identify factor-dependent terminators, the data in Table S3 represent the most extensive genome-wide prediction of nonintrinsic terminators.
The preceding analyses of only logarithmic- and stationary-phase samples revealed a total of 6,463 regulatory features, including 2,122 promoters (see Table S2), 1,774 terminators (see Table S3), and 2,566 transcription units (TUs) corresponding to 1,510 operons (see Table S4). The sequence reads covered more than 90% of bases within 90% of the annotated operons. The 1,510 operons cover 2,985 of 4,457 genes (approximately two-thirds) annotated on the reference genome. As more data sets and growth conditions are analyzed, our simple organizational schema should make it straightforward to add newly identified regulatory features to the E. coli K-12 transcriptome map. For ready distribution, we converted our data sets to GenBank format by using “promoter,” “terminator,” and “operon” as feature keys (65). This data format allows annotation of any number of experimental parameters that affect the usage of these features. Our E. coli K-12 transcriptome annotation GenBank feature table is available from GEO (accession no. GSE52059).
Operon organization examples.
The data in Fig. 2 unequivocally confirm that the E. coli genome is organized in operons. In its original conception, the operon has a regulatory region with a single promoter that initiates transcription of a polycistronic mRNA covering the lac operon genes and ends with a single terminator. Indeed, many E. coli operons fit this model or are even simpler if they contain a single gene (monocistronic). However, the whole E. coli transcriptome reveals densely packed regulatory features that cannot be discerned from the genome sequence alone (Fig. 2). Complex operons result from transcripts initiated by S and I promoters, as well as internal terminators. For example, sulA and ompA are independently transcribed during logarithmic phase, with each gene having its own promoter and terminator. However, during stationary phase, the sulA TU reads through a nonintrinsic sulA terminator to form the sulA-ompA transcript, driven by an S promoter that increases expression of the ompA TU (Fig. 2). An AS transcript that fully overlaps the sulA coding sequence is also switched on in stationary phase. This arrangement of the sulA-ompA operon and AS transcript was postulated as a means for posttranscriptional control of the synthesis of the cell division inhibitor SulA (66), which is further supported by our results. Our organizational schema makes the previously unannotated sulA AS transcript (12) and similar regulatory features readily apparent on the sulA-ompA transcriptome map (Fig. 2). Such differential expression of TUs within operons can provide bacteria with the ability to modulate gene expression to cope with physiological complexity (28, 30, 34, 41).
It is especially notable that Fig. 2 reveals the E. coli transcriptome for only two growth conditions, log phase and stationary phase, due to carbon source limitation. Our analyses show that 29% of operons have more than one promoter and that 15% of operons have more than one terminator under these conditions (Fig. 4). Further, many operons are subject to multiple regulatory inputs (38) that have not been examined here. Differential mRNA decay can also provide an additional layer of control within operons (62). No doubt, future RNA-Seq analysis of the myriad responses to numerous regulatory signals is likely to reveal substantially more variation in operon architecture, as seen for Salmonella (41).
FIG 4 .
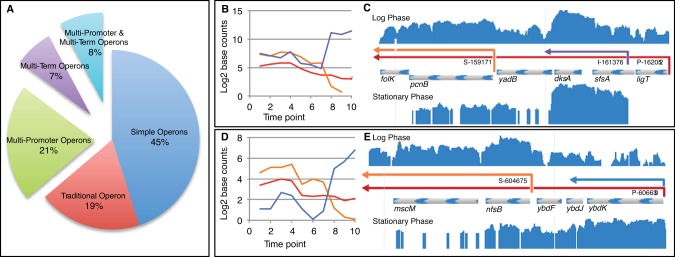
Computational analysis of single-nucleotide resolution data reveals complex operon architecture. (A) Operons organized by increasing complexity; (B) TU usage plot of ligT-sfsA-dksA-yadB-pcnB-floK operon. The primary TU corresponding to the entire operon is shown in red. The differentially expressed dksA-specific TU driven by promoter I-161376 is shown in purple. The pcnB-folK TU driven by S-159171 is shown in orange. Note that transcript levels of dksA increase upon entry into stationary phase, whereas pcnB-folK decreases. (C) JBrowse instance showing ligT-sfsA-dksA-yadB-pcnB-floK operon; (D) TU usage plot of ybdK-ybdJ-ybdF-nrsB-mbcM operon. Note the primary TU corresponding to the entire operon (red) decreases only slightly during transition from logarithmic phase into stationary phase, because it is comprised of two differentially expressed TUs, one of which increases and the other decreases during growth: the nfsB-mbcM-specific transcript (orange) essentially disappears in stationary phase, whereas the ybdK-specific transcript (blue) is induced in stationary phase. (E) JBrowse instance of ybdK-ybdJ-ybdF-nrsB-mbcM operon.
Intricacy is readily apparent for operons with internal promoters and terminators. For example, three promoters upstream of the ahpCF operon contribute to its expression in an additive fashion (Fig. 5). Such an arrangement allows differential control of alkylhydroperoxidase production in response to stationary phase, osmotic stress, and oxidative stress (67). Likewise, three promoters contribute to ybfE-fldA-uof-fur operon expression during logarithmic phase, allowing for continuation of uof-fur TU expression, decline of fldA expression, and turnoff of ybfE expression in the stationary phase (Fig. 5). Although cotranscription of the complex ybfE-fldA-uof-fur operon was not previously recognized (68), it makes sense for uof-fur to be transcribed independently of ybfE-fldA under certain conditions, because fur encodes a negative regulator of genes for iron uptake. Furthermore, uof expression is controlled indirectly by the trans-acting noncoding RNA RhyB, which is itself Fur regulated, thus forming a negative feedback loop responsive to iron limitation (68). The ability to unravel condition-specific terminator usage by our organizational schema is illustrated for the internal terminator of the sdhCDAB-sucABCD operon, which encodes three enzymes of the tricarboxylic acid (TCA) cycle (Fig. 3). This arrangement explains how intrinsic termination can allow one operon to function independently as two operons under appropriate conditions (69). These examples demonstrate how our promoter and terminator usage calculations can reveal new biological insights from the RNA-Seq transcriptome analyses.
FIG 5 .

Three promoters contribute to expression levels of genes within the ahpCF and the ybfE-fldA-uof-fur operons. (A) WT time series of TU base counts of three overlapping TUs within the ahpCF operon; (B) usage of 3 ahpC promoters (10-base average from TSS +1 to +10) during logarithmic phase (time point 4); (C) TU coverage time series of the ybfE-fldA-uof-fur operon; (D) differential usage of three promoters within the ybfE-fldA-uof-fur operon during log phase. Promoter usage and TU coverage calculations are described in the legend to Fig. 1.
Catalogue of operon architecture.
High-resolution mapping of well-characterized regions of the genome provided glimpses of intricate operon arrangements (Fig. 2 to 5). Our analyses of E. coli operons at single-nucleotide resolution further revealed numerous instances of complexity genome-wide. Single-gene operons with a single promoter and terminator make up 47% of all operons, while 17% are “traditional” operons with more than one gene and a single promoter and terminator (Fig. 4). The remaining operons (36%) are more complex: 21% have multiple (as many as 8) promoters, 7% have multiple (as many as 4) terminators, and 8% have both multiple promoters and multiple terminators. The average operon has 1.98 genes (see Table S4 in the supplemental material). In our data set, the most complex operon, which encodes several core cellular functions, has 14 genes, 8 promoters, 4 terminators, and 23 TUs (yjeF-yjeE-amiB-mutL-miaA-hfq-hflX-hflK-hflC-yjeT-purA-nsrR-rnr-rlmB operon; see Fig. S4).
Differential TU expression within operons can result from the activity of S and I promoters, internal terminators, and combinations of these regulatory features. For example, Fig. 4 illustrates how an I promoter and internal terminator can function together to increase expression of the DksA-specific TU in stationary phases. For the ybdK operon, Fig. 4 shows differential expression of the 5′ and 3′ TUs of the operon caused by transcription from an S promoter and an internal terminator. This arrangement of features results in a complete inversion in expression of the 2 TUs between logarithmic and stationary phases. These findings suggest that operon architecture permits E. coli to adjust relative levels of gene expression within the same operon in response to environmental conditions.
To quantify differential gene expression within E. coli operons, we compared the base counts of TUs within the same operon under the same growth condition and tabulated the complexity that arises from internal promoters and terminators (see Table S6 in the supplemental material). Of 548 complex operons displaying multiple TUs due to having multiple promoters or terminators (Fig. 4), 327 showed more than 2-fold differential expression of 1 TU compared to other TUs within the same operon (see Table S6). Of 633 operons containing more than one gene, we observed 2-fold or greater differential gene expression within 315 operons (e.g., see Fig. 4). In the case of polycistronic operons that have only a single promoter and terminator, it appears that differential decay of the processed transcripts is responsible. In total, 43% (642 of 1,510) of all E. coli operons show a complex gene expression regulatory pattern (see Table S6). Clearly, differential expression of TUs and genes within the same operon is common in E. coli.
Our analyses provided the opportunity to map potential AS transcription across the transcriptome. In many cases, AS transcripts completely overlap and are complementary to sense strand transcripts that encode proteins; however, these AS transcripts do not appear to encode proteins. For example, the long AS RNA that is complementary to sulA does not appear to be translated, because it has no properly positioned ribosome binding site nearby a start codon and thus is likely to be a long noncoding RNA (lncRNA). We found 18 transcripts for annotated protein-coding genes and small RNAs that completely overlap operons transcribed in the opposite direction (see Table S5). As a result of this arrangement, the 18 corresponding operons contain long noncoding AS transcripts that overlap the coding sequences on the opposite strand.
Since genome annotation relies heavily on identification of coding sequences, we predicted that our transcriptome analysis would reveal unannotated genes. Indeed, we identified 96 transcripts that do not correspond to genes on the reference genome and were previously unannotated in E. coli K-12 (see Table S5). These include 89 AS transcripts that have an average length of 397 bases, the longest of which is 1,168 bases. The remaining 7 transcripts are completely intergenic and do not overlap annotated genes. None of the 96 transcripts appear to code for protein because they all have multiple stop codons in all three reading frames. Of the 89 AS transcripts, 21 are convergent with known operons that code for proteins, 7 are divergent with mapped operons, and 40 completely overlap annotated operons. The remaining 21 AS transcripts overlap known genes that could not be annotated into operons by RNA-Seq. The genomic regions corresponding to 72% of these lncRNAs are highly conserved in >50 E. coli and Shigella genomes. It was proposed previously that bacterial lncRNAs may be functional (30, 34), yet this was questioned by others (25). Similar lncRNAs have also been found in eukaryotes, and although they are not well understood, they are thought to play a role in regulating gene expression (70).
A recent study of terminator efficiency showed that only 3% of E. coli terminators are “strong” (71). Inefficient termination would explain how convergent operons sometimes have overlapping transcription (19, 20). Therefore, we tested the hypothesis that partial termination between convergent operons would generate complementary 3′ transcript ends and add further complexity to the transcriptome. Figure 1 shows an intrinsic terminator located between convergent operons, which terminates transcription by 4-fold yet allows readthrough transcription of 329 bases of AS RNA for the 3′ end of the convergent operon transcript. Our analyses of 370 instances of convergent operons revealed that 75% show transcription into an adjacent operon to generate complementary 3′ transcript ends that overlap by an average of 286 bases, the longest of which is 1,395 bases (see Table S5). In genome regions where there are many highly transcribed operons, it is more likely to observe convergent transcription. Of the genome regions corresponding to these convergent operons, 74% are highly conserved at the nucleotide sequence level in >50 E. coli (and Shigella) complete genomes. It is thus reasonable to suggest that overlapping transcription of convergent operons is a general property in bacteria.
Transcription of divergent operons can result in overlapping transcripts (17, 18). Complementary transcripts generated by divergent promoters recently have been called “excludons,” which are thought to act as negative regulators of genes on the opposite strand (34). Our analyses of 388 instances of divergent operons revealed that 35% have promoters arranged such that their 5′ transcript ends overlap by an average of 168 bases, the longest of which is 1,012 bases (see Table S5). The genome regions corresponding to 81% of these overlapping divergent operons are highly conserved in >50 E. coli (and Shigella) genomes. The finding of sequence conservation says nothing about functionality, but our finding that over one-third of divergent operons generate overlapping complementary transcripts does suggest that excludons may be prevalent in bacteria.
Comparison to other data sets.
We compared our AS transcript annotations to other high-quality data sets using a conservative approach. We compared our data sets to highly expressed and experimentally verified AS transcripts from those studies. A contemporaneous single-nucleotide analysis of the E. coli transcriptome by Storz, Sharma, and colleagues (submitted for publication) focused on AS transcripts. They found that most previously annotated sRNAs are present at high levels, so we compared our AS RNA data set to the most highly expressed AS RNAs in their study. Our data corroborate 74 of their 127 highest-expressed AS RNAs. Furthermore, we corroborated 6 of 14 candidate AS RNAs tested on Northern blots by the Storz group. However, while their gels verified 6 of the 14, we corroborated only 2 of those 6, indicating that there is substantial variability in these high-throughput data sets. A recent coimmunoprecipitation study of the double-stranded E. coli transcriptome revealed 316 double-stranded RNAs, including partially and fully overlapping transcripts as well as many generated by divergent and convergent operons (33). Our analyses predicted AS RNAs corresponding to 13 of 21 double-stranded RNAs that were verified in Northern blot analysis (33). It is tempting to speculate that AS RNAs that are corroborated by RNA-Seq studies, are verified by Northern blot analysis, and correspond to highly conserved genome sequences are functional. However, functions have been confirmed for only a limited number of AS RNAs (56, 72). It remains to be seen how many of the AS RNAs identified by RNA-Seq will prove to be expressed in the same cell as the sense transcript and display a yet unknown phenotype.
Bacterial operons compared to eukaryotic genes.
It did not escape our attention that the widespread occurrence of bacterial operons with multiple TUs in some ways resembles alternative splicing of eukaryotic transcripts. From both bacterial operons and eukaryotic genes arise primary transcripts that are divided into alternative transcripts by the activity of transcriptional regulatory features, i.e., internal promoters and terminators in bacteria and RNA splice junctions in eukaryotes. The potential for eukaryotic gene complexity is reflected in the number of exons per gene. The number of exons per gene in Saccharomyces cerevisiae is 1.1 (73), which is considerably fewer than the 1.7 TUs per operon in E. coli. In contrast, higher organisms have 4 to 9 introns per gene (74), making them more complex than E. coli. Perhaps the loss of exons that is proposed to have happened in budding yeasts during evolution from more primitive eukaryotes accentuates their difference from E. coli and higher organisms (75). We conclude that E. coli possesses operon complexity comparable to analogous gene structures in budding yeasts.
Concluding statement.
This study reveals the power of single-nucleotide resolved RNA-Seq data sets for pinpointing transcriptional features across the genome, which we used to annotate operons by precisely mapping their 5′ and 3′ ends. We found an astounding level of overlapping transcription where complementary RNAs are transcribed from both strands, such as those generated by several hundred convergent and divergent operons. We discovered more than 100 long AS transcripts overlapping operons that also were transcribed on the sense strand. In sum, we found that approximately one in three (519 out of 1,510) operons at least partially overlaps with other operons to generate AS RNA. These AS transcripts are highly conserved in E. coli and appear to be noncoding RNA, suggesting that they are involved in regulation of gene expression, as has been proposed for excludons in bacteria (34) and lncRNAs in eukaryotes (70). We also found 7 transcripts that did not correspond to an annotated gene and therefore represent previously unrecognized yet potentially functional operons. The transcriptome intricacy we observed in E. coli appears to be a general property of the domain bacteria, as the transcriptomes of several other bacteria appear to be similarly intricate (21, 26, 28, 31, 41, 47–49). Whether the same is true of the Archaea must await high-resolution RNA-Seq analysis of representatives of this domain of life (83). Since operon arrangements are more highly conserved than gene repertoires (76), it is interesting to speculate that the requirements of primordial life led to the evolution of an operon architecture in bacteria which accommodates substantial variation in gene expression.
MATERIALS AND METHODS
Bacterial strains and growth conditions.
To annotate operons and characterize their response to carbon starvation, wild-type E. coli BW38028 and E. coli BW39452 (ΔrpoS::cat) were grown in 1 liter of morpholinepropanesulfonic acid (MOPS) minimal medium (77) containing 0.2% glucose in a fermenter at 37°C with constant pH and aeration. MOPS medium solutions were modified as described elsewhere (78), which permits preparation of 40× “M” stock solution, giving the same final medium recipe (77). Cultures were sampled at 10 time points during growth of E. coli BW38028 and at five time points for E. coli BW39452, as shown in Fig. S1 in the supplemental material. Logarithmic- and stationary-phase samples were duplicated from replicate cultures.
RNA sequencing.
RNA was prepared by using an RNeasy kit (Qiagen, USA). Because small RNAs may be preferentially lost during column purification, they are likely underrepresented in our data sets. Replicates of logarithmic- and stationary-phase RNA were treated with Terminator 5′-phosphate-dependent exonuclease (Epicenter, USA) to enrich 5′-triphosphate mRNA fragments for TSS mapping. RNA sequencing libraries (see Table S1) were prepared by using the strand-specific, ligation-based SOLiD Total RNA-Seq kit. Paired-end sequencing was performed on the SOLiD 4 Genetic Analyzer at Purdue University Genomics Facility.
Raw data processing.
Sequence reads were aligned to the E. coli MG1655 reference genome (U00096.2) with Bowtie version 1.8 (79). For the first pass, we used paired-end color space mapping with a distance cutoff of 350 bases between read mates. Bowtie parameters were set to include only perfect matches and retained only one alignment where a read mapped to more than one genome location. In practice, we found the efficiency of paired-end mapping was between 3 and 10%. To improve the overall alignment, we mapped the orphan 5′- and 3′-end reads in two additional passes with Bowtie (one for the 5′ reads and one for the 3′ reads). The output of the three passes through Bowtie was three SAM files for each sample. Overall, we achieved 40 to 60% mapping efficiency with this three-pass strategy. SAMtools (80) utilities were used to convert SAM files to BAM format and to sort and index them. The binary read alignment (BAM) files were displayed in Integrated Genome Viewer (IGV version 2) for primary analysis and quality control. The BAM files were then converted to base count (WIG) files. We accomplished this by using an in-house script to extract strand-specific base count data from BAM files (outputs are positive- and negative-strand WIG files). First, our solidbam2wig.pl script reads in the paired-end BAM file and counts the nucleotides spanning inserts between the mated 5′ and 3′ reads. Next, the script pulls in the orphan 5′ and 3′ reads from the respective BAM files and increments the base counts at each base location without duplicating the reads already incremented from the paired ends. Base count data were then normalized based on the assumption that reads are randomly distributed across the genome and that if sequencing was sufficiently deep, all expressed transcripts would be represented in the data set (39). In practice, SOLiD sequencing did not generate data sets in which the lowest-abundance transcripts were fully covered by contiguous reads. In addition, inefficient ribo-depletion can bias the number of reads that map to non-rRNA genes. Our normalization strategy accounts for both of these factors by maximizing TU coverage and removing rRNA reads during data processing. Our in-house script, normWIG.pl, reads in the raw WIG files. A simple global normalization approach was utilized that multiplied the count at each base location by 1 billion and divides that value by the sum of base counts at all base locations in the file. This normalization strategy is analogous to the total count approach used for normalizing gene-specific read alignments (51). In this way, the base counts are expressed as parts per billion. For display in JBrowse (61), the normalized WIG files were converted to BIGWIG files by using SAMtools (80). Analysis of the data was conducted in a graphic user interface consisting of JBrowse (61) and an Oracle database.
SELEX.
Genomic SELEX was previously described (81). Antibodies against RpoD sigma, RpoS sigma, and core enzyme subunits were produced in rabbits by injecting purified sigma proteins (82).
Nucleotide sequence accession number.
RNA sequencing data and curated results were deposited at Gene Expression Omnibus, accession no. GSE52059.
SUPPLEMENTAL MATERIAL
RNA-Seq data sets.
Promoters.
Terminators.
Transcription units.
Overlaps.
Complexity analysis.
Growth conditions for total RNA sampling and base count data replicates. (A) Wild-type E. coli BW38028 was grown on MOPS glucose minimal medium in a 2-liter Biostat B fermenter (Braun Biotech) with a 1-liter working volume at 37°C, pH was kept constant at 7.4 by the addition of 1 M NaOH, and dissolved oxygen was maintained above 40% of saturation by adjusting the agitation speeds in the range of 270 to 500 rpm with fixed 1.5 liters/min airflow. Total RNA was prepared from culture samples taken at 10 time points, indicated by red arrows. Replicate samples from duplicate cultures were taken at times indicated by asterisks. (B) E. coli BW39452 (ΔrpoS::cat) grown as described for panel A; (C) normalized transcription unit (TU) usage values from replicate 1 plotted against values from replicate 2 for logarithmic-phase samples; (D) normalized TU usage values from replicate 1 plotted against values from replicate 2 for stationary-phase samples. All annotated TUs (see Table S2) are plotted. The trend line is shown as a solid black line. The correlations are R = 0.97 for stationary-phase samples and R = 0.96 for logarithmic-phase samples. Download
Genomic Selex data for RpoD RNA polymerase holoenzyme binding in vitro. Line heights corresponding to binding values are shown according to their binding locations on the genome, in base pairs. Download
Comparison of promoter usage to promoter metrics and TU usage. (A) Promoter motif score versus promoter usage; (B) promoter confidence score versus promoter usage; (C) TU usage versus promoter usage. Usage values were determined from normalized, log2 base count data, as described in detail in the text. Download
Complex yjeF-yjeE-amiB-mutL-miaA-hfq-hflX-hflK-hflC-yjeT-purA-nsrR-rnr-rlmB operon. This operon has 8 promoters and 4 terminators and contains 23 transcription units created by transcription initiation from S and I promoters, as well as termination and transcriptional readthrough at internal terminators. Download
ACKNOWLEDGMENTS
This work was funded primarily by U.S. Public Health Service NIH RC1GM09207 to B.L.W. and T.C. from 2009 to 2011. B.L.W. is currently supported by NSF award 106394. Additional support was from NIH GM095370 to T.C., Grants-in-Aid for Scientific Research 21710198 to T.S. and 17076016, 8310133, and 21241047 to A.I. from the Ministry of Education, Culture, Sports, Science and Technology of Japan, the Nano-Biology Project fund from Micro-Nanotechnology Research Center of Hosei University to A.I., Grant-in-Aid for Scientific Research 22241050 and 25250028, Japan Society for the Promotion of Science (JSPS), Grant-in-Aid for Scientific Research on Innovative Areas 25108716, the Ministry of Education, Culture, Sports, Science and Technology (MEXT), and Grant-in-Aid for Scientific Research on Priority Areas to H.M.
We thank Jay C. D. Hinton for helpful comments during manuscript preparation. We dedicate this work to the memory of Monica Riley (1926 to 2013), a true pioneer of E. coli genome annotation.
Footnotes
Citation Conway T, Creecy JP, Maddox SM, Grissom JE, Conkle TL, Shadid TM, Teramoto J, San Miguel P, Shimada T, Ishihama A, Mori H, Wanner BL. 2014. Unprecedented high-resolution view of bacterial operon architecture revealed by RNA sequencing. mBio 5(4):e01442-14. doi:10.1128/mBio.01442-14.
REFERENCES
- 1. Lederberg J, Tatum EL. 1946. Gene recombination in Escherichia coli. Nature 158:558. 10.1038/158558c0 [DOI] [PubMed] [Google Scholar]
- 2. Jacob F, Monod J. 1961. Genetic regulatory mechanisms in the synthesis of proteins. J. Mol. Biol. 3:318–356. 10.1016/S0022-2836(61)80072-7 [DOI] [PubMed] [Google Scholar]
- 3. Lehman IR, Bessman MJ, Simms ES, Kornberg A. 1958. Enzymatic synthesis of deoxyribonucleic acid. I. Preparation of substrates and partial purification of an enzyme from Escherichia coli. J. Biol. Chem. 233:163–170 [PubMed] [Google Scholar]
- 4. Lengyel P, Speyer JF, Ochoa S. 1961. Synthetic polynucleotides and the amino acid code. Proc. Natl. Acad. Sci. U. S. A. 47:1936–1942. 10.1073/pnas.47.12.1936 [DOI] [PMC free article] [PubMed] [Google Scholar]
- 5. Luria SE, Delbrück M. 1943. Mutations of bacteria from virus sensitivity to virus resistance. Genetics 28:491–511 [DOI] [PMC free article] [PubMed] [Google Scholar]
- 6. Arber W, Dussoix D. 1962. Host specificity of DNA produced by Escherichia coli. I. Host controlled modification of bacteriophage lambda. J. Mol. Biol. 5:18–36. 10.1016/S0022-2836(62)80058-8 [DOI] [PubMed] [Google Scholar]
- 7. Mulligan RC, Berg P. 1980. Expression of a bacterial gene in mammalian cells. Science 209:1422–1427. 10.1126/science.6251549 [DOI] [PubMed] [Google Scholar]
- 8. Kruger K, Grabowski PJ, Zaug AJ, Sands J, Gottschling DE, Cech TR. 1982. Self-splicing RNA: autoexcision and autocyclization of the ribosomal RNA intervening sequence of tetrahymena. Cell 31:147–157. 10.1016/0092-8674(82)90414-7 [DOI] [PubMed] [Google Scholar]
- 9. Boyer PD, Cross RL, Momsen W. 1973. A new concept for energy coupling in oxidative phosphorylation based on a molecular explanation of the oxygen exchange reactions. Proc. Natl. Acad. Sci. U. S. A. 70:2837–2839. 10.1073/pnas.70.10.2837 [DOI] [PMC free article] [PubMed] [Google Scholar]
- 10. Chang CN, Model P, Blobel G. 1979. Membrane biogenesis: cotranslational integration of the bacteriophage f1 coat protein into an Escherichia coli membrane fraction. Proc. Natl. Acad. Sci. U. S. A. 76:1251–1255. 10.1073/pnas.76.3.1251 [DOI] [PMC free article] [PubMed] [Google Scholar]
- 11. Blattner FR, Plunkett G, III, Bloch CA, Perna NT, Burland V, Riley M, Collado-Vides J, Glasner JD, Rode CK, Mayhew GF, Gregor J, Davis NW, Kirkpatrick HA, Goeden MA, Rose DJ, Mau B, Shao Y. 1997. The complete genome sequence of Escherichia coli K-12. Science 277:1453–1462. 10.1126/science.277.5331.1453 [DOI] [PubMed] [Google Scholar]
- 12. Riley M, Abe T, Arnaud MB, Berlyn MK, Blattner FR, Chaudhuri RR, Glasner JD, Horiuchi T, Keseler IM, Kosuge T, Mori H, Perna NT, Plunkett G, III, Rudd KE, Serres MH, Thomas GH, Thomson NR, Wishart D, Wanner BL. 2006. Escherichia coli K-12: a cooperatively developed annotation snapshot—2005. Nucleic Acids Res. 34:1–9. 10.1093/nar/gnj001 [DOI] [PMC free article] [PubMed] [Google Scholar]
- 13. Balázsi G, Barabási AL, Oltvai ZN. 2005. Topological units of environmental signal processing in the transcriptional regulatory network of Escherichia coli. Proc. Natl. Acad. Sci. U. S. A. 102:7841–7846. 10.1073/pnas.0500365102 [DOI] [PMC free article] [PubMed] [Google Scholar]
- 14. Price MN, Arkin AP, Alm EJ. 2006. The life-cycle of operons. PLoS Genet. 2:e96. 10.1371/journal.pgen.0020096 [DOI] [PMC free article] [PubMed] [Google Scholar]
- 15. Zhang H, Yin Y, Olman V, Xu Y. 2012. Genomic arrangement of regulons in bacterial genomes. PLoS One 7:e29496. 10.1371/journal.pone.0029496 [DOI] [PMC free article] [PubMed] [Google Scholar]
- 16. Taylor K, Hradecna Z, Szybalski W. 1967. Asymmetric distribution of the transcribing regions on the complementary strands of coliphage lambda DNA. Proc. Natl. Acad. Sci. U. S. A. 57:1618–1625. 10.1073/pnas.57.6.1618 [DOI] [PMC free article] [PubMed] [Google Scholar]
- 17. Piette J, Cunin R, Boyen A, Charlier D, Crabeel M, Van Vliet F, Glansdorff N, Squires C, Squires CL. 1982. The regulatory region of the divergent argECBH operon in Escherichia coli K-12. Nucleic Acids Res. 10:8031–8048. 10.1093/nar/10.24.8031 [DOI] [PMC free article] [PubMed] [Google Scholar]
- 18. Wek RC, Hatfield GW. 1986. Nucleotide sequence and in vivo expression of the ilvY and ilvC genes in Escherichia coli K-12. Transcription from divergent overlapping promoters. J. Biol. Chem. 261:2441–2450 [PubMed] [Google Scholar]
- 19. Nomura T, Aiba H, Ishihama A. 1985. Transcriptional organization of the convergent overlapping dnaQ-rnh genes of Escherichia coli. J. Biol. Chem. 260:7122–7125 [PubMed] [Google Scholar]
- 20. Sameshima JH, Wek RC, Hatfield GW. 1989. Overlapping transcription and termination of the convergent ilvA and ilvY genes of Escherichia coli. J. Biol. Chem. 264:1224–1231 [PubMed] [Google Scholar]
- 21. Sharma CM, Hoffmann S, Darfeuille F, Reignier J, Findeiss S, Sittka A, Chabas S, Reiche K, Hackermüller J, Reinhardt R, Stadler PF, Vogel J. 2010. The primary transcriptome of the major human pathogen Helicobacter pylori. Nature 464:250–255. 10.1038/nature08756 [DOI] [PubMed] [Google Scholar]
- 22. Selinger DW, Cheung KJ, Mei R, Johansson EM, Richmond CS, Blattner FR, Lockhart DJ, Church GM. 2000. RNA expression analysis using a 30 base pair resolution Escherichia coli genome array. Nat. Biotechnol. 18:1262–1268. 10.1038/82367 [DOI] [PubMed] [Google Scholar]
- 23. Dornenburg JE, Devita AM, Palumbo MJ, Wade JT. 2010. Widespread antisense transcription in Escherichia coli. mBio 1(1):e00024-10. 10.1128/mBio.00024-10 [DOI] [PMC free article] [PubMed] [Google Scholar]
- 24. Wade JT, Dornenburg JE, Devita AM, Palumbo MJ. 2010. Reply to “Concerns about recently identified widespread antisense transcription in Escherichia coli.” mBio 1(2):e00119-10. 10.1128/mBio.00119-10 [DOI] [PMC free article] [PubMed] [Google Scholar]
- 25. Raghavan R, Sloan DB, Ochman H. 2012. Antisense transcription is pervasive but rarely conserved in enteric bacteria. mBio 3(4):e00156-12. 10.1128/mBio.00156-12 [DOI] [PMC free article] [PubMed] [Google Scholar]
- 26. Behrens S, Widder S, Mannala GK, Qing X, Madhugiri R, Kefer N, Mraheil MA, Rattei T, Hain T. 2014. Ultra deep sequencing of Listeria monocytogenes sRNA transcriptome revealed new antisense RNAs. PLoS One 9:e83979. 10.1371/journal.pone.0083979 [DOI] [PMC free article] [PubMed] [Google Scholar]
- 27. Chatterjee A, Johnson CM, Shu CC, Kaznessis YN, Ramkrishna D, Dunny GM, Hu WS. 2011. Convergent transcription confers a bistable switch in Enterococcus faecalis conjugation. Proc. Natl. Acad. Sci. U. S. A. 108:9721–9726. 10.1073/pnas.1101569108 [DOI] [PMC free article] [PubMed] [Google Scholar]
- 28. Güell M, van Noort V, Yus E, Chen WH, Leigh-Bell J, Michalodimitrakis K, Yamada T, Arumugam M, Doerks T, Kühner S, Rode M, Suyama M, Schmidt S, Gavin AC, Bork P, Serrano L. 2009. Transcriptome complexity in a genome-reduced bacterium. Science 326:1268–1271. 10.1126/science.1176951 [DOI] [PubMed] [Google Scholar]
- 29. Kröger C, Dillon SC, Cameron AD, Papenfort K, Sivasankaran SK, Hokamp K, Chao Y, Sittka A, Hébrard M, Händler K, Colgan A, Leekitcharoenphon P, Langridge GC, Lohan AJ, Loftus B, Lucchini S, Ussery DW, Dorman CJ, Thomson NR, Vogel J, Hinton JC. 2012. The transcriptional landscape and small RNAs of Salmonella enterica serovar Typhimurium. Proc. Natl. Acad. Sci. U. S. A. 109:E1277–E1286. 10.1073/pnas.1201061109 [DOI] [PMC free article] [PubMed] [Google Scholar]
- 30. Lasa I, Toledo-Arana A, Dobin A, Villanueva M, de los Mozos IR, Vergara-Irigaray M, Segura V, Fagegaltier D, Penadés JR, Valle J, Solano C, Gingeras TR. 2011. Genome-wide antisense transcription drives mRNA processing in bacteria. Proc. Natl. Acad. Sci. U. S. A. 108:20172–20177. 10.1073/pnas.1113521108 [DOI] [PMC free article] [PubMed] [Google Scholar]
- 31. Passalacqua KD, Varadarajan A, Weist C, Ondov BD, Byrd B, Read TD, Bergman NH. 2012. Strand-specific RNA-seq reveals ordered patterns of sense and antisense transcription in Bacillus anthracis. PLoS One 7:e43350. 10.1371/journal.pone.0043350 [DOI] [PMC free article] [PubMed] [Google Scholar]
- 32. Wurtzel O, Sesto N, Mellin JR, Karunker I, Edelheit S, Bécavin C, Archambaud C, Cossart P, Sorek R. 2012. Comparative transcriptomics of pathogenic and nonpathogenic Listeria species. Mol. Syst. Biol. 8:583. 10.1038/msb.2012.11 [DOI] [PMC free article] [PubMed] [Google Scholar]
- 33. Lybecker M, Zimmermann B, Bilusic I, Tukhtubaeva N, Schroeder R. 2014. The double-stranded transcriptome of Escherichia coli. Proc. Natl. Acad. Sci. U. S. A. 111:3134–3139. 10.1073/pnas.1315974111 [DOI] [PMC free article] [PubMed] [Google Scholar]
- 34. Sesto N, Wurtzel O, Archambaud C, Sorek R, Cossart P. 2013. The excludon: a new concept in bacterial antisense RNA-mediated gene regulation. Nat. Rev. Microbiol. 11:75–82. 10.1038/nrmicro2934 [DOI] [PubMed] [Google Scholar]
- 35. Cho BK, Zengler K, Qiu Y, Park YS, Knight EM, Barrett CL, Gao Y, Palsson BØ. 2009. The transcription unit architecture of the Escherichia coli genome. Nat. Biotechnol. 27:1043–1049. 10.1038/nbt.1582 [DOI] [PMC free article] [PubMed] [Google Scholar]
- 36. Kim D, Hong JS, Qiu Y, Nagarajan H, Seo JH, Cho BK, Tsai SF, Palsson BØ. 2012. Comparative analysis of regulatory elements between Escherichia coli and Klebsiella pneumoniae by genome-wide transcription start site profiling. PLoS Genet. 8:e1002867. 10.1371/journal.pgen.1002867 [DOI] [PMC free article] [PubMed] [Google Scholar]
- 37. Mendoza-Vargas A, Olvera L, Olvera M, Grande R, Vega-Alvarado L, Taboada B, Jimenez-Jacinto V, Salgado H, Juárez K, Contreras-Moreira B, Huerta AM, Collado-Vides J, Morett E. 2009. Genome-wide identification of transcription start sites, promoters and transcription factor binding sites in E. coli. PLoS One 4:e7526. 10.1371/journal.pone.0007526 [DOI] [PMC free article] [PubMed] [Google Scholar]
- 38. Salgado H, Peralta-Gil M, Gama-Castro S, Santos-Zavaleta A, Muñiz-Rascado L, García-Sotelo JS, Weiss V, Solano-Lira H, Martínez-Flores I, Medina-Rivera A, Salgado-Osorio G, Alquicira-Hernández S, Alquicira-Hernández K, López-Fuentes A, Porrón-Sotelo L, Huerta AM, Bonavides-Martínez C, Balderas-Martínez YI, Pannier L, Olvera M, Labastida A, Jiménez-Jacinto V, Vega-Alvarado L, Del Moral-Chávez V, Hernández-Alvarez A, Morett E, Collado-Vides J. 2013. RegulonDB v8.0: omics data sets, evolutionary conservation, regulatory phrases, cross-validated gold standards and more. Nucleic Acids Res. 41:D203–D213. 10.1093/nar/gkt1054 [DOI] [PMC free article] [PubMed] [Google Scholar]
- 39. Haas BJ, Chin M, Nusbaum C, Birren BW, Livny J. 2012. How deep is deep enough for RNA-Seq profiling of bacterial transcriptomes? BMC Genomics 13:734. 10.1186/1471-2164-13-734 [DOI] [PMC free article] [PubMed] [Google Scholar]
- 40. Li S, Dong X, Su Z. 2013. Directional RNA-seq reveals highly complex condition-dependent transcriptomes in E. coli K-12 through accurate full-length transcripts assembling. BMC Genomics 14:520. 10.1186/1471-2164-14-520 [DOI] [PMC free article] [PubMed] [Google Scholar]
- 41. Kröger C, Colgan A, Srikumar S, Händler K, Sivasankaran SK, Hammarlöf DL, Canals R, Grissom JE, Conway T, Hokamp K, Hinton JC. 2013. An infection-relevant transcriptomic compendium for Salmonella enterica serovar Typhimurium. Cell Host Microbe 14:683–695. 10.1016/j.chom.2013.11.010 [DOI] [PubMed] [Google Scholar]
- 42. Fabich AJ, Jones SA, Chowdhury FZ, Cernosek A, Anderson A, Smalley D, McHargue JW, Hightower GA, Smith JT, Autieri SM, Leatham MP, Lins JJ, Allen RL, Laux DC, Cohen PS, Conway T. 2008. Comparison of carbon nutrition for pathogenic and commensal Escherichia coli strains in the mouse intestine. Infect. Immun. 76:1143–1152. 10.1128/IAI.01386-07 [DOI] [PMC free article] [PubMed] [Google Scholar]
- 43. Levin JZ, Yassour M, Adiconis X, Nusbaum C, Thompson DA, Friedman N, Gnirke A, Regev A. 2010. Comprehensive comparative analysis of strand-specific RNA sequencing methods. Nat. Methods 7:709–715. 10.1038/nmeth.1491 [DOI] [PMC free article] [PubMed] [Google Scholar]
- 44. Richmond CS, Glasner JD, Mau R, Jin H, Blattner FR. 1999. Genome-wide expression profiling in Escherichia coli K-12. Nucleic Acids Res. 27:3821–3835. 10.1093/nar/27.19.3821 [DOI] [PMC free article] [PubMed] [Google Scholar]
- 45. Tao H, Bausch C, Richmond C, Blattner FR, Conway T. 1999. Functional genomics: expression analysis of Escherichia coli growing on minimal and rich media. J. Bacteriol. 181:6425–6440 [DOI] [PMC free article] [PubMed] [Google Scholar]
- 46. Reference deleted. [Google Scholar]
- 47. Lin YF, A DR, Guan S, Mamanova L, McDowall KJ. 2013. A combination of improved differential and global RNA-seq reveals pervasive transcription initiation and events in all stages of the life-cycle of functional RNAs in Propionibacterium acnes, a major contributor to wide-spread human disease. BMC Genomics 14:620. 10.1186/1471-2164-14-620 [DOI] [PMC free article] [PubMed] [Google Scholar]
- 48. Wiegand S, Dietrich S, Hertel R, Bongaerts J, Evers S, Volland S, Daniel R, Liesegang H. 2013. RNA-Seq of Bacillus licheniformis: active regulatory RNA features expressed within a productive fermentation. BMC Genomics 14:667. 10.1186/1471-2164-14-667 [DOI] [PMC free article] [PubMed] [Google Scholar]
- 49. Balasubramanian D, Kumari H, Jaric M, Fernandez M, Turner KH, Dove SL, Narasimhan G, Lory S, Mathee K. 2014. Deep sequencing analyses expands the Pseudomonas aeruginosa AmpR regulon to include small RNA-mediated regulation of iron acquisition, heat shock and oxidative stress response. Nucleic Acids Res. 42:979–998. 10.1093/nar/gkt942 [DOI] [PMC free article] [PubMed] [Google Scholar]
- 50. Bohannon DE, Connell N, Keener J, Tormo A, Espinosa-Urgel M, Zambrano MM, Kolter R. 1991. Stationary-phase-inducible “gearbox” promoters: differential effects of katF mutations and role of sigma 70. J. Bacteriol. 173:4482–4492 [DOI] [PMC free article] [PubMed] [Google Scholar]
- 51. Dillies MA, Rau A, Aubert J, Hennequet-Antier C, Jeanmougin M, Servant N, Keime C, Marot G, Castel D, Estelle J, Guernec G, Jagla B, Jouneau L, Laloe D, Le Gall C, Schaeffer B, Le Crom S, Guedj M, Jaffrezic F. 2012. A comprehensive evaluation of normalization methods for Illumina high-throughput RNA sequencing data analysis. Brief. Bioinform. 14:671–683. 10.1093/bib/bbs046 [DOI] [PubMed] [Google Scholar]
- 52. Egan SE, Fliege R, Tong S, Shibata A, Wolf RE, Jr, Conway T. 1992. Molecular characterization of the Entner-Doudoroff pathway in Escherichia coli: sequence analysis and localization of promoters for the edd-eda operon. J. Bacteriol. 174:4638–4646 [DOI] [PMC free article] [PubMed] [Google Scholar]
- 53. Deana A, Celesnik H, Belasco JG. 2008. The bacterial enzyme RppH triggers messenger RNA degradation by 5′ pyrophosphate removal. Nature 451:355–358. 10.1038/nature06475 [DOI] [PubMed] [Google Scholar]
- 54. Tompa M, Li N, Bailey TL, Church GM, De Moor B, Eskin E, Favorov AV, Frith MC, Fu Y, Kent WJ, Makeev VJ, Mironov AA, Noble WS, Pavesi G, Pesole G, Régnier M, Simonis N, Sinha S, Thijs G, van Helden J, Vandenbogaert M, Weng Z, Workman C, Ye C, Zhu Z. 2005. Assessing computational tools for the discovery of transcription factor binding sites. Nat. Biotechnol. 23:137–144. 10.1038/nbt1053 [DOI] [PubMed] [Google Scholar]
- 55. Shimada T, Yamamoto K, Ishihama A. 2011. Novel members of the cra regulon involved in carbon metabolism in Escherichia coli. J. Bacteriol. 193:649–659. 10.1128/JB.01214-10 [DOI] [PMC free article] [PubMed] [Google Scholar]
- 56. Thomason MK, Storz G. 2010. Bacterial antisense RNAs: how many are there, and what are they doing? Annu. Rev. Genet. 44:167–188. 10.1146/annurev-genet-102209-163523 [DOI] [PMC free article] [PubMed] [Google Scholar]
- 57. Tuerk C, MacDougal S, Gold L. 1992. RNA pseudoknots that inhibit human immunodeficiency virus type 1 reverse transcriptase. Proc. Natl. Acad. Sci. U. S. A. 89:6988–6992. 10.1073/pnas.89.15.6988 [DOI] [PMC free article] [PubMed] [Google Scholar]
- 58. Grant CE, Bailey TL, Noble WS. 2011. FIMO: scanning for occurrences of a given motif. Bioinformatics 27:1017-1018. 10.1093/bioinformatics/btr064 [DOI] [PMC free article] [PubMed] [Google Scholar]
- 59. Robison K, McGuire AM, Church GM. 1998. A comprehensive library of DNA-binding site matrices for 55 proteins applied to the complete Escherichia coli K-12 genome. J. Mol. Biol. 284:241–254. 10.1006/jmbi.1998.2160 [DOI] [PubMed] [Google Scholar]
- 60. Mitchell JE, Zheng D, Busby SJ, Minchin SD. 2003. Identification and analysis of “extended −10” promoters in Escherichia coli. Nucleic Acids Res. 31:4689–4695. 10.1093/nar/gkg694 [DOI] [PMC free article] [PubMed] [Google Scholar]
- 61. Skinner ME, Uzilov AV, Stein LD, Mungall CJ, Holmes IH. 2009. JBrowse: a next-generation genome browser. Genome Res. 19:1630-1638. 10.1101/gr.094607.109 [DOI] [PMC free article] [PubMed] [Google Scholar]
- 62. Bernstein JA, Khodursky AB, Lin PH, Lin-Chao S, Cohen SN. 2002. Global analysis of mRNA decay and abundance in Escherichia coli at single-gene resolution using two-color fluorescent DNA microarrays. Proc. Natl. Acad. Sci. U. S. A. 99:9697–9702. 10.1073/pnas.112318199 [DOI] [PMC free article] [PubMed] [Google Scholar]
- 63. Kingsford CL, Ayanbule K, Salzberg SL. 2007. Rapid, accurate, computational discovery of Rho-independent transcription terminators illuminates their relationship to DNA uptake. Genome Biol. 8:R22. 10.1186/gb-2007-8-2-r22 [DOI] [PMC free article] [PubMed] [Google Scholar]
- 64. Potrykus K, Murphy H, Chen X, Epstein JA, Cashel M. 2010. Imprecise transcription termination within Escherichia coli greA leader gives rise to an array of short transcripts, GraL. Nucleic Acids Res. 38:1636–1651. 10.1093/nar/gkp1150 [DOI] [PMC free article] [PubMed] [Google Scholar]
- 65. Benson DA, Clark K, Karsch-Mizrachi I, Lipman DJ, Ostell J, Sayers EW. 2014. GenBank. Nucleic Acids Res. 42:D32–D37. 10.1093/nar/gkt1030 [DOI] [PMC free article] [PubMed] [Google Scholar]
- 66. Cole ST, Honoré N. 1989. Transcription of the sulA-ompA region of Escherichia coli during the SOS response and the role of an antisense RNA molecule. Mol. Microbiol. 3:715–722. 10.1111/j.1365-2958.1989.tb00220.x [DOI] [PubMed] [Google Scholar]
- 67. Michán C, Manchado M, Dorado G, Pueyo C. 1999. In vivo transcription of the Escherichia coli oxyR regulon as a function of growth phase and in response to oxidative stress. J. Bacteriol. 181:2759–2764 [DOI] [PMC free article] [PubMed] [Google Scholar]
- 68. Vecerek B, Moll I, Bläsi U. 2007. Control of fur synthesis by the non-coding RNA RyhB and iron-responsive decoding. EMBO J. 26:965–975. 10.1038/sj.emboj.7601553 [DOI] [PMC free article] [PubMed] [Google Scholar]
- 69. Cunningham L, Guest JR. 1998. Transcription and transcript processing in the sdhCDAB-sucABCD operon of Escherichia coli. Microbiology 144(Part 8):2113–2123. 10.1099/00221287-144-8-2113 [DOI] [PubMed] [Google Scholar]
- 70. Ponting CP, Oliver PL, Reik W. 2009. Evolution and functions of long noncoding RNAs. Cell 136:629–641. 10.1016/j.cell.2009.02.006 [DOI] [PubMed] [Google Scholar]
- 71. Chen YJ, Liu P, Nielsen AA, Brophy JA, Clancy K, Peterson T, Voigt CA. 2013. Characterization of 582 natural and synthetic terminators and quantification of their design constraints. Nat. Methods 10:659–664. 10.1038/nmeth.2515 [DOI] [PubMed] [Google Scholar]
- 72. Georg J, Hess WR. 2011. Cis-antisense RNA, another level of gene regulation in bacteria. Microbiol. Mol. Biol. Rev. 75:286–300. 10.1128/MMBR.00032-10 [DOI] [PMC free article] [PubMed] [Google Scholar]
- 73. Juneau K, Miranda M, Hillenmeyer ME, Nislow C, Davis RW. 2006. Introns regulate RNA and protein abundance in yeast. Genetics 174:511–518. 10.1534/genetics.106.058560 [DOI] [PMC free article] [PubMed] [Google Scholar]
- 74. Koralewski TE, Krutovsky KV. 2011. Evolution of exon-intron structure and alternative splicing. PLoS One 6:e18055. 10.1371/journal.pone.0018055 [DOI] [PMC free article] [PubMed] [Google Scholar]
- 75. Carmel L, Rogozin IB, Wolf YI, Koonin EV. 2007. Patterns of intron gain and conservation in eukaryotic genes. BMC Evol. Biol. 7:192. 10.1186/1471-2148-7-192 [DOI] [PMC free article] [PubMed] [Google Scholar]
- 76. Rocha EP. 2008. The organization of the bacterial genome. Annu. Rev. Genet. 42:211–233. 10.1146/annurev.genet.42.110807.091653 [DOI] [PubMed] [Google Scholar]
- 77. Neidhardt FC, Bloch PL, Smith DF. 1974. Culture medium for enterobacteria. J. Bacteriol. 119:736–747 [DOI] [PMC free article] [PubMed] [Google Scholar]
- 78. Wilmes-Riesenberg MR, Wanner BL. 1992. TnphoA and TnphoA’ elements for making and switching fusions for study of transcription, translation, and cell surface localization. J. Bacteriol. 174:4558–4575 [DOI] [PMC free article] [PubMed] [Google Scholar]
- 79. Langmead B, Trapnell C, Pop M, Salzberg SL. 2009. Ultrafast and memory-efficient alignment of short DNA sequences to the human genome. Genome Biol. 10:R25. 10.1186/gb-2009-10-3-r25 [DOI] [PMC free article] [PubMed] [Google Scholar]
- 80. Li H, Handsaker B, Wysoker A, Fennell T, Ruan J, Homer N, Marth G, Abecasis G, Durbin R, 1000 Genome Project Data Processing Subgroup 2009. The sequence alignment/map format and SAMtools. Bioinformatics 25:2078–2079. 10.1093/bioinformatics/btp352 [DOI] [PMC free article] [PubMed] [Google Scholar]
- 81. Shimada T, Fujita N, Maeda M, Ishihama A. 2005. Systematic search for the cra-binding promoters using genomic SELEX system. Genes Cells 10:907–918. 10.1111/j.1365-2443.2005.00888.x [DOI] [PubMed] [Google Scholar]
- 82. Jishage M, Ishihama A. 1995. Regulation of RNA polymerase sigma subunit synthesis in Escherichia coli: intracellular levels of sigma 70 and sigma 38. J. Bacteriol. 177:6832–6835 [DOI] [PMC free article] [PubMed] [Google Scholar]
- 83. Wurtzel O, Sapra R, Chen F, Zhu Y, Simmons BA, Sorek R. 2010. A single-base resolution map of an archaeal transcriptome. Genome Res. 20:133–141 [DOI] [PMC free article] [PubMed] [Google Scholar]
Associated Data
This section collects any data citations, data availability statements, or supplementary materials included in this article.
Supplementary Materials
RNA-Seq data sets.
Promoters.
Terminators.
Transcription units.
Overlaps.
Complexity analysis.
Growth conditions for total RNA sampling and base count data replicates. (A) Wild-type E. coli BW38028 was grown on MOPS glucose minimal medium in a 2-liter Biostat B fermenter (Braun Biotech) with a 1-liter working volume at 37°C, pH was kept constant at 7.4 by the addition of 1 M NaOH, and dissolved oxygen was maintained above 40% of saturation by adjusting the agitation speeds in the range of 270 to 500 rpm with fixed 1.5 liters/min airflow. Total RNA was prepared from culture samples taken at 10 time points, indicated by red arrows. Replicate samples from duplicate cultures were taken at times indicated by asterisks. (B) E. coli BW39452 (ΔrpoS::cat) grown as described for panel A; (C) normalized transcription unit (TU) usage values from replicate 1 plotted against values from replicate 2 for logarithmic-phase samples; (D) normalized TU usage values from replicate 1 plotted against values from replicate 2 for stationary-phase samples. All annotated TUs (see Table S2) are plotted. The trend line is shown as a solid black line. The correlations are R = 0.97 for stationary-phase samples and R = 0.96 for logarithmic-phase samples. Download
Genomic Selex data for RpoD RNA polymerase holoenzyme binding in vitro. Line heights corresponding to binding values are shown according to their binding locations on the genome, in base pairs. Download
Comparison of promoter usage to promoter metrics and TU usage. (A) Promoter motif score versus promoter usage; (B) promoter confidence score versus promoter usage; (C) TU usage versus promoter usage. Usage values were determined from normalized, log2 base count data, as described in detail in the text. Download
Complex yjeF-yjeE-amiB-mutL-miaA-hfq-hflX-hflK-hflC-yjeT-purA-nsrR-rnr-rlmB operon. This operon has 8 promoters and 4 terminators and contains 23 transcription units created by transcription initiation from S and I promoters, as well as termination and transcriptional readthrough at internal terminators. Download