

Abstract
Tyrosine kinase 2 (TYK2) is a member of the Janus kinase (JAK) family of non-receptor tyrosine kinases, which are essential for proper signaling in immune responses and development. Here we present a 2.0 angstrom resolution crystal structure of a receptor-binding fragment of human TYK2 encompassing the FERM and SH2 domains in complex with a so-called “box2” containing intracellular peptide motif from the IFNα receptor (IFNAR1). The TYK2–IFNAR1 interface reveals an unexpected receptor-binding mode that mimics a SH2 domain–phosphopeptide interaction, with a glutamate replacing the canonical phosphotyrosine residue. This structure provides the first view to our knowledge of a JAK in complex with its cognate receptor and defines the molecular logic through which JAKs evolved to interact with divergent receptor sequences.
Introduction
Janus kinases (JAKs) are essential mediators of cytokine and interferon signaling through type I and II cytokine receptors, and drive processes as diverse as adaptive immune functions and hematopoiesis to metabolism and cellular growth1. The four JAK family members (JAK1, JAK2, JAK3, and TYK2) are large multidomain kinases that lack a transmembrane component and instead constitutively associate with membrane proximal peptide motifs found on the intracellular side of cytokine receptors2. JAKs share a common domain structure, containing N-terminal FERM and SH2-like domains that mediate receptor interactions, and C-terminal pseudokinase and kinase domains that regulate kinase activity. Ligand-induced dimerization of two JAK-bound receptors initiates kinase activation and a signaling cascade that ultimately results in dimerization and activation of the STAT transcription factors and transcription of cytokine-responsive genes1. Given their critical importance in immune and growth factor pathways, JAK mutations can be found in human ailments such as immunodeficiency syndromes and myeloproliferative diseases3, and therapeutic JAK inhibition has been explored for immune disorders and cancer4.
Given the non-covalent association of JAKs with cytokine receptors, the receptor–JAK interaction is a critical link between extracellular ligand-mediated receptor dimerization and activation of signaling. Receptor intracellular sequences are key for both JAK tethering and regulation of kinase activity2, yet molecular details of the linkage mechanism remain enigmatic. Important clues can be gathered from in vitro studies showing that both the JAK FERM and SH2-like domains play key structural roles in receptor binding5–9 and mediate specific association with two receptor peptide motifs termed “box1” and “box2”10. Box1 is a membrane-proximal proline-rich segment, while the hydrophobic box2 motif follows 10 to 40 residues downstream. Many studies implicate receptor box1 and box2 sequences in JAK association and kinase activation10–17, and regions outside box1 and box2 are also important for JAK interaction11, 13, 15, 18. Unfortunately, the poor conservation of receptor intracellular sequences and a lack of structural information makes it impossible to decipher the receptor “code” that enables interaction of an individual JAK with specific receptors. In other words, how four JAK family members interact with and are activated by greater than thirty different cytokine receptors with exquisite affinity and specificity remains a fundamental question in the field.
The type 1 interferons are a family of sixteen distinct cytokines involved in the triggering of innate immune responses against viral and bacterial infection19, 20. In addition to their critical importance in the pathogen response, members of the IFNα and β family are important regulators of tumor immunity21 and play a significant role in the pathophysiology of autoimmune diseases22. All Type 1 interferons initiate signaling through dimerization of the IFNAR1 and IFNAR2 receptors, whose intracellular domains are associated with TYK2 and JAK1, respectively. The connection between TYK2 and IFNAR1 was one of the first JAK–receptor relationships to be genetically and biochemically characterized23–25, and is unique in that TYK2 has been shown to be required for IFNAR1 cellular trafficking in vivo25, 26. Additionally, a peptide sequence within the intracellular domain of IFNAR1 (residues 465 to 511) is necessary for the interaction with TYK2 as well as TYK2 signaling13. Within this IFNAR1 fragment, the box2 motif as well as a number of residues along a 20-residue section are necessary for TYK2 binding, suggesting multiple amino acid contacts along the length of this peptide mediate interaction with TYK2.
There are currently no crystal structures available for any JAK bound to a cytokine receptor, which has severely limited interpretation of receptor interaction sequences as well as understanding mechanisms of JAK activation. To address these fundamental questions, we set out to determine the structure of the FERM and SH2-like domains from human TYK2 in complex with a peptide from IFNAR1 that is necessary and sufficient for signaling through the type 1 interferon receptor system. This structure provides a model for the highly unique and conserved mechanism by which JAKs interact with their cognate receptors, and suggests an unexpected evolutionary path for JAK-associated receptor signaling systems.
Results
The structure of the TYK2 FERM–SH2 receptor-binding domain
JAKs in general have proven to be difficult crystallography targets due to poor solubility when expressed and purified alone27. Given their constitutive association with cytokine receptors in vivo, we reasoned that the JAK FERM and SH2-like receptor binding domains (FERM–SH2) require a receptor peptide for in vitro stability. Taking advantage of biochemical studies delineating the region of the IFNAR1 intracellular domain required for TYK2 binding13, we cloned and expressed the human TYK2 FERM–SH2 (residues 23–583) as a fusion protein connected to this IFNAR1 fragment (residues 465–512) (Fig. 1a). This construct provided high levels of stable, monodisperse protein, while the TYK2 fragment by itself was poorly behaved when assessed by size exclusion chromatography (SEC) (Supplementary Fig. 1). To ensure that the IFNAR1 peptide was constitutively associated with the TYK2 FERM–SH2, a construct containing a site-specific protease cleavage site within the linker between TYK2 and the IFNAR1 peptide was cleaved and the TYK2–IFNAR1 complex analyzed by SEC (Supplementary Fig. 1). Peptide association was then validated by SDS–PAGE and mass spectrometry (Supplementary Fig. 1). The TYK2 FERM–SH2 and IFNAR1 peptide co-migrated on the size exclusion column, confirming that the IFNAR1 peptide was bound to TYK2 in solution. Using an analogous TYK2–IFNAR1 construct containing a non-cleavable linker, we crystallized the complex and obtained a native dataset at 2.0 Å resolution (Table 1 and Supplementary Fig. 2). Phases were obtained by Au- and Pt-derivatization of native crystals and the structure solved using the single-wavelength anomalous dispersion (SAD) method (see Online Methods).
Figure 1. The structure of the TYK2 FERM–SH2 receptor binding module in complex with IFNAR1.

(a) Schematic diagram of TYK2 and IFNAR1 showing the domains linked to generate expression constructs. TYK2 pseudokinase and kinase domains are noted ϕ–KD and KD. IFNAR1 FNIII-like subdomains are noted as SD1 to SD4, transmembrane region as TM, and box1 and box2 as 1 and 2, respectively. (b, c) The structure of the TYK2–IFNAR1 complex from two perspectives. In (b), a cartoon representation shows the interaction between TYK2 and IFNAR1. The FERM domain is colored in red, with the F1, F2, and F3 subdomains labeled. The SH2 domain is colored in blue, and IFNAR1 is colored in yellow. N- and C-termini are labeled N and C, respectively. Surface representation (c) of TYK2 FERM–SH2 is rotated 90° with the IFNAR1 peptide shown as a stick model with overlaid electron density (contoured at 1.0σ) displayed in yellow. (d) Electrostatic surface potential for the TYK2 FERM–SH2 structure, contoured at −5 to 5 kT/e. (e) The inset box shows a detailed view of the α2′, α2″, and α3 helices of the F2 subdomain, with basic sidechains shown as sticks and colored in light blue. Electrostatic surface potential is shown as a transparent surface.
Table 1.
Data collection and refinement statistics
| Native | KAu(CN)2 | K2PtCl4 | SeMet | |
|---|---|---|---|---|
| Data collection | SSRL 12-2 | SSRL 11-1 | SSRL 11-1 | SSRL 11-1 |
| Wavelength (Å) | 0.9795 | 1.0378 | 1.0716 | 0.9789 |
| Space group | C2 | C2 | C2 | C2 |
| Cell dimensions | ||||
| a, b, c (Å) | 186.8, 52.4, 70.2 | 179.9, 52.0, 70.0 | 184.2, 52.2, 70.4 | 168.8, 52.1, 70.0 |
| α, β, γ (°) | 90, 108.1, 90 | 90, 112.0, 90 | 90, 109.4, 90 | 90, 112.4, 90 |
| Resolution (Å) | 38.55–1.99 (2.10–1.99) | 37.96–2.88 (3.04–2.88) | 30–3.2 (3.31–3.20) | 39–3.3 (3.48–3.30) |
| Rmerge | 0.05 (0.62) | 0.07 (0.22) | 0.12 (0.23) | 0.14 (0.49) |
| I/σI | 15.5 (2.2) | 20.3 (6.3) | 19.2 (5.4) | 11.7 (4.0) |
| Completeness (%) | 96.4 (92.2) | 96.6 (81.2) | 98.0 (93.4) | 98.9 (98.4) |
| Redundancy | 3.4 (3.3) | 6.7 (5.8) | 6.6 (6.0) | 6.6 (6.5) |
| Wilson B-factor | 35.8 | |||
| Refinement statistics | ||||
| Resolution (Å) | 38.55–1.99 | |||
| Reflections (total/test) | 42,641/2137 | |||
| Rwork/Rfree (%) | 19.9/23.3% | |||
| Atoms | ||||
| Protein | 3969 | |||
| Water | 167 | |||
| Glycerol | 18 | |||
| R.M.S. deviations | ||||
| Bond lengths (Å) | 0.010 | |||
| Bond angles (°) | 1.05 | |||
| Mean B-factor (Å2) | 50.6 | |||
| Ramachandran statistics | ||||
| Most favored | 98% | |||
| Outliers | 0.2% | |||
Values in parentheses are for highest-resolution shell. KAu(CN)2 and K2PtCl4, heavy metal derivatives; SeMet, protein labeled with selenium-substituted methionine.
The data provided well-defined electron density for generation of a model of the FERM and SH2 domains as well as 19 residues from the IFNAR1 peptide (Table 1 and Fig. 1b–c), and reveals that the FERM and SH2 domains form a contiguous, Y-shaped receptor-binding module that interacts with the receptor peptide via a composite interface formed by the FERM F2 and SH2 domains. Analysis of the crystal packing demonstrates that the peptide is not part of a crystal contact, ruling out lattice-mediated stabilization of peptide in the structure (Supplementary Fig. 2).
The TYK2 FERM domain (residues 26–430) displays the tri-lobed cloverleaf structure found in FERM domains from the ezrin, radixin and moesin family 28–30 as well as focal adhesion kinase31 (Fig. 1b and Supplementary Fig. 3). Alignment of the TYK2 FERM with other JAK family members indicates that this overall domain structure is conserved among the four paralogs (Supplementary Fig. 3). The first subdomain (F1, residues 26–107) consists of a ubiquitin-like domain followed by a 37-residue insertion (L1) that interacts with the C-terminus of the SH2 domain as well as the IFNAR1 peptide (Supplementary Fig. 4). The second subdomain (F2, residues 145–271) is entirely helical and has homology to an Acyl-CoA-binding protein fold. An intriguing feature of this subdomain is a basic patch on the α2′, α2″, and α3 helices (Fig. 1d–e). These three helices contain 15 surface exposed basic residues, with nine of these positions conserved in at least three of the four human JAK family members (Supplementary Fig. 3). Given the positive surface charge of the F2 subdomain, we speculate that in vivo this region may lie in proximity to the phosphatidyl lipid headgroups of the plasma membrane. The third subdomain (F3, residues 272–430) retains the topology of a pleckstrin-homology (PH) domain, and contains two large disordered loops between the β1–β2 and β3–β4 strands (residues 296–308 and 330–370).
The SH2 domain of TYK2 (residues 452–551) interacts intimately with the FERM domain and is held in place next to the F1 lobe of the FERM by L1 as well as two SH2-flanking linkers (L2 and L3, residues 431–451 and 552–566, respectively) (Supplementary Fig. 4). The core of the TYK2 SH2 domain adopts a characteristic SH2 fold32 consisting of an extended three-stranded antiparallel β-sheet (βB, βC, and βD) flanked by two short α-helices (αA and αB) (Supplementary Fig. 4). Canonical SH2 βE, βF and BG loop features are retained in the TYK2 SH2, with the βE and βF strands forming a wide loop (the EF loop) and the BG loop organized into a two-strand β sheet (βG1 and βG2) that is a key part of the receptor-binding interface. As with the FERM domain, SH2 and linker sequence homology between JAK family members indicates the overall fold is conserved (Supplementary Fig. 3), therefore this structure provides an important first template for this critical scaffolding region within the JAK family.
IFNAR1 resembles a SH2-binding phosphopeptide
The IFNAR1 peptide interaction interface is approximately linear and buries ~1246 Å2 of TYK2 surface area, as might be anticipated for a constitutive interaction interface. The IFNAR1 peptide can be structurally organized into three segments, each anchored by several residues that make significant contacts with TYK2. Segment 1 is anchored by a key di-leucine motif (Leu491 and Leu492) that interacts with a hydrophobic groove generated by the L1 and α1 helix of the F2 domain (Fig. 2a). Leu491 interacts with TYK2 residues Leu144, Pro146, and Phe149, while Leu492 points ~120° away from the Leu491 sidechain and inserts into a pocket lined by Gly140, Gln142, and Asp145. C-terminal to Leu492, IFNAR1 loses contact with TYK2 for two residues and regains it with a hydrogen bond between the backbone carbonyl of Ser495 and TYK2 Thr477 (Fig. 2b). This second segment of the peptide is secured by polar interactions between Glu497 and TYK2 Ser476 and Thr477, and a water-mediated hydrogen bond with TYK2 Arg482. Other significant contacts with segment 2 include van der Waals contacts between Ile499 and TYK2 Pro506, as well as a salt bridge between Glu500 and TYK2 Arg503. The third segment of the IFNAR1 peptide includes the canonical box2 motif of the receptor, which is a weakly conserved stretch of four hydrophobic amino acids generally followed by one to two negatively charged residues10. The box2 segment forms a three-residue β-sheet with the βG1 strand of the SH2 domain, with residues Cys502 and Ile504 sidechains buried in a hydrophobic groove formed by the βG1 strand and EF loop (Fig. 2c). Overall, IFNAR1 utilizes degenerate, non-polar interactions at both ends combined with specific polar contacts in segment 2 to bind TYK2 with high affinity and fidelity.
Figure 2. IFNAR1 interacts with TYK2 in three segments.

Detailed views of the (a) segment 1, (b) segment 2, and (c) segment 3 regions of the IFNAR1 peptide interfaces are shown. Key residues are labeled and shown as sticks, with IFNAR1 colored yellow. The TYK2 FERM F1 and F2 subdomains and L1 loop are colored pink, red, and orange respectively, and the TYK2 SH2 domain is colored blue. For the inset panels, TYK2 is also represented as a transparent grey surface. Polar contacts are represented as dashed lines.
Comparison of the TYK2 SH2 with known SH2 domain structures reveals the closest structural homologs to be the N-terminal SH2 domains of the SHP family phosphatases33, 34 (Supplementary Fig. 4). The tandem SH2 domains of SHP1 and SHP2 bind phosphorylated tyrosine-containing peptides in target receptors and are classical SH2 folds that utilize a conserved arginine residue in the βB strand to coordinate the phosphate group. Unlike a classical SH2, the TYK2 SH2 domain does not appear to be competent for phosphotyrosine binding due to the presence of a histidine (His474) residue at this essential arginine position (Fig. 3a). Yet unexpectedly, comparison of the TYK2 SH2 with the SHP2 N-terminal SH2 domain reveals that the positioning of the IFNAR1 peptide resembles that of the SHP2-bound IRS-1 phosphopeptide, with the TYK2 SH2 phosphotyrosine binding site instead playing a pivotal role in IFNAR1 recognition by binding a glutamate residue (Fig. 3a–b and Supplementary Fig. 4). The IFNAR1 Glu497 carboxylate forms two hydrogen bonds with TYK2 SH2 residues Ser476 and Thr477 (Fig. 3a), thus mimicking the interaction of phosphotyrosine with SHP2 residues Ser34 and Lys35 (Fig. 3b). Unlike a phosphate group, the Glu497 carboxylate is fully coordinated by residues Ser476 and Thr477 and therefore does not require interaction with His474. This surprising result illuminates studies in which the conserved JAK1 and JAK2 SH2 arginine was shown to be dispensable for receptor binding2.
Figure 3. The TYK2–IFNAR1 complex resembles a SH2–phosphopeptide interaction.

Comparison of the TYK2 SH2 interaction with IFNAR1 side-by-side with the SHP2 SH2 domain bound to a phosphotyrosine peptide from IRS-1 (Protein Data Bank ID 1AYB)34. Detailed views of the (a) IFNAR1 glutamate and (c) box2 interactions with TYK2 are shown inset on the left, with (b) the IRS-1 phosphotyrosine and (d) C-terminal interactions with SHP2 are shown inset on the right. The TYK2 SH2 domain is colored blue and the SHP2 SH2 domain is colored purple, with bound peptides colored yellow. Key residues are shown as stick models and polar contacts shown as dashed lines.
SH2-interacting peptides often contain hydrophobic residues C-terminal to the phosphotyrosine that function as specificity elements for peptide recognition35. The hydrophobic box2 region of IFNAR1 (segment 3) begins five residues C-terminal to Glu497 at Cys502. The sidechains of Cys502 and Ile504 are buried in the hydrophobic βG1-EF groove, and along with Phe503 form a short β-sheet with the βG1 strand (Fig. 3c). Comparison to the IRS-1 peptide bound to SHP2 shows that the Ile+3 and Phe+5 residues are similarly buried in a hydrophobic groove and the Glu+4 residue makes a backbone hydrogen bond with the BG loop (Fig. 3d). Therefore, the interaction of the IFNAR1 box2 with the TYK2 SH2 appears to mimic specificity-determining contacts found in classical SH2–phosphopeptide interactions. Our structure suggests that Cys502 and Ile504 rely on main chain hydrogen bonding and van der Waals contacts for binding energy, implying that the SH2 groove in TYK2 can bind a range of sequences that contain aliphatic residues in the first and third position. This finding now provides a structural rationale for the sequence diversity found in JAK-interacting box2 sequences.
IFNAR1 interface residues are key for TYK2 interaction
Based on our structural analysis, we tested the importance of the IFNAR1 contact residues N-terminal to the box2 for stabilization of the TYK2 FERM–SH2 in vitro by engineering a number of site-directed IFNAR1 alanine mutations in the TYK2–IFNAR1 single-chain fusion construct and testing protein behavior in a thermal stability assay. Apparent Tm values were reduced greater than 5° C for the Leu491 Leu492, Glu497, and Glu496 Glu497 and Glu500 alanine mutants when compared to wild type (Fig. 4a and Supplementary Fig. 5), with the solvent-facing Glu496 mutant having a more limited effect (~1° C) on TYK2 stability. These data indicate that the interactions mediated by IFNAR1 Leu491 Leu492, Glu497, or Glu500 are important for the stability of the TYK2 FERM–SH2 domain. We also investigated the importance of IFNAR1 Glu497 in formation of the TYK2–IFNAR1 complex by performing reciprocal pull-down experiments from insect cells expressing TYK2 FERM–SH2 and IFNAR1 variants. Pull-down of either His-tagged TYK2 FERM–SH2 or GST-linked IFNAR1 peptide shows that mutation of Glu497 to alanine disrupts the interaction of IFNAR1 with TYK2, while mutation of neighboring Glu496 has little effect (Fig. 4b–c and Supplementary Fig. 6). Therefore IFNAR1 Glu497, which mimics the phosphotyrosine found in classical peptide-SH2 interactions, is required for IFNAR1 binding to TYK2.
Figure 4. IFNAR1 interface contacts stabilize TYK2 interaction.
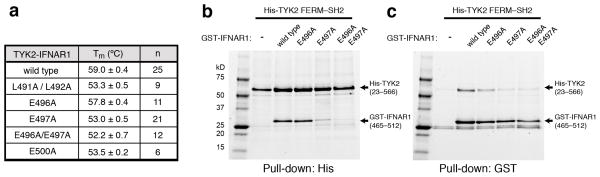
(a) Apparent melting temperatures (mean ± s.d. of >6 measurements, with n shown in third column) were determined for TYK2 bound to IFNAR1 wild type and mutant peptides using differential scanning fluorimetry. P-values from an unpaired, two-tailed students t-test are reported in Supplementary Fig. 9. (b, c) Reciprocal His- and GST-pulldown experiments were performed by expressing His-tagged TYK2 FERM–SH2 (residues 23–566) alone or with GST-tagged IFNAR1 variants (residues 465–512) in insect cells. Expressed proteins were purified by either (a) Ni-NTA or (b) glutathione affinity chromatography, and eluted proteins analyzed by SDS–PAGE. The two ~25kD background bands eluted from the glutathione column represent endogenous GST protein.
Comparison of IFNAR1 orthologs from multiple species shows high conservation of these interface residues (Fig. 5a), while alignment of JAK-interacting sequences based on predicted box2 sequences (Fig. 5b) shows a preference for acidic residues in the −5 and −2 positions in relation to the first box2 residue. Interestingly, the di-leucine motif is not highly conserved among JAK-interacting receptors. On the other side of the interaction, sequence conservation analysis of >140 diverse JAK family homologs (Supplementary Table 1) mapped onto the TYK2 FERM–SH2 structure highlights an elevated level of conservation in residues along the receptor-binding interface (Fig. 5c). Overall, there is a significant level of conservation on both sides of the TYK2–IFNAR1 interface. We therefore envisage other JAKs will follow this SH2-mediated interaction blueprint to bind their cognate receptors (discussed below).
Figure 5. TYK2–IFNAR1 interface residues are conserved in other cytokine receptors and JAKs.

(a, b) Sequence comparison of the TYK2-bound human IFNAR1 peptide to (a) IFNAR1 orthologs and (b) other human cytokine receptors that signal through JAK kinases. Sequences were aligned to IFNAR1 based on putative box2 sequences. (c) Conservation analysis of the TYK2 receptor-binding interface across the JAK family. Amino acid conservation among 150 JAK orthologs was mapped onto the surface of the TYK2 FERM–SH2, with residues colored from most (purple) to least (cyan) conserved.
Discussion
It has long been appreciated that the role of many SH2 domains is to reversibly target a SH2-containing protein to a specific phosphorylated receptor35. Unique cases include the SH2 domain of SAP, which binds unphosphorylated, tyrosine-containing SLAM receptor peptides36, and the S. cervisiae SPT6 SH2 domain, which binds phosphoserine37. To our knowledge, the interaction of a SH2 domain with a glutamate residue as seen in the TYK2–IFNAR1 complex has not been previously described. Importantly, a requirement for the Glu–Glu motif at positions 496 and 497 was demonstrated for the IFNAR1 interaction with TYK213, and alanine scanning of EPO-R has established a need for an aspartate and several surrounding residues in assays for JAK2 function11. It therefore seems plausible that what began as a conditional, SH2-mediated interaction between a primordial JAK–receptor pair has evolved into a constitutive interaction in its current form. Beyond the tyrosine to glutamate substitution, this required expansion of the box2 interaction site formed by the SH2 EF and BG loops, which are characteristic gatekeepers of peptide specificity35, 38. Indeed, expansion of contacts within this secondary site is one mechanism by which the SAP SH2 domain has evolved to bind an unphosphorylated tyrosine-containing peptide36. Given the role of a subset of FERM domains in recognition of peptide “tails” from cell surface receptors such as integrins39, a possible scenario could have involved addition of a peptide-binding FERM domain to a primitive SH2-containing JAK kinase, followed by evolution of both domains to form a tight, constitutive interaction with receptor.
Recent work characterizing the evolution of phosphorylation sites to and from fixed charge acidic residues suggested that these amino acid positions often regulate allosteric changes that impact protein function40. Our structure suggests that evolution of protein-protein interactions from conditional to constitutive is also a possibility. Like TYK2, two other uncharacterized SH2 domain-containing proteins (RIN2 and SH2D5) in the human repertoire contain arginine substitutions at the key phosphate coordination position41. It is also noteworthy that, while TYK2 homologs have a histidine, glutamine, or arginine in this position, other JAK family members retain an arginine, which would likely also permit interaction with an acidic residue. Indeed, the presence of glutamate or aspartate residues in a number of JAK1, JAK2, and JAK3-associated receptors suggests this is the case. In addition, it is tempting to contemplate that some uncharacterized SH2 domains in the human proteome may have functions other than binding phosphotyrosine.
A molecular understanding of JAK–receptor interactions is key to elucidation of the mechanisms of JAK activation; yet insight into these interactions has been hampered by the poor sequence conservation and ambiguity in binding requirements between different JAK–receptor systems. Study of the JAK1–gp130 and JAK2–EPO-R systems has established a general requirement for both box1 and box2 motifs in JAK interaction and activation10, 11, 17. The box1 and box2 motifs in human gp130 and EPO-R are separated by 32 and 43 residues, respectively, suggesting the possibility of multiple peptide interaction sites in the JAK FERM and SH2 domains2. Yet what is clear from this work and the work of others13 is that IFNAR1 does not require a classical proline-rich box1 sequence to interact with TYK2. This raises the question of whether IFNAR1 has lost its box1 motif, or instead is a “minimal” receptor motif emblematic of JAK–receptor interactions. Intriguingly, our alignment of receptor intracellular domains based on their box2 motifs (Fig. 5b) reveals that IFNAR2 contains a box1 sequence (Pro-Phe-Pro) shown to be required for JAK1 interaction15 10 residues upstream of box2. This places the IFNAR2 box1 in near exact alignment with the di-leucine motif in IFNAR1, and leads us to speculate that the segment 1 di-leucine interaction site in TYK2 may be the JAK box1 interaction site. Regardless, our structural work has begun to unravel the “code” by which JAKs interact with their receptors, and indicates that receptors follow a multi-point JAK interaction blueprint, utilizing the conserved SH2–box2 interaction mode typified by TYK2 and IFNAR1 as well as box1 or other surrounding motifs to secure a tight interface between JAK and receptor. This structural arrangement appears uniquely suited to allow high fidelity and specificity in the constitutive coupling of a broad family of cytokine receptors with their downstream signaling amplifiers.
Online Methods
Protein expression and purification for crystallization
The human TYK2 FERM–SH2 domain (amino acids 23–583) linked by a 6xGlySer (GSGSGSGSGSGS) linker to a fragment of the human IFNα receptor chain 1 (IFNAR1, amino acids 478–512) was cloned into the bacterial expression vector pET32a in frame with the N-terminal thioredoxin tag and a TEV protease cleavage site. The construct was transformed into Rosetta 2 (DE3) E. coli competent cells for expression. Single colony overnight starter cultures grown in TB + 1% glycerol were used for inoculation of production cultures in Instant TB overnight autoinduction media (Novagen) and grown at 16°C for 4 days.
For selenomethionine labeling, the above construct was transformed into BL21 (DE3) Gold E. coli competent cells. Single colony overnight starter cultures grown in minimal media (M9 media with 0.4% glucose, 0.1% ammonium chloride, 2 mM magnesium sulfate, 0.1 mM calcium chloride, trace metals, and vitamin mix) were used for inoculation of production cultures in minimal media and grown at 37°C to an OD of 0.6. Cultures were shifted to 16°C, supplemented with 100 mg/L L-lysine, L-phenylalanine, L-threonine and 50 mg/L L-isoleucine, L-leucine, L-valine, and L-selenomethionine for 30 minutes and induced with 0.4 mM IPTG overnight.
After expression, cells were harvested by centrifugation and bacterial paste resuspended in buffer containing 50 mM Tris pH 8.0, 500 mM NaCl, 10% glycerol, 5 mM imidazole, 1 mM TCEP, 0.1 mM PMSF, EDTA-free PI tablets (Roche). Cells were lysed by homogenization and microfluidization and lysate was incubated with 0.25% CHAPS for one hour at 4°C prior to ultracentrifugation at 40K for 45 minutes. Cleared lysate was filtered with a 0.8μM filter prior to loading onto a Ni-NTA Superflow gravity (Qiagen) column. The Ni-NTA column was washed with lysis buffer supplemented with 0.1% CHAPS and 40 mM imidazole and TYK2 protein was eluted in lysis buffer supplemented with 0.1% CHAPS and 300 mM imidazole. The TYK2 elution pool was concentrated and loaded onto a Hiload 16/60 Superdex 200 prep grade column (GE Healthcare) in 20 mM Tris 8.0, 300 mM NaCl, 10% glycerol, 1 mM TCEP, and 0.1 mM PMSF. Pooled fractions were incubated with TEV protease overnight at 4°C with dialysis against 25 mM Tris 8.1, 300 mM NaCl, 10% glycerol, 1 mM TCEP, and 0.25 mM PMSF. Digested TYK2 protein was put over a second Ni-NTA Superflow gravity column to remove the cleaved tag and washed with dialysis buffer containing 40 mM imidazole. Flow-through and wash fractions were combined, concentrated, and loaded onto a final Hiload 16/60 Superdex 200 prep grade column (GE Healthcare) in 25 mM Tris 8.1, 150 mM NaCl, 1mM TCEP. Protein was concentrated for crystallography to 10.6 mg/ml.
Protein expression and purification for SEC analysis and mass spectrometry
For baculovirus expression, the human TYK2 FERM–SH2 domain (amino acids 23–566) linked by a 2xGlySer-TEV-2xSerGly (GSGSENLYFQGSGSG) linker to a fragment of the IFN-α receptor chain 1 (IFNAR1, amino acids 465–512) was cloned into the baculovirus expression vector pAcGP67 in frame with an N terminal 6xHis tag and TEV cleavage site (MHHHHHHGENLYFQGS). For expression without the IFNAR1 peptide, TYK2 (amino acids 23–566) was cloned into the same pACGP67 N-His-TEV vector. SF9 cells were infected with resulting virus at an MOI of 1.0 and grown in shaker cultures for 72 hours at 27° C and harvested by centrifugation. Cell pellets were resuspended in buffer containing 50 mM Tris pH 8.5, 500 mM NaCl, 10% glycerol, 5 mM imidazole, 1 mM TCEP, 0.25mM PMSF, EDTA-free PI tablets (Roche) and lysed by homogenization and microfluidization. Lysate was incubated with 0.25% CHAPS for one hour at 4°C prior to ultracentrifugation at 40K for 45 minutes. Cleared lysate was filtered with a 0.8μM filter prior to loading onto a Ni-NTA Superflow gravity column. The Ni-NTA column was washed with lysis buffer supplemented with 0.1% CHAPS and 40 mM imidazole and TYK2 protein was eluted in lysis buffer supplemented with 0.1% CHAPS and 300 mM imidazole. The TYK2 elution pool was concentrated and loaded onto a Hiload 16/60 Superdex 200 prep grade column (GE Healthcare) in 20 mM Tris 8.8, 300 mM NaCl, 10% glycerol, 1 mM TCEP.
Mass Spectrometry
Mass spectrometry was performed on an Agilent 6224 TOF LC/MS system coupled to an Infinity 1260 HPLC. Proteins were separated on a PLRP-S reversed phase column using a water–acetonitrile gradient with 0.05% trifluoroacetic acid as a counter-ion. Mass spectrometry data were analyzed with the MassHunter software (Agilent).
Differential Scanning Fluorimetry (DSF)
To generate IFNAR1 receptor mutants for DSF, the E. coli expression construct described above (pET32A containing TYK2 FERM/SH2 residues 23–583, 6xGlySer linker, IFNAR1 residues 478–512) was subjected to site-directed mutagenesis to generate the L491A L492A, E496A, E497A, E496A E497A, and E500A mutants. All constructs were transformed into Rosetta 2 (DE3) E. coli, grown in autoinduction media, and purified as described for crystallography. A 0.8μM protein sample was prepared in a 1:2000 dilution of SYPRO orange dye to protein buffer (25mM Tris, 250mM NaCl, 1mM TCEP, pH 7.5). An AB7500 qPCR machine was used to heat the sample from 25°C to 95°C, with fluorescence measurements taken at 1°C increments. Thermal melting curves were plotted and the ThermoFluor TM analyzer software was utilized to generate apparent Tm values according to published methods42, 43. Mean apparent Tm, standard deviation (SD), and P-values were calculated from measurements of >6 individual wells for each protein. Apparent Tm values for wild-type TYK2–IFNAR1 were measured as a control in three separate experiments on different days, and these 25 datapoints were used to calculate the mean wild-type Tm as well as subjected to an unpaired, two-tailed T-test against the mutant receptor data points to determine P-values. Sample sizes for mutants were as follows: L491A L492A, 9; E496A, 12; E497A, 21; E496A E497A, 12; E500A, 6. Individual traces are shown in Supplementary Fig. 9. We were unable to calculate apparent Tm values for the TYK2 FERM/SH2 without peptide because of poor recovery of soluble protein after size exclusion chromatography step (see Supplementary Figure 1).
His- and GST-pull-down experiments
pACGP67-based baculovirus expression constructs were generated for N-6XHis-TEV tagged human TYK2 FERM–SH2 (residues 23–566) and N-GST tagged IFNAR1 (residues 465–512). GST-IFNAR1 variants (E496A, E497A, and E496A E497A) were generated by site-directed mutagenesis. For protein expression, SF9 cells were infected with virus at an MOI of 1.0 and grown in shaker cultures for 72 hours at 27° C and harvested by centrifugation. Cell pellets from 1 liter of SF9 culture were resuspended in 120 mL buffer containing 50 mM Tris pH 8.5, 300 mM NaCl, 10% glycerol, 1 mM TCEP, 0.25mM PMSF, EDTA-free PI tablets (Roche), and lysed by homogenization and microfluidization. Lysates were incubated with 0.25% CHAPS for one hour at 4°C prior to ultracentrifugation at 40K for 45 minutes. Cleared lysates were filtered with a 0.8μM filter and divided in half for Ni- or glutathione-affinity purification. For Ni-NTA purification, 50 mL of lysate was loaded onto a 3 mL Ni-NTA Superflow (Qiagen) gravity column, and the column washed with 10 column volumes lysis buffer supplemented with 0.1% CHAPS and 40 mM imidazole. Bound proteins were eluted in one column volume lysis buffer supplemented with 0.1% CHAPS and 300 mM imidazole. For GST purification, 50 mL of lysate was bound to 2.5 mL Glutathione-Sepharose FF resin (GE Healthcare) in batch for 2 hours at 4° C, followed by on-column washing with 10 column volumes of lysis buffer supplemented with 0.1% CHAPS. Bound proteins were eluted in one column volume of lysis buffer supplemented with 0.1% CHAPS and 10 mM reduced glutathione. Elutions were analyzed by SDS-PAGE and visualized using a BioRad Stain-free scanning system (GelDoc EZ System).
Crystallization and data collection
TYK2IFNAR1 crystals were initially grown in hanging drops at 4° C by mixing 1 μL of concentrated protein with 1 μL of mother liquor consisting of 0.1 M Tris HCl pH 7.0, 0.2 M MgCl2, and 8–12% PEG 8000. Optimization of both native and selenomethionine-derivatized crystals was carried out by microseeding and varying the protein:mother liquor ratio. Heavy-atom derivatives were prepared by soaking the crystals for 1 hour in 0.1M Tris HCl pH 7.0, 0.2 M MgCl2, 12% PEG 8000 supplemented with 5% glycerol and 1 mM of KAu(CN)2 or K2PtCl4. All crystals were backsoaked and cryoprotected by stepped introduction of mother liquor containing glycerol (5%/15%/25% vol/vol) into the drop, followed by flash freezing in liquid nitrogen. The native dataset (0.979Å) was collected at the Stanford Synchotron Radiation Lightsource (SSRL) beamline 12-2, and peak wavelength selenomethionine (0.9789Å), gold (1.0378Å), and platinum-derivative (1.0716Å) datasets were collected at SSRL beamline 11-1. All data were collected under cryo-cooled conditions (100K) and processed using XDS44 and SCALA45. The native TYK2–IFNAR1 crystal data belonged to the C2 spacegroup, with unit cell parameters of a=186.4Å, b=52.4Å, c=70.2Å, α=90, β=108, λ=90. Derivatized TYK2–IFNAR1 crystals also belonged to the C2 spacegroup, with unique a-axis lengths and beta angles (see Table 1 for details).
Phasing and structure determination
Phases were calculated using the single wavelength anomalous dispersion (SAD) method using Autosol from the Phenix package46. The calculated phases for the Au and Pt datasets had figure of merit values of 0.406 and 0.322, respectively. An initial model containing poly-alanine helices and strands was built from the heavy atom phased maps using Phenix Autobuild. As the anomalous signal in the selenomethionine dataset was too weak to provide phases, the poly-alanine model was used as a molecular replacement model to calculate phases for the selenomethionine data. An anomalous difference map generated using the program FFT in the CCP4 suite45 and contoured to 4 sigma provided the position of seven of ten methionines (100, 115, 141,186, 256, 445, and 564) in the polypeptide. This information combined with the location of several Au and Pt sites (assumed to be bound to cysteines and methionines, respectively) provided initial register for manual addition of sidechains to the poly-alanine model. Several rounds of model building in COOT47 and simulated annealing refinement using Phenix provided a coordinate set suitable for molecular replacement into the high resolution native data, which was followed by another round of automated chain building using Phenix Autobuild. This method provided a model that was approximately 80% complete. Final rounds of model building and addition of waters and solvent molecules was carried out using COOT, followed by simulated annealing, coordinate and b-factor refinement using Phenix and BUSTER (Global Phasing Ltd.). The final model was refined at 2.0Å to R/Rfree values of 19.9/23.3% respectively, and Ramachandran statistics calculated by MolProbity48 indicated 98% of residues lie in the favored regions with 0.2% outliers. The final model contains TYK2 residues 26–129, 139–295, 309–329, 371–509, and 513–566 and IFNAR1 residues 489–507. Contacts were analyzed using the Protein Interfaces, Surfaces, and Assemblies (PISA) software49 and CONTACT from the CCP4 suite45. Structural superpositions were carried out using the SSM algorithm from SUPERPOSE45. Interaction maps were generated by the AquaProt server50 and edited with Adobe Illustrator. Structural figures were prepared with PYMOL (Schrödinger). Surface electrostatics were calculated with APBS51.
Sequence alignments and analysis
FERM–SH2 sequence conservation analysis shown in Figure 5 was generated by CONSURF52 using the TYK2 FERM–SH2 structure as a model and a PSI-BLAST search against the Uniref90 database over the FERM–SH2 amino acid sequence, with cutoffs set at a maximum 95% and a minimum of 35% identity. 143 JAK family sequences were utilized in the analysis and are listed in Supplementary Table 1. Other sequence alignments were generated using the program PROBCONS53. Due to poor sequence homology among receptors, sequence alignments shown in Figure 5 were hand-aligned based on both published and predicted box2 sequences from human receptors.
Supplementary Material
Acknowledgments
We thank X. Ma, M. Ultsch, J. Payandeh, L. Wu, and the staff at the Stanford Synchotron Radiation Lightsource (SSRL) for their technical advice and assistance. We also thank the Structural Biology Expression Group, Microchemistry and Proteomics Laboratory, and DNA Sequencing facilities at Genentech for their technical support. Portions of this research were carried out at the SSRL, a Directorate of SLAC National Accelerator Laboratory and an Office of Science User Facility operated for the U.S. Department of Energy (DOE) Office of Science by Stanford University. The SSRL Structural Molecular Biology Program is supported by the DOE Office of Biological and Environmental Research, and by the National Institutes of Health, National Institute of General Medical Sciences (including P41GM103393).
Footnotes
Accession codes: Coordinates and structure factors have been deposited in the Protein Data Bank under accession code 4PO6.
The contents of this publication are solely the responsibility of the authors and do not necessarily represent the official views of NIGMS or NIH.
Author Contributions: H.W. performed protein purification, crystallization and biochemical experiments. C.T. and Y.F. performed design and cloning of TYK2 constructs. H.W. and M.S. participated in data analysis and manuscript preparation. P.L. solved and analyzed the structure, prepared figures and wrote the manscript.
Competing interest statement: The authors declare no competing financial interests.
References
- 1.Leonard WJ, O’Shea JJ. Jaks and STATs: biological implications. Annu Rev Immunol. 1998;16:293–322. doi: 10.1146/annurev.immunol.16.1.293. [DOI] [PubMed] [Google Scholar]
- 2.Haan C, Kreis S, Margue C, Behrmann I. Jaks and cytokine receptors--an intimate relationship. Biochem Pharmacol. 2006;72:1538–1546. doi: 10.1016/j.bcp.2006.04.013. [DOI] [PubMed] [Google Scholar]
- 3.Casanova JL, Holland SM, Notarangelo LD. Inborn errors of human JAKs and STATs. Immunity. 2012;36:515–528. doi: 10.1016/j.immuni.2012.03.016. [DOI] [PMC free article] [PubMed] [Google Scholar]
- 4.Kontzias A, Kotlyar A, Laurence A, Changelian P, O’Shea JJ. Jakinibs: a new class of kinase inhibitors in cancer and autoimmune disease. Curr Opin Pharmacol. 2012;12:464–470. doi: 10.1016/j.coph.2012.06.008. [DOI] [PMC free article] [PubMed] [Google Scholar]
- 5.Radtke S, et al. The Jak1 SH2 domain does not fulfill a classical SH2 function in Jak/STAT signaling but plays a structural role for receptor interaction and up-regulation of receptor surface expression. J Biol Chem. 2005;280:25760–25768. doi: 10.1074/jbc.M500822200. [DOI] [PubMed] [Google Scholar]
- 6.Richter MF, Dumenil G, Uze G, Fellous M, Pellegrini S. Specific contribution of Tyk2 JH regions to the binding and the expression of the interferon alpha/beta receptor component IFNAR1. J Biol Chem. 1998;273:24723–24729. doi: 10.1074/jbc.273.38.24723. [DOI] [PubMed] [Google Scholar]
- 7.Zhao Y, Wagner F, Frank SJ, Kraft AS. The amino-terminal portion of the JAK2 protein kinase is necessary for binding and phosphorylation of the granulocyte-macrophage colony-stimulating factor receptor beta c chain. J Biol Chem. 1995;270:13814–13818. doi: 10.1074/jbc.270.23.13814. [DOI] [PubMed] [Google Scholar]
- 8.Chen M, et al. The amino terminus of JAK3 is necessary and sufficient for binding to the common gamma chain and confers the ability to transmit interleukin 2-mediated signals. Proc Natl Acad Sci U S A. 1997;94:6910–6915. doi: 10.1073/pnas.94.13.6910. [DOI] [PMC free article] [PubMed] [Google Scholar]
- 9.Cacalano NA, et al. Autosomal SCID caused by a point mutation in the N-terminus of Jak3: mapping of the Jak3-receptor interaction domain. EMBO J. 1999;18:1549–1558. doi: 10.1093/emboj/18.6.1549. [DOI] [PMC free article] [PubMed] [Google Scholar]
- 10.Murakami M, et al. Critical cytoplasmic region of the interleukin-6 signal transducer gp130 is conserved in the cytokine receptor family. Proc Natl Acad Sci U S A. 1991;88:11349–11353. doi: 10.1073/pnas.88.24.11349. [DOI] [PMC free article] [PubMed] [Google Scholar]
- 11.Pelletier S, Gingras S, Funakoshi-Tago M, Howell S, Ihle JN. Two domains of the erythropoietin receptor are sufficient for Jak2 binding/activation and function. Mol Cell Biol. 2006;26:8527–8538. doi: 10.1128/MCB.01035-06. [DOI] [PMC free article] [PubMed] [Google Scholar]
- 12.Lebrun JJ, Ali S, Ullrich A, Kelly PA. Proline-rich sequence-mediated Jak2 association to the prolactin receptor is required but not sufficient for signal transduction. J Biol Chem. 1995;270:10664–10670. doi: 10.1074/jbc.270.18.10664. [DOI] [PubMed] [Google Scholar]
- 13.Yan H, Krishnan K, Lim JT, Contillo LG, Krolewski JJ. Molecular characterization of an alpha interferon receptor 1 subunit (IFNaR1) domain required for TYK2 binding and signal transduction. Mol Cell Biol. 1996;16:2074–2082. doi: 10.1128/mcb.16.5.2074. [DOI] [PMC free article] [PubMed] [Google Scholar]
- 14.Tanner JW, Chen W, Young RL, Longmore GD, Shaw AS. The conserved box 1 motif of cytokine receptors is required for association with JAK kinases. J Biol Chem. 1995;270:6523–6530. doi: 10.1074/jbc.270.12.6523. [DOI] [PubMed] [Google Scholar]
- 15.Usacheva A, et al. Contribution of the Box 1 and Box 2 motifs of cytokine receptors to Jak1 association and activation. J Biol Chem. 2002;277:48220–48226. doi: 10.1074/jbc.M205757200. [DOI] [PubMed] [Google Scholar]
- 16.Royer Y, Staerk J, Costuleanu M, Courtoy PJ, Constantinescu SN. Janus kinases affect thrombopoietin receptor cell surface localization and stability. J Biol Chem. 2005;280:27251–27261. doi: 10.1074/jbc.M501376200. [DOI] [PubMed] [Google Scholar]
- 17.Haan C, Heinrich PC, Behrmann I. Structural requirements of the interleukin-6 signal transducer gp130 for its interaction with Janus kinase 1: the receptor is crucial for kinase activation. Biochem J. 2002;361:105–111. doi: 10.1042/0264-6021:3610105. [DOI] [PMC free article] [PubMed] [Google Scholar]
- 18.Haan C, Hermanns HM, Heinrich PC, Behrmann I. A single amino acid substitution (Trp(666)-->Ala) in the interbox1/2 region of the interleukin-6 signal transducer gp130 abrogates binding of JAK1, and dominantly impairs signal transduction. Biochem J. 2000;349:261–266. doi: 10.1042/0264-6021:3490261. [DOI] [PMC free article] [PubMed] [Google Scholar]
- 19.Bogdan C. The function of type I interferons in antimicrobial immunity. Curr Opin Immunol. 2000;12:419–424. doi: 10.1016/s0952-7915(00)00111-4. [DOI] [PubMed] [Google Scholar]
- 20.Garcia-Sastre A, Biron CA. Type 1 interferons and the virus-host relationship: a lesson in detente. Science. 2006;312:879–882. doi: 10.1126/science.1125676. [DOI] [PubMed] [Google Scholar]
- 21.Dunn GP, Koebel CM, Schreiber RD. Interferons, immunity and cancer immunoediting. Nat Rev Immunol. 2006;6:836–848. doi: 10.1038/nri1961. [DOI] [PubMed] [Google Scholar]
- 22.Theofilopoulos AN, Baccala R, Beutler B, Kono DH. Type I interferons (alpha/beta) in immunity and autoimmunity. Annu Rev Immunol. 2005;23:307–336. doi: 10.1146/annurev.immunol.23.021704.115843. [DOI] [PubMed] [Google Scholar]
- 23.Velazquez L, Fellous M, Stark GR, Pellegrini S. A protein tyrosine kinase in the interferon alpha/beta signaling pathway. Cell. 1992;70:313–322. doi: 10.1016/0092-8674(92)90105-l. [DOI] [PubMed] [Google Scholar]
- 24.Colamonici O, et al. Direct binding to and tyrosine phosphorylation of the alpha subunit of the type I interferon receptor by p135tyk2 tyrosine kinase. Mol Cell Biol. 1994;14:8133–8142. doi: 10.1128/mcb.14.12.8133. [DOI] [PMC free article] [PubMed] [Google Scholar]
- 25.Colamonici OR, Uyttendaele H, Domanski P, Yan H, Krolewski JJ. p135tyk2, an interferon-alpha-activated tyrosine kinase, is physically associated with an interferon-alpha receptor. J Biol Chem. 1994;269:3518–3522. [PubMed] [Google Scholar]
- 26.Ragimbeau J, et al. The tyrosine kinase Tyk2 controls IFNAR1 cell surface expression. EMBO J. 2003;22:537–547. doi: 10.1093/emboj/cdg038. [DOI] [PMC free article] [PubMed] [Google Scholar]
- 27.Lupardus PJ, et al. Structural snapshots of full-length Jak1, a transmembrane gp130/IL-6/IL-6Ralpha cytokine receptor complex, and the receptor-Jak1 holocomplex. Structure. 2011;19:45–55. doi: 10.1016/j.str.2010.10.010. [DOI] [PMC free article] [PubMed] [Google Scholar]
- 28.Smith WJ, Nassar N, Bretscher A, Cerione RA, Karplus PA. Structure of the active N-terminal domain of Ezrin. Conformational and mobility changes identify keystone interactions. J Biol Chem. 2003;278:4949–4956. doi: 10.1074/jbc.M210601200. [DOI] [PubMed] [Google Scholar]
- 29.Hamada K, Shimizu T, Matsui T, Tsukita S, Hakoshima T. Structural basis of the membrane-targeting and unmasking mechanisms of the radixin FERM domain. EMBO J. 2000;19:4449–4462. doi: 10.1093/emboj/19.17.4449. [DOI] [PMC free article] [PubMed] [Google Scholar]
- 30.Pearson MA, Reczek D, Bretscher A, Karplus PA. Structure of the ERM protein moesin reveals the FERM domain fold masked by an extended actin binding tail domain. Cell. 2000;101:259–270. doi: 10.1016/s0092-8674(00)80836-3. [DOI] [PubMed] [Google Scholar]
- 31.Ceccarelli DF, Song HK, Poy F, Schaller MD, Eck MJ. Crystal structure of the FERM domain of focal adhesion kinase. J Biol Chem. 2006;281:252–259. doi: 10.1074/jbc.M509188200. [DOI] [PubMed] [Google Scholar]
- 32.Eck MJ, Shoelson SE, Harrison SC. Recognition of a high-affinity phosphotyrosyl peptide by the Src homology-2 domain of p56lck. Nature. 1993;362:87–91. doi: 10.1038/362087a0. [DOI] [PubMed] [Google Scholar]
- 33.Yang J, et al. Crystal structure of human protein-tyrosine phosphatase SHP-1. J Biol Chem. 2003;278:6516–6520. doi: 10.1074/jbc.M210430200. [DOI] [PubMed] [Google Scholar]
- 34.Lee CH, et al. Crystal structures of peptide complexes of the amino-terminal SH2 domain of the Syp tyrosine phosphatase. Structure. 1994;2:423–438. doi: 10.1016/s0969-2126(00)00044-7. [DOI] [PubMed] [Google Scholar]
- 35.Bradshaw JM, Waksman G. Molecular recognition by SH2 domains. Adv Protein Chem. 2002;61:161–210. doi: 10.1016/s0065-3233(02)61005-8. [DOI] [PubMed] [Google Scholar]
- 36.Poy F, et al. Crystal structures of the XLP protein SAP reveal a class of SH2 domains with extended, phosphotyrosine-independent sequence recognition. Mol Cell. 1999;4:555–561. doi: 10.1016/s1097-2765(00)80206-3. [DOI] [PubMed] [Google Scholar]
- 37.Yoh SM, Cho H, Pickle L, Evans RM, Jones KA. The Spt6 SH2 domain binds Ser2-P RNAPII to direct Iws1-dependent mRNA splicing and export. Genes Dev. 2007;21:160–174. doi: 10.1101/gad.1503107. [DOI] [PMC free article] [PubMed] [Google Scholar]
- 38.Kaneko T, et al. Loops govern SH2 domain specificity by controlling access to binding pockets. Sci Signal. 2010;3:ra34. doi: 10.1126/scisignal.2000796. [DOI] [PMC free article] [PubMed] [Google Scholar]
- 39.Moser M, Legate KR, Zent R, Fassler R. The tail of integrins, talin, and kindlins. Science. 2009;324:895–899. doi: 10.1126/science.1163865. [DOI] [PubMed] [Google Scholar]
- 40.Pearlman SM, Serber Z, Ferrell JE., Jr A mechanism for the evolution of phosphorylation sites. Cell. 2011;147:934–946. doi: 10.1016/j.cell.2011.08.052. [DOI] [PMC free article] [PubMed] [Google Scholar]
- 41.Liu BA, et al. The human and mouse complement of SH2 domain proteins-establishing the boundaries of phosphotyrosine signaling. Mol Cell. 2006;22:851–868. doi: 10.1016/j.molcel.2006.06.001. [DOI] [PubMed] [Google Scholar]
- 42.Pantoliano MW, et al. High-density miniaturized thermal shift assays as a general strategy for drug discovery. J Biomol Screen. 2001;6:429–440. doi: 10.1177/108705710100600609. [DOI] [PubMed] [Google Scholar]
- 43.Niesen FH, Berglund H, Vedadi M. The use of differential scanning fluorimetry to detect ligand interactions that promote protein stability. Nat Protoc. 2007;2:2212–2221. doi: 10.1038/nprot.2007.321. [DOI] [PubMed] [Google Scholar]
- 44.Kabsch W. Xds. Acta Crystallogr D Biol Crystallogr. 2010;66:125–132. doi: 10.1107/S0907444909047337. [DOI] [PMC free article] [PubMed] [Google Scholar]
- 45.Potterton E, Briggs P, Turkenburg M, Dodson E. A graphical user interface to the CCP4 program suite. Acta Crystallogr D Biol Crystallogr. 2003;59:1131–1137. doi: 10.1107/s0907444903008126. [DOI] [PubMed] [Google Scholar]
- 46.Adams PD, et al. PHENIX: a comprehensive Python-based system for macromolecular structure solution. Acta Crystallogr D Biol Crystallogr. 2010;66:213–221. doi: 10.1107/S0907444909052925. [DOI] [PMC free article] [PubMed] [Google Scholar]
- 47.Emsley P, Cowtan K. Coot: model-building tools for molecular graphics. Acta Crystallogr D Biol Crystallogr. 2004;60:2126–2132. doi: 10.1107/S0907444904019158. [DOI] [PubMed] [Google Scholar]
- 48.Chen VB, et al. MolProbity: all-atom structure validation for macromolecular crystallography. Acta Crystallogr D Biol Crystallogr. 2010;66:12–21. doi: 10.1107/S0907444909042073. [DOI] [PMC free article] [PubMed] [Google Scholar]
- 49.Krissinel E, Henrick K. Inference of macromolecular assemblies from crystalline state. J Mol Biol. 2007;372:774–797. doi: 10.1016/j.jmb.2007.05.022. [DOI] [PubMed] [Google Scholar]
- 50.Reichmann D, Phillip Y, Carmi A, Schreiber G. On the contribution of water-mediated interactions to protein-complex stability. Biochemistry. 2008;47:1051–1060. doi: 10.1021/bi7019639. [DOI] [PubMed] [Google Scholar]
- 51.Baker NA, Sept D, Joseph S, Holst MJ, McCammon JA. Electrostatics of nanosystems: application to microtubules and the ribosome. Proc Natl Acad Sci U S A. 2001;98:10037–10041. doi: 10.1073/pnas.181342398. [DOI] [PMC free article] [PubMed] [Google Scholar]
- 52.Ashkenazy H, Erez E, Martz E, Pupko T, Ben-Tal N. ConSurf 2010: calculating evolutionary conservation in sequence and structure of proteins and nucleic acids. Nucleic Acids Res. 2010;38:W529–533. doi: 10.1093/nar/gkq399. [DOI] [PMC free article] [PubMed] [Google Scholar]
- 53.Do CB, Mahabhashyam MS, Brudno M, Batzoglou S. ProbCons: Probabilistic consistency-based multiple sequence alignment. Genome Res. 2005;15:330–340. doi: 10.1101/gr.2821705. [DOI] [PMC free article] [PubMed] [Google Scholar]
Associated Data
This section collects any data citations, data availability statements, or supplementary materials included in this article.