

Abstract
Idiopathic neutropenia (IN) in children is characterized by decreased neutrophil counts (<1500/μl), can be acute or chronic (greater than 6 months duration). The pathophysiology is not well understood; therefore, potential mechanisms of pediatric IN were investigated. An increase in Fas transcripts in neutrophils of IN patients compared to age-matched healthy control (HC) neutrophils was observed (p<0.005). Increased expression of Fas protein was found in IN neutrophils, while Fas surface expression on other immune cells was similar. Plasma from acute IN patients had higher protein levels of soluble FasL than chronic IN patients. When HC neutrophils were incubated in plasma from IN patients, greater rates of apoptosis were observed. Biochemical studies suggest the apoptotic factor(s) in plasma is heat-sensitive, non-IgG, and 12–50 kD protein. Addition of anti-sFasL blocking antibodies to patient plasma caused a statistically significant decrease in neutrophil apoptosis. These studies show that the Fas/FasL pathway could be associated with neutrophil apoptosis in childhood IN.
Keywords: Neutropenia, Apoptosis, Fas, Fas ligand, Idiopathic neutropenia, Pediatric neutropenia, Neutrophil disorder
Introduction
Idiopathic neutropenia (IN) in children is commonly encountered in clinical practice, is marked by low neutrophil counts (<1500/μl), exhibits a benign clinical course, and has no identified underlying cause to explain the neutropenia. Although recent research has identified genetically based mechanisms for several forms of congenital neutropenia, including mutations in the elastase (ELA-2) gene (for cyclic and severe chronic neutropenia) [1] and the HAX-1 gene (Kostmann’s syndrome) [2], little increase in the understanding of the mechanisms for IN in children has been published. We attempted to identify factors which might play a role in the development of acute and chronic IN. We demonstrate that the FasL/Fas pathway is associated with plasma-mediated cell death of neutrophils and that sFasL is increased in the plasma of pediatric IN patients.
Pediatric IN is characterized by exclusion of drug-induced, cancer-related, immunodeficiency or autoimmune disorders, and genetic mutations which result in neutropenia. In children a mild clinical course is typically encountered, with symptoms of gingivitis, oral sores, and increased local and subcutaneous infections, and more rarely, patients can experience recurring respiratory infections, diarrhea, or blood-borne infections [1–7,18–22]. Some patients with acute neutropenia go on to develop chronic neutropenia (defined as neutropenia over 6 months or more); however, there are no current curative therapies. Although G-CSF (granulocyte colony stimulating factor) and oral steroids can be used to treat neutropenia, they are not fully effective and do not always provide a durable response. Children experiencing both acute and chronic IN can often spontaneously recover neutrophil counts. The mechanisms for developing IN, and tests or factors which predict spontaneous resolution have not been well studied.
Neutrophil numbers are normally regulated by a constitutive apoptotic process, ensuring that cells, which have undergone necrosis and apoptosis, are completely eliminated without releasing unnecessary cytotoxic granules into surrounding tissues [8–17]. We hypothesized that the neutrophil constitutive apoptotic process was increased in childhood IN. After screening a number of families of molecules which have been described as regulators of apoptosis, we found members of the Fas/Fas ligand apoptotic pathway to be increased in childhood IN. A member of the tumor necrosis factor (TNF) family, Fas ligand induces apoptosis by binding its receptor, Fas, also known as APO-1 or CD95. Fas ligand is synthesized as a type II membrane protein and then cleaved from the membrane by metalloproteinases to become sFasL [20–24]. The physiological role of TNF family member shedding has not been well characterized. It is known that high levels of circulating Fas ligand are associated with T cell large granular lymphocytosis [23]. In addition, studies have demonstrated that neutrophils undergo apoptosis [23] through Fas triggering. Furthermore, growth of hematopoietic colonies in vitro can be negatively regulated by activation of the Fas pathway [23].
Because of the lack of understanding of childhood IN, we aimed to study the pathophysiological mechanisms causing IN. Our results suggest that high levels of sFas ligand and Fas-mediated neutrophil apoptosis may contribute to the neutropenia of IN.
Materials and methods
Pediatric patients carrying the diagnosis of IN (n=23, n=7 chronic and n=16 acute) were recruited through the Lucile Salter Packard Children’s Hospital (LPCH) Hematology Clinic. Patients with known ELA-2 mutations were excluded (n=2). Because the specificity of anti-neutrophil antibodies and the diagnosis of IN is unclear, patients were included regardless of anti-neutrophil antibody status. Healthy, aged-matched patients (n=4) and patients with chemotherapy-induced neutropenia (n=3) (who were afebrile with recovering blood counts and negative blood cultures) were recruited as controls. Consent and assent was obtained from all participating patients or their guardians in accordance with the Declaration of Helsinki with a Stanford University School of Medicine Institutional Review Board (IRB) approved consent and assent.
Neutrophil isolation
Mononuclear cells and neutrophils were isolated as previously published [25]. Neutrophil purity was greater than 90% as determined by flow cytometry analysis (LSR II, BD Biosciences, San Jose, CA.) using antibodies to antigens found on the surface of neutrophils (CD10, 7D5, CD11a, CD11b, CD13, CD45, CD67, CD66b, and CD63). All aforementioned antibodies were bought from BD Biosciences (San Jose, CA) and used as per manufacturer’s instructions. First red blood cells (RBCs) were lysed, then normal neutrophils were used as targets in cell death assays. Due to decreased absolute neutrophil numbers, patient neutrophils were used exclusively for RNA purification and Fas expression analysis by FACS (FACS Caliber, BD Biosciences, San Jose, CA.).
Cell death assay
50, 100, 200, or 400 μl of either healthy control, disease control, or patient plasma was added to 100,000 neutrophil cells/ml and incubated at 37 °C for 20 min, 1 h or 4 h. 200 μl was shown to be the optimal amount for the assay tested at 4 h. Cells were then stained with Annexin-V and Propidium Iodide (PI) (BD Biosciences, San Jose, CA.) and analyzed for apoptosis and necrosis using FACS (FACS Caliber, BD Biosciences, San Jose, CA.).
Anti-neutrophil antibody detection
Neutrophils were isolated from freshly drawn normal type ‘O’ whole blood anticoagulated with ethylenediaminetetraacetate (EDTA). Donor blood was screened for normal neutrophil surface expression of CD11b, CD18, CD15, CD16, and CD45 as well as screened for absence of anti-neutrophil antibodies.
Other cell preparations
CD4+ T cells were purified with CD4+ Rosette Kit (Stemcell Technologies) according to manufacturer’s instructions. CD4+ T cell fraction was tested for purity (over 97%). Jurkat cells were obtained from the laboratory of Dr. David Cornfield (Stanford University). HL60 cells were obtained from the laboratory of Dr. John Whitin (Stanford University).
RNA isolation
Total RNA was isolated from neutrophils using the total RNA isolation protocol from the RNA RT-PCR Miniprep kit (Stratagene, La Jolla, CA) with the following modifications: 100,000 cells were lysed in 150 μl of lysis buffer. For DNA digestion, two units of DNAse were added/μg nucleic acid, and Phenol/CHCl3 (Sigma-Aldrich, St. Louis, MO) was used to purify total RNA followed by ethanol precipitation. The quantity of total RNA was measured using Nanodrop ND 100 (Nanodrop Technologies, Rockland, DE). 100 ng of each RNA sample was used for target labeling by a two-round amplification protocol.
Real-time PCR analysis
RNA was isolated using RNeasy mini kits (Qiagen, Valencia, CA.) according to the manufacturer’s instructions. For cDNA synthesis, 500 ng total RNA was transcribed with cDNA transcription reagents (Applied Biosystems, Foster City, CA.) using random hexamers, according to the manufacturer’s instructions. Gene expression was measured in real-time with the GeneAmp 7900 Sequence Detection System (Applied Biosystems, Foster City, CA.) using primers and other reagents purchased from Applied Biosystems. The expression level of a gene in a given sample was represented as 2−ΔΔCt where ΔΔCT = [ΔCT(experimental)] − [ΔCT(medium)] and ΔCT = [CT(experimental)] − [CT(housekeeping)]. All PCR assays were performed in triplicate. 100 ng of total RNA isolated from neutrophils from patients or healthy controls and submitted to reverse transcription (Invitrogen, Carlsbad, CA). 50 ng of resulting cDNA was submitted to TaqMan™ PCR on a 7900HT qPCR machine (Applied Biosystems,, Foster City, CA) using gene-specific, fluorochrome-labeled probe/primer sets purchased from Applied Biosystems. Data is presented normalized to GUS (Glucuronidase) as the housekeeping gene. All fold expression is expressed as compared to healthy controls (n=4).
Cytometric bead array
FACS detection of cytokines and chemokines was performed using cytometric bead array kits (BD Biosciences, San Jose, CA) according to manufacturer’s recommendations. These molecules included IL-2, IL-4, IL-6, IL-10, IFN-γ, TNF-α,GM-CSF and sFasL. Bead flow cytometry enables for the quantification of various proteins to be done concurrently. The assays incorporate beads of equal size, which are then distinguished by varying fluorescence intensities. Beads with the same fluorescence are coated with the same antibody against the target molecule, and the reaction is then revealed by the incorporation of a secondary antibody that is conjugated with a different fluorochrome. 50 μl of plasma per test was used. Samples were analyzed by FACS Caliber (BD Biosciences, San Jose, CA) using BD Cytometric Bead Array software (BD Biosciences, San Jose, CA).
Mixing experiments
Patient plasma was mixed with healthy control plasma for a total of 200 μl of plasma in 100,000 neutrophils cells/ml, and then analyzed for the killing effect of the total plasma compared to either control plasma or neutropenic plasma. 1:1 and 4:1 ratios of control plasma: neutropenic patient plasma was used.
IgG fractionation
IgG fractionation took place using the ImmunoPure (Protein A) IgG Purification Kit from Pierce Technologies (Waltham, MA.) and following the manufacturer’s recommendations. 2 ml of patient plasma were fractionated and the fractioned plasma was tested and analyzed for the inducing of neutrophil apoptosis.
Size chromatography
Sizing spin columns (Millipore Spin-Out 12,000 Microcolumns (Billerica, MA.) and Pierce MicroSpin Columns) were used as per manufacturer’s instructions.
sFasL-mediated death
sFasL (cleaved form of FasL) was obtained (R&D Systems, Minneapolis, MN.) and used directly at 0 pg/ml, 1 pg/ml, 10 pg/ml, and 50 pg/ml concentrations with 100,000 neutrophils cells/ml and incubated at 37 °C for 4 h.
Results and discussion
23 patients with IN (chronic (defined as absolute neutrophil counts <1500/μl over 6 months or more), n=7, CIN and acute, n=16, AIN) with median age of 2 years (range: 3 months to 11 years) and median absolute neutropenia count (ANC) of 500 (range: 100 to 1500) were enrolled. The patient’s clinical histories ranged from no infections to otitis media, bronchiolitis, or oral ulcers. No serious life-threatening infections or blood-born infections were observed. Normal, non-neutropenic age-matched controls (HC, n=4) and patients with chemotherapy-induced neutropenia (CC, n=3) (Table 1). After screening a number of cytokines (IL-2, IL-6, IL-8, TNF-α), growth factors (G-CSF), cell death factors (Fas, FasL, Perforin, TRAIL or tumor necrosis factor-related apoptosis-inducing ligand), and chemokines (XCL1, XCR1) known to cause apoptosis, QT-PCR studies of all neutropenic patients’ neutrophils (n=23) indicated an up-to-14-fold increase in Fas and/or FasL transcripts when compared to healthy control neutrophil expression (n=4) (Fig. 1A). The membrane-bound FasL can be cleaved by metalloproteinase to generate the soluble Fas ligand (sFasL) which is mainly a non-covalently linked homotrimer; therefore, we assessed the levels of MMP 7, 8, and 3 which have been found to generate sFasL in neutrophils [24,25]. MMP7, which was found in these studies to be significantly upregulated in IN patients, has been found to generate a distinct form of sFasL with pro apoptotic activity [25]. Death factors associated with Fas/FasL were increased but neither TRAIL nor perforin was increased (Fig. 1B) in IN patients. In addition, no difference in GCSF expression was detected in patients vs. healthy controls (Fig. 1B). When examining the expression of Fas/FasL in neutrophils from CC (Figs. 1C and D), TRAIL and perforin were increased compared to HC. Overall, both Fas and FasL were increased in AIN and CIN neutrophils compared to healthy controls neutrophils. To test this further, we examined not only transcript but also protein levels of Fas in patients compared to controls.
Table 1.
Patient demographics and apoptosis phonotype
| Patient number | Type | Age at diagnosis | Anti-neutrophil Ab | Fold increase in death over control plasma | Fold increase in apoptosis over control plasma | sFasL (pg/ml) | ANC |
|---|---|---|---|---|---|---|---|
| 1 | Chronic | 2 years | Negative | 6.5±0.7 | 8.5±0.8 | 7±1 | 330 |
| 2 | Chronic | 20 months | Positive | 7.3±0.5 | 8.1±0.2 | 6±1 | 798 |
| 3 | Chronic | 2 years | Negative | 7.8±0.6 | 8.5±0.4 | 5±0.5 | 190 |
| 4 | Chronic | 1 years | N/D | 6.5±0.5 | 7.3±0.6 | 5±2 | 200 |
| 5 | Chronic | 5 years | Negative | 6.1±0.9 | 2.7±0.2 | 7±1 | 490 |
| 6 | Chronic | 3 years | Negative | 11.3±1.4 | 2.1±0.5 | 10±1 | 300 |
| 7 | Chronic | 11 months | Negative | 6.1±0.8 | 5.7±0.6 | 6±1 | 1300 |
| 8 | Acute | 2 years | N/D | 18.7±1.3 | 22.4±2.9 | 16±2 | 1040 |
| 9 | Acute | 2 years | Negative | 12.0±2.1 | 19.1±2.5 | 18±3 | 170 |
| 10 | Acute | 5 years | Negative | 2.5±0.5 | 2.6±0.4 | 4±1 | 495 |
| 11 | Acute | 11 months | N/D | 1.5±0.3 | 2.1±0.2 | 3±0.6 | 100 |
| 12 | Acute | 3 years | Negative | 15.3±1.2 | 19.2±0.8 | 17±1 | 200 |
| 13 | Acute | 2 years | Negative | 18.5±1.4 | 39.5±2.4 | 40±3 | 200 |
| 14 | Acute | 2 years | N/D | 14.3±1.0 | 20.5±1.2 | 21±2 | 150 |
| 15 | Acute | 8 months | N/D | 9.6±0.8 | 12.0±1.6 | 10±0.9 | 500 |
| 16 | Acute | 17 months | Negative | 21.3±2.2 | 26.7±3.5 | 19±3 | 218 |
| 17 | Acute | 6 years | N/D | 6.7±1.3 | 11.5±2.1 | 8±1 | 200 |
| 18 | Acute | 3 years | N/D | 7.2±2.6 | 8.8±1.5 | 9±2 | 1350 |
| 19 | Acute | 11 years | Negative | 14.8±0.9 | 17.4±1.9 | 12±2 | 1500 |
| 20 | Acute | 4 months | N/D | 6.2±1.0 | 8.1±2.2 | 8±2 | 700 |
| 21 | Acute | 3 months | N/D | 21.4±3.5 | 39.4±2.4 | 27±3 | 200 |
| 22 | Acute | 11 years | Negative | 17.2±3.0 | 24.3±2.8 | 22±1 | 630 |
| 23 | Acute | 2 years | Positive | 15.8±1.2 | 25.0±1.7 | 18±2 | 1210 |
| HC 1 | N/A | 4 years | N/D | 1.2±0.3 | 0.8±0.4 | 0.3±0.1 | 9600 |
| HC 2 | N/A | 2 months | N/D | 0.5±0.6 | 0.6±0.3 | 0.8±0.3 | 8500 |
| HC 3 | N/A | 1 year | N/D | 1.0±0.5 | 0.1±0.1 | 0.1±0.1 | 7300 |
| HC 4 | N/A | 8 years | N/D | 1.1±0.3 | 0.7±0.5 | 0.4±0.2 | 6800 |
| CC 1 | Chemo | 7 years | Negative | 2.0±0.5 | 1.7±0.6 | 2±0.5 | 0 |
| CC 2 | Chemo | 10 years | Negative | 1.2±0.8 | 1.5±0.5 | 1.4±0.3 | 0 |
| CC 3 | Chemo | 16 years | Negative | 1.6±0.3 | 1.0±0.4 | 1.8±0.5 | 500 |
Abbreviations: N/A = not applicable and N/D = not determined, HC = healthy control, CC = chemotherapy-induced neutropenia control.
Figure 1.

Fas, FasL, and MMP 7 Transcript expression increased in IN neutrophils as compared to HC neutrophils. QT-PCR results from neutrophils purified from n=23 patients with IN (acute idiopathic neutropenia n=16 and chronic idiopathic neutropenia n=7) with specified transcript expression over healthy control neutrophils. Chronic IN patients are denoted as hollow circles. All hollow squares represent acute IN patients (panels A and B). QT-PCR results from neutrophils purified from n=3 patients with chemotherapy-induced neutropenia (CC) with specified transcript expression over healthy control neutrophils. CC patients are denoted as filled circles (panels C and D). The transcripts found to have similar expression levels to that of healthy controls were 1× fold expression.
Protein levels of Fas on the cell surface of patient neutrophils were assessed (Fig. 2). Bimodal Fas populations of differential Fas density were detected in both healthy and patient neutrophils. Gates were used based on multicolor positivity using fluorescence-conjugated antibodies to specifically detect the neutrophil population (LSRII, Materials and methods). The representative patient (Fig. 2A) neutrophils express Fas at a mean fluorescence intensity (MFI) of 35 as compared to normal neutrophils at MFI of 10 (designated initially as Faslo). We performed FACS analysis of Fas expression on neutrophils from AIN, CIN and CC patients. In addition Fas expression was compared to CD4+ (AIN and CIN), CD4+(HC), HL60, and Jurkat cells. In Figure 2D, we compare the fold expression difference of Fas to that of HC neutrophils. As predicted, Fas expression was increased in the positive control Jurkat cell which is known to express high levels of Fas [26]. In summary, Fas levels were increased in neutrophils of patients with AIN and CIN as compared to HC and other immune cells.
Figure 2.

Fas protein expression increased in IN neutrophils and increased in HC neutrophils after incubation with IN plasma. (A) Fas expression, healthy control neutrophils (closed) vs. representative patient neutrophils (open). (B) Fas expression, 20 min after incubation of HC neutrophils with 200 μl of HC plasma (closed) vs. 200 μl of representative IN patient plasma (open). (C) Fas expression, 6 h after incubation of HC neutrophils with HC plasma (closed) vs. representative IN patient plasma (open). (D) Summary graph for all patients: Fold increase in Fas expression (MFI) as compared to HC Neutrophil from IN-derived neutrophils (n=23), CC neutrophils (n=3), IN-derived CD4+ cells (n=23), HC-derived CD4+ cells (n=4), Jurkat cells, HL60 cells. (E) Summary graph for all patients: fold increase in Fas expression (MFI) after incubation with patient plasma (n=23 patients) for 6 h as compared to incubation with HC plasma (n=4) for 6 h of the noted cell type on x axis. Due to low numbers of IN-derived neutrophils and CC-derived neutrophils and their shorter half lives over 6 h, these cells were unable to be used in the experiment. Neutrophils from HC, IN-derived CD4+ cells, HC-derived CD4+ cells, Jurkat cells, HL60 cells were incubated with plasma. (F) Summary graph of Fas expression after the depletion of sFasL from plasma using anti-sFasL blocking antibody (BD Biosciences) was used according to Materials and methods. Isotype control was used as per manufacturer’s instructions. Patient plasma (n=23) was depleted of sFasL and incubated for 6 h with HC neutrophils to determine fold expression in Fas compared to HC plasma.
Next, we hypothesized that the increase in Fas on the neutrophil cell surface might be due to factors in the patient plasma since others had found that IFN-γ induces Fas expression [27] and levels of sFasL are associated with modulation of Fas expression [28]. Therefore, patient or normal control plasma was incubated with normal neutrophils (since patient neutrophils were short lived and in limited numbers, experiments were not conducted using patient neutrophils) and found an increase in Fas expression with patient plasma from 20 min to 6 h of incubation (a representative patient is shown in Figs. 2B and C). No increase in Fas surface expression was seen on CD4+T cells from either IN or HC CD4+ samples. The increase in Fas expression was more pronounced after HC neutrophils were incubated with AIN plasma (Fig. 2E). Overall, there was an increase in MFI of Fas after incubation of patient plasma with HC neutrophils (Fig. 2E). Depletion of plasma using sFasL blocking antibody (Fig. 2F) abrogated the ability of patient plasma to increase Fas levels on neutrophils. Depletion of plasma using IFN-γ antibody did not change the Fas expression on neutrophils. Therefore, these data would suggest that sFasL in the patient plasma is associated with modulation of Fas levels on neutrophils.
We next hypothesized that sFasL levels could be increased in the plasma of IN patients compared to HC since Fas (Figs. 1 and 2) and FasL levels (Fig. 1) were found to be increased in IN patients. Interestingly, higher levels of sFasL had been found in neutropenic patients with T cell large granular lymphocytosis [23]. Cytometric bead array (CBA)(BD Biosciences, San Jose, CA) analysis of patient plasma (n=23), disease controls and normal controls was performed. Patient plasma showed increased sFasL in acute and chronic patients (up to 40-fold higher) (p≤0.001) (Table 1). Other factors such as TNF-α, GCSF, IL-6, IL-10, and IL-8 were tested by CBA, but these levels were highly variable with no significant differences (p>0.55) detected between AIN, CIN, HC or CC. After longitudinal studies in a small number of acute IN patients with resolution of their neutropenia (n=3), normalization of levels of sFasL (i.e. to HC sFasL levels) were detected (data not shown). In summary, there were overall higher levels of sFasL in IN patients, specifically more in the acute IN patients compared to chronic IN patients. In addition, others have shown that sFasL has effects on neutrophil recruitment [29]. It is possible that an autocrine “death signal” loop might be occurring in the neutrophils of IN patients. Our data suggest that sFasL may be associated with the initiation and maintenance of neutrophil cell death in idiopathic neutropenia.
In addition to the possible association of the Fas/FasL pathway with the pathophysiological mechanisms of IN in the periphery, it remains possible that a defect in synthesis of neutrophil progenitors or increased apoptosis of neutrophil progenitors from the bone marrow of these pediatric IN patients could exist as well. For example, in late onset (adulthood) chronic idiopathic neutropenia, others have demonstrated an increase in apoptosis of bone marrow myeloid progenitor cells and bone marrow failure [30–32]. Bone marrow biopsies were not performed in the pediatric IN subjects studied here. In addition, GCSF is not always effective in this pediatric IN population. GCSF-mediated signaling pathways have been found to be associated with the activation of STAT3 [33]. STAT3 activation has been found to modulate the Fas/FasL pathway [34,35], possibly rendering activation of the STAT3 pathway less responsive to GCSF. STAT3-independent granulopoiesis exists which could explain the reversibility of neutropenia in IN patients without the use of GCSF [33]. It is also of interest that no significant differences were seen the Fas/FasL pathway assessments in patients with or without autoantibodies to neutrophils. The method of detecting autoantibodies was standard and reproducible (Materials and methods); therefore, it is possible that there is a common end pathway associated with Fas/FasL mediated cell death in the pediatric IN patients with or without autoantibodies used in this study.
We tested if the plasma from patients with IN (with or without autoantibodies to neutrophils) could directly mediate neutrophil cell death and if so, whether this function was dependent upon sFasL. Plasma from patients was incubated with HC neutrophils at different concentrations and time courses. Figure 3 demonstrates an 18 fold increase in total cell death (apoptosis+necrosis) of normal neutrophils (11.9 total vs. 0.64 total) (as evaluated by PI/Annexin) from incubation with 200 μl of representative patient plasma compared to normal plasma. After collecting individual data (Table 1), the fold increase of cell death (apoptosis + necrosis) and increase of apoptosis were assessed. A one way ANOVA analyses using Newman–Keuls multicomparison test was utilized (Figs. 4A, B, C). The most significant differences (p≤0.01) in fold increase in cell death was between the AIN patients and HC. When a linear regression analysis was performed for sFasL concentration as compared to fold increase in apoptosis, a Spearman Test showed R=0.87 correlation (Fig. 4D). A comparison of sFasL and ANC levels was performed with the acute IN and chronic IN patients using a Pearson correlation test (R=−0.65, R=−0.79, respectively). These possible correlations would suggest that the Fas/FasL pathway may be associated with the pathology involved with neutropenia in pediatric AIN and CIN.
Figure 3.
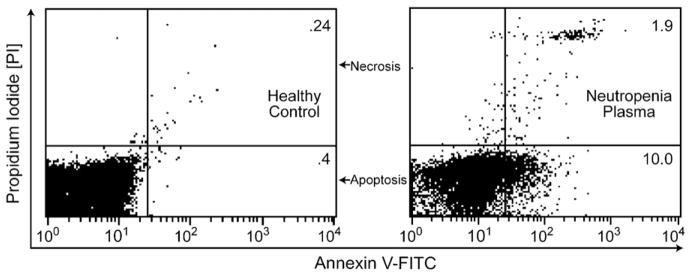
Incubating HC neutrophils with IN patient plasma increases cell death. Freshly purified neutrophils were incubated with 200 μl of healthy, non-neutropenic plasma, or neutropenic patient plasma at 37 °C for 4 h. Neutrophils were stained by Annexin-V-FITC and propidium iodide (PI) and analyzed for apoptosis and necrosis by flow cytometry, demonstrating a 18.5 fold increase in cell death with neutropenic patient plasma versus healthy control.
Figure 4.
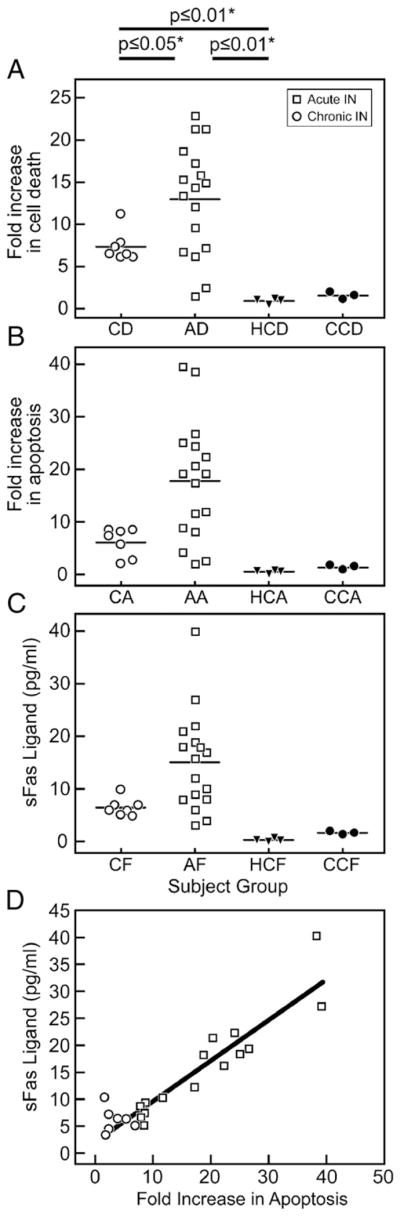
(a–d) Comparison of HC, IN (chronic and acute), CC (chemotherapy-induced neutropenia) plasma-mediated cell death and sFasL levels. Significance was determined by on one way ANOVA analysis, Newman–Keuls Multicomparison test for all panels A, B, and C. (A) Fold increase in cell death (apoptosis+necrosis) above healthy control on y axis, x axis represents individuals in patient groups (CD = chronic neutropenia cell death comparison, AD = acute neutropenia cell death comparison, HCD = healthy control cell death comparison at 1×, and CCD = chemotherapy-induced neutropenia cell death comparison). (B) Fold increase in apoptosis above healthy control on y axis, x axis represents individuals in patient groups (CA = chronic neutropenia apoptosis comparison, AA = acute neutropenia apoptosis comparison, HCA = healthy control apoptosis comparison at 1×, and CCA = chemotherapy-induced neutropenia apoptosis comparison). (C) Levels of sFasL on y axis, x axis represents individuals in patient groups (CF = chronic neutropenia, AF=acute neutropenia, HCF = healthy control, and CCF = chemotherapy-induced neutropenia). (D) Linear regression analysis shown. Spearman Test showed R=0.87 correlation. Individual data can be viewed in Table 1. Hollow circles represent chronic IN samples and hollow squares represent acute IN samples.
In addition to Fas/FasL pathway factors, there could be other factor(s) in the IN patient plasma associated with cell death so a series of biochemical studies was performed. Mixing experiments of normal and patient plasma at 1:1 and 4:1 ratios demonstrated that the killing effect was not inhibited by HC plasma (n=8). The cell death activity was found to be preserved in sample fractions after IgG exclusion; size exclusion chromatography revealed a factor with a molecular weight between 12 kD and 50 kD, which was inactivated upon heat denaturation. Incubation with HC neutrophils directly with recombinant sFasL (R&D Systems) resulted in a twofold increase in cell death with 50 pg/ml of sFasL (Figs. 5A and B). The explanation for this small increase in cell death compared to the fold increases in cell death seen in Table 1 with IN plasma is that the ED50 for the recombinant sFasL (compared to in vivo sFasL) is typically 1–3 ng/ml which demonstrates less potency in the recombinant product as compared to the in vivo sFasL in patient plasma. Since no cross linking antibody was used in the experiments shown in Figure 5, the recombinant sFasL (R&D Systems) is less likely to induce trimerization of Fas which is known to be important for mediating apoptosis [25,26].
Figure 5.
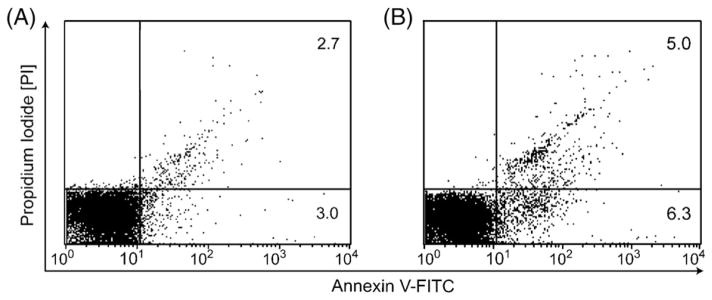
Recombinant sFasL induces apoptosis of HC neutrophils with less potency. Annexin/PI staining of HC neutrophils after incubation with recombinant sFasL after 4 h (R&D systems). (A) Healthy control neutrophil with media. (B) With 50 pg/ml of recombinant sFasL.
In order to test specificity of the plasma factor for neutrophils, patient plasma was incubated with patient CD4+ Tcells or HL60 cells. In Figures 6A and B, respectively, neither showed a pattern of cell death similar to that of neutrophils. In addition, patient plasma was added to Jurkat cells which are known to undergo apoptosis via Fas-associated death domain protein and sFasL [26]. All patient plasma tested (n=5) successfully induced apoptosis and necrosis of Jurkat cells after 4 h of incubation (up to 10 fold higher than HC plasma under the same conditions). In summary, the data suggest that the plasma-derived factor of 12–50 kD preferentially uses neutrophils as targets, rather than autologous CD4+ cells and that the level of expression of Fas could be important in the targeting process.
Figure 6.
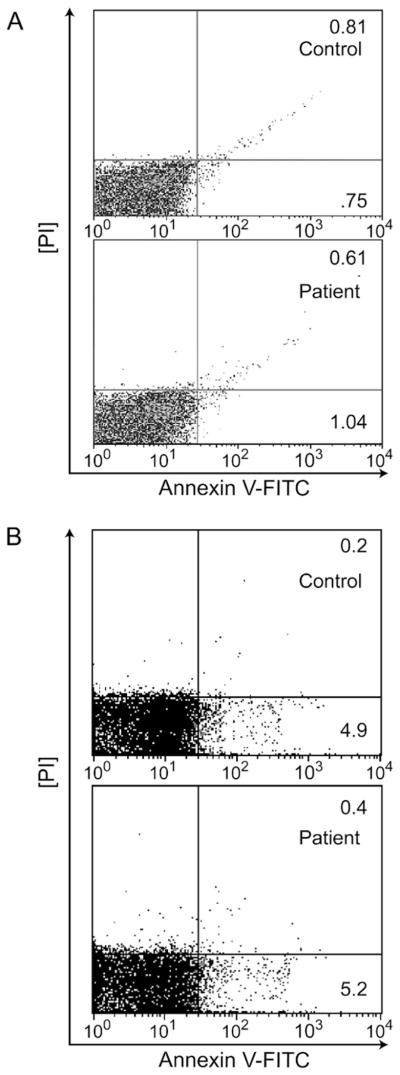
Subject plasma does not induce CD4+ cell or HL60 cell death. (A) CD4+ Tcells were isolated and incubated with 200 μl of HC or IN plasma for 4 h. Following the incubation, T cells were stained by Annexin-V-FITC and propidium iodide (PI) and analyzed for apoptosis and necrosis by flow cytometry. There was no apparent difference in cells incubated with healthy (n=4) or neutropenic plasma (n=23). Plasma incubations with representative healthy plasma and IN plasma are shown here. (B) HL60 cells were isolated and incubated with 200 μl of HC or IN plasma for 4 h. Following the incubation, HL60 cells were stained by Annexin-V-FITC and propidium iodide (PI) and analyzed for apoptosis and necrosis by flow cytometry. There was no apparent difference in cells incubated with healthy (n=4) or neutropenic plasma (n=23). Plasma incubations with representative healthy plasma and IN plasma are shown here.
In order to determine the identity of the plasma factor(s) which was associated with neutrophil cell death, co-incubation of blocking anti-sFasL antibodies (BD Biosciences, San Jose, CA) with representative patient plasma caused a statistically significant 5-fold decrease in neutrophil apoptosis by Annexin/PI cell death assay (Figs. 7A and B), approaching the rates of normal controls (Fig. 7C) (p≤0.01; n=8). Blocking antibodies to Fas (BD Biosciences, San Jose, CA.) were used and showed similar results (not shown). sFasL-depleted plasma (confirmed by CBA (BD Biosciences, San Jose, CA)) which detected no sFasL in plasma after depletion) also resulted in significantly decrease in neutrophil apoptosis (Fig. 7D). Figure 7E depicts fold increase in cell death in all of the patients (n=23) plasma after immunodepletion. These results show that sFasL may be a mediator of neutrophil destruction in IN.
Figure 7.

Induction of cell death can be blocked with anti-sFasL antibodies. The same representative patient is shown in panels A, B, C and D. Panels E and F represent a summary graph on all patients. (A) Representative idiopathic neutropenia patient with necrosis and apoptosis of 5.6% and 15.7%, respectively. (B) A blocking monoclonal murine anti-human anti Fas ligand antibody that recognizes sFasL and blocks cytotoxicity (NOK-2 clone, BD Biosciences) was used in cultures with neutrophils treated with patient and control plasma plus 1 μg/ml of blocking antibody for 4 h then analyzed by FACS for apoptosis and necrosis using Annexin-V-FITC and PI stains. Titrations of 0.01 μg/ml, 0.1 μg/ml and 10 μg/ml were also used showing increasing ability of the blockade effect. Optimal blockade was noted at 1 μg/ml (as shown in panel B). Similar titrations of isotype control antibody (BD Biosciences) incubation with patient and control plasma did not lead to any measure of blockade of apoptosis or necrosis. (C) healthy control plasma for comparison. (D) Mouse anti-human sFasL antibodies (NOK-1 clone, BD Biosciences) were incubated with rat anti-mouse IgG1 microbeads (Miltenyi) and plasma was purified via micro magnetic columns according to manufacturer’s instructions to decrease levels of sFasL in the plasma. This was repeated twice for each sample. (E) Effects of Blocking sFasL antibody on fold increase in Cell Death where n=23 IN patients whose plasma (200 μl) was incubated with 1 μg/ml of anti-sFasL blocking antibody for 4 h (NOK-2 clone, BD Biosciences). (F) Effects of plasma after depletion of sFasL on fold increase in Cell Death where n=23 IN patients.
In summary, these data suggest that sFasL in the plasma of patients with pediatric IN (acute and chronic IN), may mediate cell death of neutrophils in vitro and that the Fas/FasL apoptotic pathway could play a role in the pathogenesis of neutropenia in these patients.
Acknowledgments
This study was supported by grants from CHRP. We thank the neutropenia and healthy patients who provided samples for the study. We thank Dr. Jim Schilling for protein separation advice, Dr. John Whitin for HL60 cells, and Dr. David Cornfield for Jurkat cells. We thank Dr. Carol Clayberger and Alan Krensky for use of laboratory space and equipment during initial phases of the study.
Footnotes
Supported in part by a grant from the Children’s Hospital Research Program (CHRP), Stanford University School of Medicine.
None of the authors have conflicting financial interests.
References
- 1.Sera Y, Kawaguchi J, Nakamura K, Sato T, Habara M, Okada S, Ishikawa N, Kojima S, Katoh O, Kobayashi M. A comparison of defective granulopoiesis in childhood cyclic neutropenia and in severe congenital neutropenia. Haematologica. 2005;90:1032–1041. [PubMed] [Google Scholar]
- 2.Carlsson G, Melin M, Dahl N, et al. Kostmann syndrome or infantile genetic agranulocytosis, part two: Understanding the underlying genetic defects in severe congenital neutropenia. Acta Paediatr. 2007;96:813–819. doi: 10.1111/j.1651-2227.2007.00274.x. [DOI] [PubMed] [Google Scholar]
- 3.Donini M, Fontana S, Savoldi G, et al. G-CSF treatment of severe congenital neutropenia reverses neutropenia but does not correct the underlying functional deficiency of the neutrophil in defending against microorganisms. Blood. 2007;109:4716–4723. doi: 10.1182/blood-2006-09-045427. [DOI] [PubMed] [Google Scholar]
- 4.Capsoni F, Sarzi-Puttini P, Zanella A. Primary and secondary autoimmune neutropenia. Arthritis Res Ther. 2005;7:208–214. doi: 10.1186/ar1803. [DOI] [PMC free article] [PubMed] [Google Scholar]
- 5.Kuijpers TW. Clinical symptoms and neutropenia: the balance of neutrophil development, functional activity, and cell death. Eur J Pediatr. 2002;161(Suppl 1):S75–S82. doi: 10.1007/s00431-002-1009-6. [DOI] [PubMed] [Google Scholar]
- 6.Wright DG, Meierovics AI, Foxley JM. Assessing the delivery of neutrophils to tissues in neutropenia. Blood. 1986;67:1023–1030. [PubMed] [Google Scholar]
- 7.Cham B, Bonilla MA, Winkelstein J. Neutropenia associated with primary immunodeficiency syndromes. Semin Hematol. 2002;39:107–112. doi: 10.1053/shem.2002.31916. [DOI] [PubMed] [Google Scholar]
- 8.Bernini JC. Diagnosis and management of chronic neutropenia during childhood. Pediatr Clin North Am. 1996;43:773–792. doi: 10.1016/s0031-3955(05)70432-6. [DOI] [PubMed] [Google Scholar]
- 9.Weetman RM, Boxer LA. Childhood neutropenia. Pediatr Clin North Am. 1980;27:361–376. doi: 10.1016/s0031-3955(16)33856-1. [DOI] [PubMed] [Google Scholar]
- 10.Carlsson G, Aprikyan AA, Ericson KG, et al. Neutrophil elastase and granulocyte colony-stimulating factor receptor mutation analyses and leukemia evolution in severe congenital neutropenia patients belonging to the original Kostmann family in northern Sweden. Haematologica. 2006;91:589–595. [PubMed] [Google Scholar]
- 11.Grenda DS, Murakami M, Ghatak J, Xia J, Boxer LA, Dale D, Dinauer MC, Link DC. Mutations of the ELA2 gene found in patients with severe congenital neutropenia induce the unfolded protein response and cellular apoptosis. Blood. 2007;110:4179–4187. doi: 10.1182/blood-2006-11-057299. [DOI] [PMC free article] [PubMed] [Google Scholar]
- 12.Lekstrom-Himes JA, Gallin JI. Immunodeficiency diseases caused by defects in phagocytes. N Engl J Med. 2000;343:1703–1714. doi: 10.1056/NEJM200012073432307. [DOI] [PubMed] [Google Scholar]
- 13.Bruin MC, von dem Borne AE, Tamminga RY, Kleijer M, Buddelmeijer L, de Haas M. Neutrophil antibody specificity in different types of childhood autoimmune neutropenia. Blood. 1999;94:1797–1802. [PubMed] [Google Scholar]
- 14.Bux J, Behrens G, Jaeger G, Welte K. Diagnosis and clinical course of autoimmune neutropenia in infancy: analysis of 240 cases. Blood. 1998;91:181–186. [PubMed] [Google Scholar]
- 15.Kobayashi M, Nakamura K, Kawaguchi H, et al. Significance of the detection of antineutrophil antibodies in children with chronic neutropenia. Blood. 2002;99:3468–3471. doi: 10.1182/blood.v99.9.3468. [DOI] [PubMed] [Google Scholar]
- 16.Morgan E, Varro R, Sepulveda H, et al. Cytometric bead array: a multiplexed assay platform with applications in various areas of biology. Clin Immunol. 2004;110:252–266. doi: 10.1016/j.clim.2003.11.017. [DOI] [PubMed] [Google Scholar]
- 17.Liu J, Wei S, Lamy T, Djeu J, Loughran T. Chronic Neutropenia mediated by Fas ligand. Blood. 2000;95:3219–3222. [PubMed] [Google Scholar]
- 18.Grenda D, Murakami M, Ghatak J, Xia J, Boxer L, Dale D, Dinauer M, Link D. Mutations of the Ela2 gene found in patients with severe congenital neutropenia induce the unfolded protein response and cellular apoptosis. Blood. 2007 doi: 10.1182/blood-2006-11-057299. E publication. August 27, 2007. [DOI] [PMC free article] [PubMed] [Google Scholar]
- 19.Kuijpers TW. Clinical symptoms and neutropenia: the balance of neutrophil development, functional activity, and cell death. Eur J Pediatr. 2002;161(Suppl 1):S75–S82. doi: 10.1007/s00431-002-1009-6. [DOI] [PubMed] [Google Scholar]
- 20.Wright DG, Meierovics AI, Foxley JM. Assessing the delivery of neutrophils to tissues in neutropenia. Blood. 1986;67:1023–1030. [PubMed] [Google Scholar]
- 21.Cham B, Bonilla MA, Winkelstein J. Neutropenia associated with primary immunodeficiency syndromes. Semin Hematol. 2002;39:107–112. doi: 10.1053/shem.2002.31916. [DOI] [PubMed] [Google Scholar]
- 22.Weetman RM, Boxer LA. Childhood neutropenia. Pediatr Clin North Am. 1980;27:361–376. doi: 10.1016/s0031-3955(16)33856-1. [DOI] [PubMed] [Google Scholar]
- 23.Lamy T, Liu J, Landowski TH, Loughran TP. Dysregulation of CD95/CD95 ligand-apoptotic pathway in CD3(+) large granular lymphocyte leukemia. Blood. 1998;92:4771–4777. [PubMed] [Google Scholar]
- 24.Jethwaney D, Islam M, Leidal K, Gibson B. Proteomic analysis of plasma membrane and secretory vesicles of human neutrophils. Proteome Science. 2007;10:5–12. doi: 10.1186/1477-5956-5-12. [DOI] [PMC free article] [PubMed] [Google Scholar]
- 25.Vargo-Gogola T, Crawford HC, Fingleton B, Matrisian LM. Identification of novel MMP-7 cleavage sites in murine and human Fas ligand. Arch Biochem Biophys. 2002;408:155–161. doi: 10.1016/s0003-9861(02)00525-8. [DOI] [PubMed] [Google Scholar]
- 26.Vanden Berghe T, Van Loo G, Vandenabeele P. Differential Signaling to apoptotic and necrotic cell death by Fas-associated death domain protein FADD (in Jurkat cells) J Biol Chem. 2004;279:7925–7933. doi: 10.1074/jbc.M307807200. [DOI] [PubMed] [Google Scholar]
- 27.Dorne J, Sapala K, Zunino SJ. IFN-γ increases the expression of CD95 in leukemic cells. Cytokine. 2002;18:98–107. doi: 10.1006/cyto.2002.1030. [DOI] [PubMed] [Google Scholar]
- 28.Urbaniak-Kujda D, Wolowiec D, Kuliczkowski K. Expression of Fas receptor and sFasL is acute leukemia. Pol Arch Med Wewn. 2002;108:873–878. [PubMed] [Google Scholar]
- 29.Dupont PJ, Warrens AN. FasL exerts its pro-inflammatory effects via neutrophil recruitment but not activation. Immunology. 2007;120:133–139. doi: 10.1111/j.1365-2567.2006.02504.x. [DOI] [PMC free article] [PubMed] [Google Scholar]
- 30.Papadaki HA, Eliopoulos AG, Kosteas T, Gemetzi C, Damianaki A, Koutala H, Bux J, Eliopoulos GD. Impaired granulocytopoiesis in patients with chronic idiopathic neutropenia is associated with increased apoptosis of bone marrow myeloid progenitor cells. Blood. 2003;101:2561–2600. doi: 10.1182/blood-2002-09-2898. [DOI] [PubMed] [Google Scholar]
- 31.Koumaki V, Papadaki HA, Stefanaki K, Vrentzos G, Eliopoulos GD. Increased cell apoptosis in bone marrow trephine biopsies and immunomagnetically isolated myeloid progenitor cells in patients with chronic idiopathic neutropenia. Ann Hematol. 2003;82:641–645. doi: 10.1007/s00277-003-0709-y. [DOI] [PubMed] [Google Scholar]
- 32.Papadaki HA, Eliopoulos GD. The role of apoptosis in the pathophysiology of chronic neutropenias associated with bone marrow failure. Cell Cycle. 2003;2:447–451. [PubMed] [Google Scholar]
- 33.Lee C, Raz R, Takeshita R, DePinho R, Levy D. STAT3 is a negative regulatory of granulopoiesis but is not required for GCSF-dependent differentiation. Immunity. 2003;17:63–72. doi: 10.1016/s1074-7613(02)00336-9. [DOI] [PubMed] [Google Scholar]
- 34.Pan H, Hong F, Radaeva S, Gao B. Gene therapy of IL-22 protects from Fas L induced injury via activation of STAT3. Cell Mol Immunol. 2004;22:43–49. [PubMed] [Google Scholar]
- 35.Ivanov VN, Levy D, Horvath CM, Ronai Z. Cooperation between STAT3 and cJun suppresses Fas transcription. Mol Cell. 2001;51:517–528. doi: 10.1016/s1097-2765(01)00199-x. [DOI] [PubMed] [Google Scholar]