

Abstract
Human cytomegalovirus (HCMV) infection of the neonatal CNS results in long-term neurologic sequelae. To define the pathogenesis of fetal HCMV CNS infections, we investigated mechanisms of virus clearance from the CNS of neonatal Balb/c mice infected with murine CMV (MCMV). Virus titers peaked in the CNS between post-natal (PN) days 10–14 and infectious virus was undetectable by PN day 21. Congruent with virus clearance was the recruitment of CD8+ T-cells into the CNS. Depletion of CD8+ T cells resulted in death by postnatal day 15 in MCMV infected animals and increased viral loads in the liver, spleen and the CNS suggesting an important role for these cells in the control of MCMV replication in the newborn brain. Examination of brain mononuclear cells revealed that CD8+ T-cell infiltrates expressed high levels of CD69, CD44 and CD49d. IE1168 specific CD8+ T-cells accumulated in the CNS and produced IFN-γ and TNF-α but not IL-2 following peptide stimulation. Moreover, adoptive transfer of brain mononuclear cells resulted in decreased virus burden in immunodepleted MCMV infected syngeneic mice. Depletion of the CD8+ cell population following transfer eliminated control of virus replication. In summary, these results show that functionally mature virus specific CD8+ T-cells are recruited to the CNS in mice infected with MCMV as neonates.
Keywords: T cells, viral, neuroimmunology, rodent
INTRODUCTION
Infection of the developing CNS with human cytomegalovirus (HCMV) can result in permanent neurological impairment (1–3). Intrauterine infection of the developing fetus with HCMV occurs in an estimated 40,000 infants infected each year in the US and 10% of these infants will exhibit CNS disease making congenital (present at birth) HCMV infection the most common viral cause of brain damage in the US (4). Although epidemiological studies have identified specific risk factors associated with maternal infection, intrauterine transmission, and long term neurological damage in infected infants, little is known about CNS infection in the fetus and newborn infant. The development of animal models of congenital HCMV infection has been limited by the strict species tropism of CMVs and the lack of efficient spread to the adult CNS (5). Murine models have been informative but CNS infection with murine CMV (MCMV) has required direct intracranial inoculation of virus, a mode of virus infection far removed from the route of CNS infection of the human fetus (6, 7).
Immunological control of HCMV infection has been studied extensively in immunocompromised allograft recipients and more recently in patients with HIV infections (8–13). These studies have demonstrated a critical role of adaptive immune responses including cytolytic and non-cytolytic antiviral activities mediated through virus specific CD8+ and CD4+ lymphocytes (10, 11, 13). Early studies suggested that congenitally infected infants lacked or had blunted HCMV specific T lymphocyte responses during infancy and restoration of these responses resulted in decreased virus shedding, findings consistent with the view that fetuses and newborn infants were susceptible to HCMV infection secondary to the immaturity of their immune responses (8, 14–17). Yet extremes in the phenotypic expression of disease in congenitally infected infants, particularly in regards to the CNS infection, suggested that other determinants of virus infection and host responses also influence the outcome of this infection. In addition, more recent studies have documented HCMV specific CD8+ and CD4+ responses in premature newborn infants and young infants, suggesting that results from previous studies of T-lymphocyte responses of young infants to HCMV require reinterpretation in light of more current assays of adaptive immune responses (18). Thus, it is unclear if the developmental immaturity of the immune system can entirely explain the susceptibility of the developing fetus to CNS infection.
Virus neutralizing antibodies have been demonstrated to play a key role in limiting dissemination of virus in MCMV infected animals (19, 20). Protective functions of virus specific CD8+ and CD4+ lymphocyte responses similar to those in humans have been well documented in MCMV infections (21–26). In contrast to the human infection, an extensive literature has shown that NK cells contribute to protective responses during MCMV infections (27–29). Although much has been learned from the study of innate and adaptive immune responses to HCMV and MCMV in the control of virus replication and persistence, the immunological responses that control and resolve CNS infections have not been sufficiently studied.
To define key steps in virus spread to the CNS and clearance of HCMV infection from the CNS, we developed a murine model of CNS infection with HCMV. In this model, newborn mice are infected by intraperitoneal inoculation of tissue culture derived MCMV. Infectious virus can be detected in the liver and spleen several days after infection and subsequently, virus can be recovered from the CNS. The histopathology of the CNS infection closely resembles that of the human infection with scattered foci of virus infected cells associated with infiltrating mononuclear cells throughout the brain (30, 31). This infection is associated with an intense inflammatory response in the CNS and developmental abnormalities in the hindbrain (32). Similar to the infection in peripheral organs such as the spleen and liver, virus replication is controlled in the CNS and infection is resolved by PN day 21.
In this report we have described host responses that contribute to the clearance of virus from the CNS in MCMV infected mice, specifically cellular components of adaptive immunity. Our findings demonstrate a critical role for MCMV specific CD8+ T lymphocytes in the resolution of this infection. Interestingly, the CD8+ T lymphocyte response in the CNS of infected animals increased throughout the infection whereas the CD4+ T lymphocyte response was minimal at all time points. Brain CD8+ T-cells displayed an activated phenotype and upregulated IFN-γ and TNF-α expression, following cognate peptide stimulation. These results suggested an important role for MCMV specific CD8+ T lymphocytes in the control and clearance of virus infection from the CNS of young animals.
Materials and Methods
Mice
Pathogen free male and female Balb/c mice were purchased from Charles River Laboratories. All breedings and experiments were done in accordance with the guidelines of the University of Alabama Birmingham – University Institutional Animal Care and Use Committee and with the University of Rijeka - Croatia animal use policies.
Virus and infection
For production of virus stocks, the Smith stain of MCMV (Obtained from ATCC VR-194) was propagated in mouse embryonic fibroblasts (MEFs). Infectious virus was detected as previously described (21). Organs were homogenized and virus quantitated by plaque assay. Virus titers are expressed as PFUs and correspond to the amount of infectious virus per gram tissue or per organ. Newborn pups (6–18 hours post-partum) were inoculated intraperitoneally with 200 PFU of tissue culture passaged MCMV Smith strain.
Quantification of MCMV using real time PCR
Animals were sacrificed and then perfused with ice-cold PBS. Organs were dissected and frozen at −70°C. Total DNA from brain, liver and spleen was isolated using QIAGEN QIAMP DNA kit as per the manufacturer’s instructions. Quantitative real-time PCR was performed using TaqMan chemistry by amplification of a fragment of IE1 exon-4 using the primers F 5’-GGC TCC ATG ATC CAC CCT GTT A-3’ and R 5’-GCC TTC ATC TGC TGC CAT ACT-3’. The probe (5’-AGC CTT TCC TGG ATG CCA GGT CTC A-3’) was labeled with reporter dye FAM and quencher dye TAMRA. To quantify viral genome copy number, serial dilutions (log10) of a plasmid with the cloned IE1 exon-4 PCR product was used to create a standard curve. Quantitative real time PCR was carried out using ABgene ABSOLUTE QPCR Low ROX master mix. Samples were run in duplicate using a two-step amplification protocol on the Bio-Rad iCycler.
Isolation of mononuclear cells
Brain mononuclear cells were isolated using a previously described protocol (33). Briefly, mice were sacrificed and perfused with cold PBS. Under sterile conditions, each brain was collected in RPMI-1% FCS and mechanically dissociated. A 30% Percoll/brain homogenate suspension was underlaid with one ml of 70% Percoll in DMEM and then centrifuged at 1050g for 30 min at 4°C. Cells in the interphase were collected and washed in RPMI-1% FCS and resuspended in FACS buffer or in RPMI-10% FCS. Liver mononuclear cells were isolated according to a previously described protocol with some modifications (34). Briefly, liver lobes were collected in 1% RPMI and dissociated by forcing the tissue through a steel gauze (Alfa Aesar). Dissociated tissue was incubated in collagenase (0.02%) and in DNase (0.002%) at 37°C for 30 min. Undigested tissue was removed by using a 70 um filter and mononuclear cells isolated by step-gradient Percoll centrifugation, as described above. Splenocytes were isolated as previously described (35).
Flow cytometry
Isolated cell populations were stained in FACS buffer (2% BSA, 0.2% sodium azide) for 30 min at 4°C in the dark and fixed in 1% Paraformaldehyde. Samples were acquired using a FACSCalibur (BD Biosciences). CD8α-APC, CD8α-PE, CD4-FITC, F4/80-APC, CD45-PE, CD45-FITC, CD69-PE, CD44-FITC, CD62L-FITC, CD49d-PE, CD40-PE, CD80-PE, IFN-γ-FITC, TNF-α-PE, IL2-PE and CD107a-PE were purchased from eBioscience (San Diego, CA). APC-conjugated H-2Ld-IE1168–176 tetramers were obtained from the NIH Tetramer Core Facility (Emory University, Atlanta, GA). All analysis was performed using WINMDI 2.9 and Graphpad Prism 4 (San Diego, CA).
Intracellular cytokine stains
Ex-vivo stimulations were performed as previously described (35). For detection of cytokine production, cell isolates were resuspended in RPMI (10% FCS, 50 um 2-ME) then stimulated with 10 µm of IE1168–176 peptide (BioSynthesis, Lewisville, TX) or with PMA/Ionomycin (Sigma, St. Louis, MO) for 6 hours at 37°C with Brefeldin-A added in the last 4 hours of stimulation. Surface stainings were done as described above and intracellular staining was performed as per the manufacturer’s instructions (BD Bioscience, Mountainview, CA). For detection of degranulation by CD8+ T-cells, CD107a-PE mAb (eBioscience) was added to the cultured cells during peptide stimulation. Samples were analyzed by flow cytometry as described above.
BrdU incorporation
CD8 T cell proliferation in vivo was performed by detecting for BrdU (BD Bioscience) incorporation by flow cytometry. Mice were treated intraperitoneally with 0.2 mg BrdU for 6 hours before sacrifice. Staining and processing of samples for detection of BrdU incorporation were performed as previously described (36).
Immunohistochemistry
Immunohistochemical staining for MCMV immediate early (IE1) encoded protein, microglia/macrophages, CD8+ and CD4+ T-cells was performed using monoclonal antibodies Croma 101 (anti-EI1), anti-mouse Mac3 (BD Bioscience), YTS 169.4.2 (anti-CD8) and YTS 191.2.1 (anti-CD4), respectively. Both paraffin embedded and frozen sections were used for staining. Antibody binding was visualized using biotinylated goat anti-mouse IgG, mouse anti-rat IgG2a (BD Bioscience) and goat anti-rat IgG (Caltag, Carlsbad, CA) secondary antibodies then visualized by streptavidin peroxidase and AEC (Sigma) and counterstained with Shandon instant hematoxylin.
Adoptive transfers
Six-week old Balb/c mice infected as newborns with w.t. MCMV were used as donors and 6 week old age matched female Balb/c mice served as recipients. Recipient mice were subjected to total body γ-irradiation in a single dose of 6 Gy. 12 hours after irradiation mice were infected subcutaneously in the footpad with 105 PFU of w.t. MCMV (MW 97.01 strain). CNS mononuclear cells were isolated using previously described protocols (37). Isolated cells were resuspended in DMEM and 2×10⁵ cells were transferred intravenously into immunodepleted mice. Depletion of CD8+ T-cell subsets was performed by intra-peritoneal treatment of recipient mice with anti-CD8 mAb (clone YTS 169.4.2) on days 0 and 6, post-transfer. On day 9 post-transfer, recipient mice were sacrificed and virus titers quantitated as described above.
Antibody depletion of CD8+ cells
Control and MCMV infected animals were treated intraperitoneally with 50 µg anti-CD8 mAb (YTS.169.4.2) at PN day 5 and 8 then at PN day 11 with 100 µg of mAb. All animals used for flow cytometry and for quantitation of virus loads were sacrificed at PN day 13. Tissues were processed as described above.
RESULTS
MCMV infection of the CNS is associated with the recruitment of mononuclear cells into the brain
Following intraperitoneal inoculation of newborn mice with MCMV, infectious virus was initially detected in the liver and spleen and then in the CNS (Fig 1A). Infectious virus was first detected in the liver on PN day 3 and titers plateaued between PN day 10 and PN day 14 (Fig 1A). Infectious virus was first detected in the brain by PN day 7 and the titers of infectious virus peaked in the brain between PN days 11–14 (Fig 1A). Virus replication reached similar levels in the brain as was observed in the liver with peak titers ranging between 4–5 log10 of virus per gram of tissue (Fig 1A). The infection in the CNS was characterized by scattered foci of infiltrating mononuclear cells resulting in lesions that appeared nearly indistinguishable from histopathological findings in infants with congenital HCMV infections and adults with HCMV encephalitis (30) (Fig 1B–D). Virus infected cells could be detected in parenchyma of the brain (Fig 1E–F) and in the liver (Fig 1G) by immunohistochemistry (IHC) utilizing a monoclonal antibody (mAb) reactive with the major immediate early protein (IE-1, pp89) of MCMV. Sections from the brain and liver of control animals displayed no evidence of mAb reactivity (data not shown).
Figure 1. MCMV disseminates to the CNS following peripheral inoculation of neonatal mice.

(A) Newborn mice (6–18 hours post partum) were inoculated i.p. with 200 PFU of tissue culture derived MCMV-Smith strain. A standard plaque assay was used to determine virus titers in the spleen (left), liver (center) and brain (right). (B–D) Photomicrographs of paraffin sections from MCMV infected animals stained with cresyl violet. Inflammatory foci (arrows) are detected in the hippocampus at PN day 14 (B, ×10), cerebral cortex at PN day 18 (C, ×20) and in the CNS parenchyma at PN day 14 (C, ×40). (E–G) Paraffin sections from MCMV infected pups were processed and stained with anti-MCMV IE1/pp89 mAb and counterstained with hematoxylin. Virus infected cells (arrowheads) are identified in the cerebellum (PN day 9, E, 40×), cerebrum (PN day 8, F, 40×) and liver (PN day 14, G, 40×).
MCMV infection of the newborn brain resulted in the recruitment of mononuclear cells to sites of virus infection in the CNS (Fig 1B–D). Mononuclear cell infiltrates were detected as early as PN day 8 and by PN day 12, a subset of mononuclear cells in the brain expressed the Mac-3 antigen and exhibited phenotypic characteristics of activated brain macrophages and/or microglia (Fig 2A). Immunohistochemical staining of sections prepared from PN day 17 MCMV infected mouse brain also revealed a significant T lymphocyte infiltration, with a preponderance of CD8+ cells in the brains of infected animals (Fig 2B–C). Sections from control animals had no detectable CD4 or CD8 positive cells in the brain (data not shown). Mononuclear cells in the brains of infected and control mice were further characterized by flow cytometry. Resident microglia and infiltrating brain macrophages could be identified in the brains of PN day 14 mice by the expression of F4/80 and CD45. A significant number of F4/80posCD45hi cells were found in the brains of infected animals but not in control animals (Fig 2D). These cells likely represented mononuclear cells of myeloid lineage recruited from the peripheral blood (38). A second population of activated mononuclear cells with a phenotype of activated microglia cells (F4/80pos, CD45int) were increased in frequency in infected mice as compared to control animals (Fig 2D). Quiescent microglia (F4/80posCD45lo) were found in the brains of both control and infected animals (Fig 2D). Although the frequency of activated, F4/80posCD45int microglia decreased late in infection (PN day 22), a significant number of F4/80posCD45hi macrophages were present in the later phase of the infection (Fig 2D, bottom plot).
Figure 2. CD8+ T-cells are the predominant mononuclear cellular infiltrate recruited to the CNS in MCMV infected newborn mice.

(A–C) Photomicrographs of MCMV infected brain stained with antibodies against common mononuclear cell markers. Mac-3+ mononuclear cells were detected in the cerebrum at (PN day 12, A, 40×). CD4 (B, 20×) and CD8 (C, 40×) positive cells were present in the cerebellum at PN day 17. (D,E) Representative flow cytometry contour plots of control and MCMV infected brain and liver mononuclear cells isolated as described in the Materials and Methods section. (D) To identify brain macrophage/microglia populations mononuclear cell isolates were stained with F4/80-APC and CD45-PE monoclonal antibodies. Flow cytometry plots shown were representative of two separate experiments with 3–4 animals per group. (E) The frequency of αβ T-lymphocyte subsets was determined by staining with CD4-FITC and CD8-APC antibodies. Percentages shown are based on total number of gated events. (F) Bar graphs representing the summary of CD8 and CD4 T-cell frequencies in the brain (white bars) and liver (black bars) following MCMV infection. Values denote mean frequencies (± SEM, n = 3–5) from two independent experiments. All flow cytometry plots (D, E) were gated on the total mononuclear cell population.
To define the kinetics of T-cell infiltration into the CNS, brain mononuclear cells were isolated from control and MCMV infected brains on PN days 10–22 and stained with antibodies reactive with T-lymphocyte subset markers, CD4 and CD8. In agreement with the findings from IHC studies, both CD4 and CD8 T-lymphocytes could not be detected in the brains of control animals (Fig 2E). However, by PN day 12 CD8+ and CD4+ T-lymphocytes were identified in the CNS of MCMV infected animals (Fig 2F). The frequency of CD8+ T-cells in the CNS peaked at PN day 18 (42±2%), whereas CD4+ T-cell frequency in the CNS remained relatively constant at all time points investigated (Fig 2E, F). We also analyzed T lymphocytes in the liver of MCMV infected mice and could also demonstrate a rapid increase in CD8+ T-lymphocyte frequency in this organ (Fig 2E, F). In contrast to findings in the CNS, CD4+ T-lymphocyte frequency in the liver also increased over time and reached nearly 50% of the frequency of CD8+ T lymphocytes (Fig 2F). A gradual decline in CD8+ T-lymphocyte frequency from both liver and CNS isolates was observed late in infection (Fig 2F).
CD8+ T lymphocytes contribute to the control of virus replication in the CNS of young mice infected with MCMV
MCMV specific CD8+ T-lymphocytes have been shown to be required for MCMV clearance from infected adult animals (22, 26). The dominance of CD8+ T-cells in the CNS of MCMV infected newborn mice suggested that these cells also played an important role in virus clearance from this organ. Plotting the CD8+ T-cell frequency versus virus infectivity as a function of days post-infection revealed an abrupt decline in infectious virus congruent with the increasing frequency of CD8+ T-lymphocytes in the CNS, whereas no such correlation is observed between CD4+ T-cells and infectious virus titer (Fig 3). In the liver, increasing frequencies of both CD4+ and CD8+ subsets were observed along with a rapid drop in virus titer (Fig 3). These results suggested that the control of virus replication in the developing brain was in part mediated by CNS CD8+ T-lymphocytes.
Figure 3. Control of virus replication in the CNS correlates with CD8+ T-cell infiltration.
Line graphs indicating the kinetics of infectious virus clearance (virus titer, right y-axis) plotted with mean T-cell frequencies for each subset (left y-axis) as a function of days post-infection. Brain (top) and Liver (bottom) values are mean frequencies for each T-cell subset and mean virus titers at each indicated time point (± SEM, n = 3–5, ND = not determined).
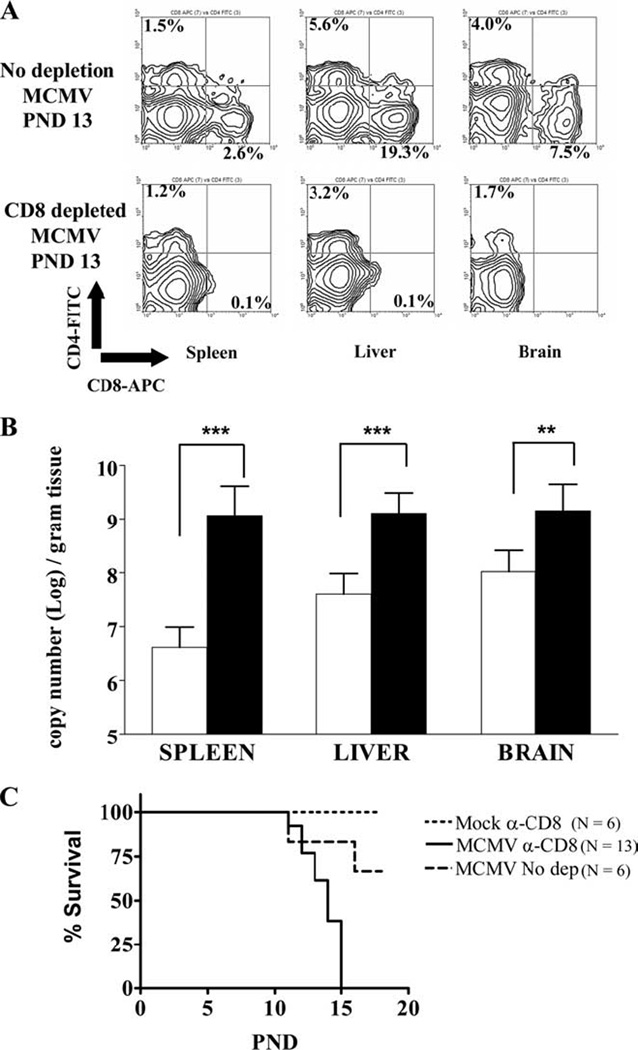
The functional immaturity of neonatal T-lymphocytes raised the possibility that CD8+ T-cell infiltrates of MCMV infected neonatal mice played a negligible role in the control of virus replication. To address this question, CD8+ T-lymphocytes were depleted in-vivo by administration of an anti-CD8 monoclonal antibody (clone YTS.169.4.2) to control and MCMV infected animals on PN days 5, 8 and 11. Treatment with this antibody resulted in a significant reduction (2.7% to <0.1%) in the splenic CD8+ T-lymphocyte frequency of control animals at PN day 13 (data not shown). Anti-CD8 mAb treatment of virus infected animals resulted in a decreased CD8+ T-lymphocyte frequency in the spleen, liver, and CNS at 8 days post-treatment (PN day 13) by nearly 100% (Fig 4A). Depletion of CD8+ T-cells did not result in a significant alteration in the CD4+ T-cell frequencies in the CNS (Fig 4A). The genome copy number of viral DNA in the spleen, liver, and CNS of CD8+ T lymphocyte depleted animals increased significantly compared to untreated littermates suggesting that CD8+ T-cells were key components of the host control of MCMV replication in the newborn brain (Fig 4B). Furthermore, anti-CD8 treatment of MCMV infected pups was associated with 100% mortality by postnatal day 15 as compared to approximately 30% mortality in MCMV infected and untreated animals at this time point (Fig 4C). These studies demonstrated that CD8+ T lymphocytes played a significant role in the clearance and control of MCMV infection in newborn animals, including in the CNS.
Figure 4. Depletion of CD8+ T-cell population results in increased viral burden in the CNS.

(A) Representative flow cytometry contour plots of CD4 and CD8 stained brain, liver and spleen cells from MCMV infected, untreated animals (top panel) and from MCMV infected, CD8 depleted animals (bottom panel). Cells isolated from PN day 13 animals as described in the Materials and Method section and stained with CD4-FITC and CD8-APC antibodies. Percentages shown are based on total number of gated mononuclear cells. (B) Taqman real time PCR was used to quantify viral genome copy number in untreated (open bars) and CD8 depleted (closed bars) animals on PN day 13 as described in Materials and Methods. Bar graphs indicate mean values (± SD, n = 4–7). **, p=0.0036 and ***, p<0.0001 for the compared values by Students T-test. (C) Survival curves for CD8 depleted-uninfected control animals (n=6), untreated-infected animals (n=6), and CD8 depleted-infected animals (n=13). Groups were analyzed statistically by log-rank test and significant differences were noted between CD8 depleted infected and untreated-infected groups (p=0.0041).
Phenotypic analysis of CD8+ T-lymphocytes infiltrating the CNS
The surface phenotype of CNS and liver CD8+ T-cell infiltrates from MCMV infected newborn animals were characterized. CD8+ T-lymphocytes infiltrating the CNS on PN day 14 expressed high levels of CD44, and CD69, with 97.1% of CD8+ T lymphocytes expressing both antigens (Fig 5A). Late in infection and after virus clearance from the CNS (PN day 28), brain CD8+ T-lymphocytes maintained high levels of expression of CD44 and CD69 (Fig. 5A). CD8+ T lymphocytes isolated from the liver at PN day 14 were also CD44posCD69pos (76.0%) with a small fraction (19.0%) lacking CD69 expression (Fig 5A). Late in infection, liver CD8+ T-lymphocytes displayed a modest increase in the CD44posCD69neg population to 29.0% (Fig 5A).
Figure 5. Responding CD8+ T-cells and Macrophages in the CNS display an activated phenotype.

(A) Activation profiles of CD8+ T-cells. Brain and liver mononuclear cells from PN day 14 and 28 MCMV infected animals were processed and stained with activation markers, CD44-FITC, CD69-PE, CD62L-FITC, CD49d-PE and CD8-APC. Top panel contour plots are stained with CD44 and CD69. Bottom panel contour plots were stained with CD62L and CD49d. Both top and bottom panels were gated on CD8+ cells. Percentages shown are based on total CD8+ cells (n = 3–4). (B) Activation profiles of macrophage/microglia sub-population in the CNS. Brain mononuclear cells from PN day 14 MCMV infected animals were stained with the macrophage/microglia marker F4/80-APC and CD45-FITC and the activation markers CD80-PE and CD40-PE. F4/80 positive populations were further sub-divided into three distinct groups (left, density plot), CD45hi (infiltrating brain macrophages, top histograms), CD45int (activated microglia, middle histograms) and CD45lo (quiescent microglia, bottom histograms) stained with CD40 (left panel) and CD80 (right panel). The percentages of each macrophage/microglia subpopulation that express CD40 and the percentages of CD80lo and CD80hi positive cells for each subpopulation are shown (n = 4) and are representative of two separate experiments.
CD49d (α4 integrin) and CD62L (L-selectin) expression was also determined. CD49d is upregulated on activated lymphocytes and has been shown to be critical for T-lymphocyte infiltration into the CNS in mice with inflammatory CNS disease while CD62L is downregulated following extravasation of lymphocytes into infected organs. On PN day 14, CNS CD8+ T-lymphocytes were almost exclusively CD49dposCD62Lneg (84.2%) with a small fraction being positive for both cell surface markers (12.6%), (Fig 5A). On PN day 28, most CNS CD8+ T-lymphocytes were CD49dposCD62Lneg (93.0%). The upregulation of CD44, CD69 and CD49d and the loss of CD62L surface expression on CNS CD8+ T-lymphocytes early in infection indicated that these cells exhibited an activated effector phenotype and suggested that these cells were primarily effector T-lymphocytes throughout PN days 14–28, an interval when virus replication was controlled and reduced to undetectable levels in the CNS (Fig 1A).
We also analyzed the phenotype of mononuclear phagocytes in the CNS. These cells mediate T-cell responses by providing co-stimulatory signals necessary for T-cell effector function. Microglia and infiltrating brain macrophages displayed an activated phenotype as shown by the upregulation of the activation markers CD40 and CD80 (Fig 5B). A higher frequency of F4/80posCD45hi cells (brain macrophages) expressed CD80 (68.1%) than did F4/80posCD45int cells (activated microglia, 48.6%) (Fig 5B). However, virtually no difference in CD40 expression was observed between both populations. Quiescent microglia displayed very low levels of expression of both activation antigens.
CD8+ T-lymphocytes isolated from the brains of MCMV infected newborn animals are specific against viral antigen IE-1
We next examined the specificity of CD8+ T-lymphocytic infiltrates in the CNS. The IE1 exon4168–176 (IE1168) epitope has been shown to be an immunodominant epitope recognized by CD8+ T-lymphocytes from H-2d mice and CD8+ T-lymphocytes reactive with this epitope are protective in virus challenge studies (39, 40). Using H-2Ld tetramers generated with the IE1168 peptide, we analyzed the frequency of IE1 specific CD8+ T-lymphocytes in the CNS and liver (Fig 6A). At the peak of virus replication (PN day 14), IE1168 specific CD8+ T-lymphocyte frequency in the CNS was 8.0% and increased to 10% and 11.5% on PN days 18 and 22, respectively (Fig 6B). By PN day 28, the frequency of IE1168 specific CD8+ T-lymphocyte in the CNS had decreased to 7% (Fig 6B). The frequency of IE1168 specific CD8+ T-lymphocyte in the liver remained constant from PN day 14 to 22 but by 28 dpi a similar reduction in the frequency of IE1168 specific CD8+ T-lymphocyte was noted in the liver (Fig 6B). CD8+ T-lymphocytes specific for two other previously described CD8+ T-lymphocyte epitopes present in MCMV, m164 and m04, were also detected in the CNS at PN day 14, albeit at much lower frequencies, 2.5% and 2.2%, respectively (41, 42) (data not shown).
Figure 6. IE1168 specific CD8+ T-cells accumulated in both the CNS and liver in MCMV infected animals.

(A) Representative flow cytometry contour plots of brain and liver mononuclear cells from MCMV infected animals, PN days 14–28, stained with IE1168 TET-APC and CD8-PE. Percentages shown are based on total gated cells. (B) Enumeration of IE1168posCD8pos T-cells in the brain (white bar) and liver (black bar). Values represent mean frequencies based on the total CD8+ T-cell population (± SD, n = 4–7) and are representative of two independent experiments. **, p=0.0056.
Ex-vivo stimulation of CNS CD8+ T-cells results in increased IFN-γ production
Cytokine production by virus specific T-lymphocytes can mirror the capacity of these effector cells to effectively control virus infection (43). We determined the capacity of infiltrating CD8+ T-lymphocytes isolated from the CNS and liver of neonatal MCMV infected mice to produce IFN-γ following ex-vivo peptide stimulation. Stimulation with IE1168 peptide resulted in the increased expression of IFN-γ by both liver and brain CD8+ T-lymphocytes at each time point (Fig 7 A,B). The frequency of peptide stimulated IFN-γposCD8+ T-lymphocytes was highest early in infection with a gradual decline in IFN-γposCD8+ T-lymphocyte frequency as virus infection was cleared from both brain and liver (Fig 7B). Following non-specific chemical stimulation with PMA/Ionomycin, IFN-γposCD8+ T-lymphocyte frequency in the CNS remained relatively high (> 50%) while there was a decline in IFN-γposCD8+ T-lymphocyte frequency after PMA/Ionomycin stimulation in liver CD8+ T-cells (Fig 7C). The maintenance of cell surface activation markers on brain CD8+ T-lymphocytes (Fig 5A) and the continued capacity for IFN-γ production late in infection suggested that CNS CD8+ T-lymphocytes present in the CNS of MCMV infected mice maintained an activated effector/effector-memory phenotype even following virus clearance as measured by PCR detection of viral nucleic acid.
Figure 7. Ex-vivo stimulation with IE1168 peptide results in IFN-γ production by brain and liver CD8+ T-cells.

(A) Flow cytometry density plots of brain and liver mononuclear cells from PN day 18, MCMV infected animals stained with IFN-γ-FITC and CD8-APC following stimulation with IE1168 or with PMA/Ionomycin for 6 hours and incubation with Brefeldin A during the last 4 hours. Frequency distribution expressed as percentage of CD8+ T-lymphocytes and calculated from total population of gated mononuclear cells that were CD8+. (B) Bar graph depicting the summary of IE1168 peptide ex-vivo stimulation analysis on mononuclear cells from MCMV infected animals at PN days 14, 18, 22 and 28. Indicated are brain (white bar), liver (hatched bar) no stimulation controls and brain (black bar) and liver (gray bar) peptide stimulated samples. Percentages based on total CD8+ T-cells (n = 4–5). (C) Bar graph depicting the summary of PMA/Ionomycin stimulation analysis on similar parameters as described in panel B. Indicated are samples from the brain (black bar) and liver (gray bar) (n = 4–5). (D) Comparative analysis bar graphs on the frequency of IFN-γposCD8pos T-cells following IE1168 peptide stimulation (white bar) versus the frequency of IE1168posCD8pos T-cells (black bar) as a function of day 14, 18, and 22 post-infection from MCMV infected animals (± SD, n = 4–7). Data shown are representative of 2 independent experiments the values analyzed by Mann-Whitney test for non-parametric distribution. Statistical differences were noted only for frequencies of IFN-γposCD8pos T-cells and IFN-γposCD8pos T-cells isolated from the brain on day 22 (*, p=0.0159). ns = not significant.
There was a steady rise in IE1 specific CD8+ T-lymphocyte frequency in the CNS prior to T-cell contraction in contrast to the IE1 specific CD8+ T-lymphocytes in the liver (Fig 6). In addition, there was also a gradual loss in frequency of CD8+ T-lymphocytes that produced IFN-γ following peptide stimulation of both brain and liver derived CD8+ T-lymphocytes. The frequency of IFN-γpos and IE1168pos CD8+T-lymphocytes from both brain and liver infiltrates were compared between PN day 14–22. There was no statistically significant difference in the frequency of IFN-γpos and IE1168pos CD8+T-lymphocytes in the brain and liver on PN d14 and d18 (Fig 7D). However, on PN day 22 there was a significant difference (p = 0.0159) between the frequency of IFN-γpos (5.1±0.38%) and IE1168pos (10.9±0.7%) CD8+ T-lymphocyte in the CNS, while no difference was observed in the frequency of IFN-γpos and IE1168pos CD8+T-lymphocytes (2.5±0.66% and 5.85±1.4% (p=0.144) respectively) in the liver at this time point (Fig 7D). Although this difference in the frequency of IFN-γpos and IE1168pos CD8+ T lymphocytes in the CNS was small and potentially could be explained by variation between animals in these two groups, this result did raise the possibility that the CNS microenvironment contributed to an altered function of activated CD8+ T-lymphocytes after control of virus infection.
Early CD8+ effector T-cells from brain and liver exhibit functionally heterogeneous phenotypes
Although we have demonstrated recruitment of activated virus specific CD8+ T-lymphocytes to the CNS, given the unique microenvironment of the brain, CD8+ T-cell mediated MCMV clearance mechanisms in the brain could differ from that of peripheral organs. Moreover, the observed differences in IFN-γ production and activation profiles between brain and liver CD8+ T-cells prompted us to examine potential disparities in the function of brain and liver CD8+ lymphocyte populations during the early phase of the T-lymphocyte response (PN day 13–14). Mononuclear cellular isolates from PN day 14 animals were stimulated with IE1168 peptide or with PMA/Ionomycin then stained with IFN-γ, TNF-α and IL-2. The majority of brain CD8+ T-cells simultaneously expressed IFN-γ and TNF-α, following either peptide or PMA/Ionomycin stimulation. The ratio between IFN-γ and TNF-α double positive cells and IFN-γ single positive cells following stimulation with IE1168 peptide or PMA/Ionomycin was 2 and 4, respectively (Fig 8A). Liver CD8+ T-cells had a strikingly different phenotype as compared to brain CD8+ T-cells following peptide or PMA/Ionomycin stimulation, with the cytokine production ratio measuring <1 (Fig 8A).
Figure 8. Key differences in functional signatures between liver and brain CD8+ T-cells are observed early in infection.

(A) PN day 14 mononuclear cells from the brain and liver of MCMV infected animals were ex-vivo stimulated with IE1168 peptide or with PMA/Ionomycin for 6 hours then stained with IFN-γ-FITC, TNF-α-PE, IL-2-PE and CD8-APC. Density plots are based on gated CD8+ T-cells populations. Percentages shown are means (n = 4) of two separate experiments. (B) Animals were treated with BrdU 6 hours prior to sacrifice at PN day 13. Representative flow cytometry plots of brain and liver mononuclear cells from BrdU treated animals show CD8-PE and BrdU-FITC staining (top panel). Percentages are based on total gated cells. The bar graph (middle panel) represents mean frequencies of total CD8+ T-cell populations from brain and liver (± SD, n = 4). Flow cytometry plots (middle panel) show IE1168 tetramer-APC and BrdU-FITC staining. Percentages calculated from total gated CD8+ T-cells. The bar graph (bottom panel) represents mean frequencies of total IE1168+CD8+ T-cell population (± SD, n = 4) of two separate experiments. (C) PN day 14 brain and liver mononuclear cells were ex-vivo stimulated with IE1168 peptide for 6 hours during which CD107a-PE antibodies were incubated with the cells. Representative flow plots from liver and brain isolates were gated on CD8+ cells and stained with IFN-γ-FITC. Percentages calculated from total CD8+ T-cell population. Bar graphs are summaries of the previous experiments. Values indicate mean frequencies from total CD8+ T-cell population (± SD, n = 4).
IL-2 production was detected in brain and liver CD8+ T-cells at relatively similar frequencies following PMA/Ionomycin stimulation but not after IE1168 peptide stimulation (Fig 8A). The lack of IL-2 production following antigen specific stimulation suggested that both CD8+ T-cell populations lacked intrinsic proliferation capacity and were likely dependent upon exogenous sources for IL-2. A subpopulation of IL-2 single positive CD8+ T-cells from liver (2.9%) but not brain (0.6%) was also detected without ex-vivo stimulation (Fig 8A), suggesting that a subset of liver but not brain CD8+ T-cells could potentially serve as the IL-2 source for other CD8+ T-cells.
To test for differences in antigen driven proliferation between brain and liver CD8+ T-cells, PN day 13 MCMV infected pups were pulsed with BrdU for 6 hours. A higher fraction of liver CD8+ T-cells incorporated BrdU (> 50%) compared to brain CD8+ T-cells (30%), suggesting that a greater proportion of CD8+ T-cells were proliferating in the liver (Fig 8B). By staining with IE1168 tetramer and for BrdU incorporation, we also observed a higher fraction of BrdU+IE1168+ T-cells in the liver (82%) than the CNS (30%, Fig 8B). This difference in in-vivo antigen driven proliferation between brain and liver IE1 specific T-cells raised the possibility that intrinsic differences between brain and liver CD8+ T-cells limited the capacity of the former to proliferate in response to antigen. Alternatively, this difference could be secondary to expression of extrinsic factors in the CNS microenvironment that modulated antigen induced proliferation. However, these differences in proliferative capacity were likely transient during the acute phase of MCMV infection since adoptive transfer of PND 42 brain CD8+ T-cells into immunodepleted, MCMV infected adult mice was protective and resulted in reduced virus replication suggesting that brain CD8+ T-cells were able to proliferate in response to “secondary” virus challenge (Fig 9).
Figure 9. Protective capacity of CNS-derived CD8+ T-cells after transfer into immunodepleted recipients.

6 week old MCMV infected, lethally irradiated animals received 2×10⁵ mononuclear cells isolated from either brain or spleen of age-matched Balb/c mice, neonatally infected with MCMV. Nine days after transfer mice were sacrificed and virus titers measured in spleen, lungs and liver. Depletion of CD8+ subset is described in the Materials and Method section. Each point represents the virus titer for an individual animal and horizontal bar is the median of each group. LD=limit of detection.
Degranulation of brain and liver CD8+ T-lymphocytes following IE1168 peptide stimulation
To further characterize the functionality of early effector CD8+ T-cells in brain and liver, we estimated the cytotoxic potential of CNS and liver CD8+ T-cells by staining mononuclear cell isolates from PN day 14 animals with CD107a (LAMP-1) during ex-vivo IE1 peptide stimulation (44). CD8+ T-cells double positive for CD107a and IFN-γ were observed from both peptide stimulated CNS (1.4%) and liver (3.1%) mononuclear cells (Fig 8C). Due to the absence of double positive populations in non-stimulated animals, the detection of IFN-γposCD107apos cells in both brain and liver CD8+ T-cells suggested that degranulation of these cells occurred after interaction with the MHC/peptide complex. An equivalent fraction of liver CD8+ T-cells were shown to only secrete IFN-γ (3.4%) however this population was increased 2-fold in brain CD8+ T-cells (2.8%, Fig 8C), suggesting that a considerable fraction of both neonatal liver and brain CD8+ T-cells were deficient in degranulation and potentially lacked the capacity to mediate cytolysis of target cells (45). Interestingly, a sizeable fraction of CD8+ T-cells in the CNS were IFN-γnegCD107apos without ex-vivo stimulation (3.6%, Fig 8C). There was no change in the frequency of this population following peptide stimulation (4.1%). Whether degranulation was taking place against viral antigens processed by infected APCs requires further investigation. Overall, these results indicated that CD8+ T-cells recruited to the CNS and to the liver had functionally distinct properties, perhaps secondary to unique signals that T-cells receive following extravasation into these specific organs.
CD8+ T-lymphocytes isolated from the brain of MCMV infected mice have in-vivo antiviral activity
The antiviral effector capacity of CD8+ T-lymphocytes isolated from the brains of MCMV infected mice was determined by assaying the antiviral activity of CNS CD8+ T-lymphocytes from infected animals by adoptive transfer into syngeneic MCMV infected, γ-irradiated animals, a model that has been used extensively to assay the in vivo functionality of MCMV specific CD8+ T-lymphocytes (46). Adoptive transfer of immune splenocytes from age matched adult animals which were infected as neonates reduced virus titer in the spleen by greater than 3 log10 and in the lungs and liver by 1 and 3 log10, respectively (Fig 9). Similarly, adoptive transfer of CNS mononuclear cells from neonatally infected, age matched animals reduced virus titer in the spleen by 2 log10 and in the lungs and liver by 1 log10 (Fig 9). Depletion of CD8+ T lymphocytes by anti-CD8 mAb treatment of γ-irradiated recipients eliminated control of virus replication by donor CNS mononuclear cells and resulted in virus titers equivalent to control animals that did not receive adoptively transferred cells (Fig 9). An increase in the titer of infectious virus was observed in all organs when CD8+ cells were depleted following transfer of immune splenocytes; however, it appeared that immune effector mechanisms other than CD8+ T-lymphocytes could also limit MCMV growth to a lesser extent. These findings suggested that CD8+ T lymphocytes recruited into CNS following neonatal infection were functional and could limit virus replication in vivo.
DISCUSSION
This study has demonstrated an important role for CD8+ T-lymphocytes in the clearance of MCMV from the CNS of newborn mice. In addition, we have also shown that CD8+ T-lymphocytes are essential for resistance to lethal MCMV infection in the newborn animal. Following virus spread to the newborn brain, activated virus specific CD8+ T-lymphocytes were recruited into the CNS and emerged as an abundant mononuclear cell population in the brains of MCMV infected animals. CD4+ T-lymphocytes and infiltrating brain macrophages were also recruited to the CNS, but remained at a significantly lower frequency than CD8+ T-lymphocytes. Although several components of the mononuclear cell infiltrate in the CNS of infected mice could also mediate virus clearance in the brain, we focused on the role of CD8+ T-lymphocytes because of {1} the correlation between the kinetics of CD8+ T-cell recruitment and virus clearance in the CNS, {2} the dominance of CD8+ T-cells in the mononuclear cell fraction of the CNS, and {3} the established role of CD8+ T-cells in controlling MCMV infection in adult animals (22, 26). Immune depletion of CD8+ cells in infected mice with anti-CD8 antibodies resulted in increased amounts of virus in the CNS and in the liver and spleen and 100% lethality in infected CD8+ T lymphocyte depleted animals, demonstrating the importance of this population of cells in the response of the neonatal host to MCMV infection. It was also of interest to note that depletion of CD8+ T-cells resulted in 100% mortality in virus infected neonates whereas CD8+ T-cell depletion of virus infected immune competent adult Balb/c mice or infection of β2-microglobulin knockouts resulted in only minor delays in virus clearance with no effects on mortality (47). The redundancy of immune effector cell functions could have restricted increased virus replication in CD8 depleted adult mice but the quantitative and qualitative immaturity of the neonatal immune system potentially restricted the cooperative effector response that is characteristic of adult mice (19, 48). Alternatively, major differences in the pathogenesis of MCMV infection between immune competent adult and neonatal infections include the spread of the virus to the CNS in infected pups. Whether uncontrolled virus replication in the CNS represents a critical determinant in lethality in CD8+ T-cell depleted newborn mice or uncontrolled virus replication results in organ failure in the liver, lungs, or other target organs of MCMV replication remains to be determined.
CD8+ T-cells control virus infection by cytolytic (perforin, granzyme, Fas-ligand mediated) and non-cytolytic means (cytokine mediated). Recent studies of fetuses infected with HCMV revealed MHC-I restricted T-cells with cytolytic activity against peptide pulsed target cells and production of IFN-γ, TNF-α and MIP-1α following ex-vivo antigen stimulation suggesting a role for both pathways in CD8+ T-cell response to CMV infection (18). In mice, the effector mechanisms necessary for CD8+ T-cell control of MCMV infection remain unresolved. IFN-γ and TNF-α have been shown to act synergistically in controlling MCMV replication (49). Both cytokines however are produced by multiple cell types, including NK cells, which have also been reported to mediate virus clearance, suggesting that IFN-γ and TNF-α could represent effector molecules in both innate and adaptive responses to MCMV. Additionally, in-vivo cytotoxicity assays have revealed cytolytic activity of IE1 specific T-lymphocytes during acute infection of adult animals but mice with genetic deletions for cytolysis effector molecules such as Perforin, Granzyme A and Fas-L exhibited defects in cytotoxic T-lymphocyte mediated control of virus infection only in the salivary glands (50–52). Together, these data suggest that the cytolytic function of CD8+ T-cells could be specific for virus clearance only in some organs but not others.
CD8+ T-cells from the CNS of neonatally infected animals produced both IFN-γ and TNF-α but not IL-2 following ex-vivo peptide stimulation. The potential for CD8+ T-cells to simultaneously produce TNF-α and IFN-γ has been observed in acute MCMV infected adult mice and in healthy HCMV infected individuals (50, 53, 54). Double producers of TNF-α and IFN-γ synthesize more cytokines than single positive cells thereby potentially functioning more efficiently in virus clearance (55). Moreover, cytokine dependent virus clearance mechanisms are thought to be critical for control of virus infection in post-mitotic, non-generating cell populations such as neurons (56). In animals infected with measles virus or Sindbis virus, control of virus replication in infected neurons is mediated by IFN-γ via non-cytolytic mechanisms (57, 58). In addition, although we observed degranulation of cytolytic granules in CNS infiltrating CD8+ T-cells, there was no observable difference in the frequency of apoptotic cells in the virus infected brain compared to control animals (data not shown). Consistent with these findings, CNS CD8+ T-cells displayed 2-fold higher frequencies of IFN-γposCD107aneg cells. Given the importance of both cytokines in host response to MCMV infection, the increased proportion of TNF-α and IFN-γ double positive CD8+ T-cells and the higher frequency of IE1168 peptide specific IFN-γposCD107aneg T-cells in the CNS, suggested a major role of non-cytolytic virus clearance mechanisms in the control of MCMV infection in the CNS. Nevertheless, an active role of CD8+ CTL mediated cytotoxicity in the brain has been observed in mouse models of CNS virus infections. For example, clearance of West Nile virus from infected neurons is dependent on perforin (59). Indeed, CD107a single positive cells were observed in CNS CD8+ T-cell infiltrates and to a lesser extent in liver infiltrates. Since multiple cell types (microglia, neurons, astrocytes and neural stem cells), are readily infected by MCMV, it is possible that each cell type requires a specific CD8+ T-cell effector mechanisms to mediate control of virus replication. Thus, CD8+ T-cell mediated clearance of MCMV from the CNS could depend on multiple effector functions.
A focused CD8+ T-cell response in the brain was observed in MCMV infected newborn mice. Approximately 10% of CD8+ T-lymphocytes in the CNS were specific against a single epitope, IE1168. Cytotoxic T-lymphocyte specificity against the IE1168 epitope has been extensively studied in H-2D mice and immune dominance demonstrated in MCMV infected adult mice (39, 40). Whether, IE1 specific CTLs are truly immune dominant in the CNS remains to be shown. Recent studies using H-2b mice demonstrated that splenic CD8+ T-lymphocytes respond to 27 unique viral genes indicating that the repertoire of CD8+ T-lymphocytes reactivity to MCMV is extensive (60). Thus, effector T-cells against other viral epitopes could account for the remaining CD8+ T-cells in the CNS, although, recruitment of bystander (CNS antigen specific) T-cells was also a possibility (61). Using tetramer staining, we have also detected CD8+ T-cells in the CNS specific against MCMV m164 and M04. Both epitopes have been shown to mediate virus clearance in MCMV infected mice (41, 42).
Infiltrating CNS T-cells exhibited decreased proliferation compared to liver CD8+ T-cells early in infection as shown by the lower fraction of IE1168 specific CD8+ T-cells in the CNS that incorporated BrdU. In addition, we observed that there was a significant difference in the frequency of IE1168 tetramer positive CD8+ T-lymphocytes in the CNS as compared to the frequency of CD8+ T-lymphocytes that produced IFN-γ following ex-vivo stimulation with peptide. Such a deficit was not observed in IE1168 specific T-cells isolated from the liver. Admittedly this result was based on a small number of animals and variations between animals in each group could also explain these differences in the frequency of tetramer and IFN-γ CD8+ T-cells. However, these differences in antigen specific response between brain and liver CTLs could also be the result of the proposed, inherently immune-inhibitory microenvironment of the CNS or possibly secondary to a specific phenotype of CD8+ T-lymphocytes that infiltrates the CNS (62). Additional experiments with larger groups of animals will be necessary to validate these findings and to explore potential mechanisms responsible for the observed phenotypes of CD8+-T lymphocytes in the brains of infected mice following clearance of infectious virus. In experimental autoimmune encephalomyelitis (EAE), a small animal model for multiple sclerosis, inhibition of T-cell activation and proliferation in the CNS can be mediated by inhibitory B7/CD28 family members such as CTLA-4 and PD-1 (63, 64) or by certain anti-inflammatory cytokines such as IL-10 and TGF-β (65, 66). Interestingly, TGF-β is constitutively expressed in the developing CNS (67) (data not shown) and has been shown to be upregulated by MCMV infected astrocytes (68). A putative role for these molecules in regulation of T-cell responses in the virus infected newborn brain could offer insight into potential mechanisms for limiting immune mediated pathology in the developing CNS.
Antibody staining of T-cells for the activation markers, CD44 and CD69, revealed that 97% of CD8+ T-cells in the CNS were CD44posCD69pos. A similar frequency of reactivity was also observed when CD8+ T-lymphocytes early in infection were stained with antibodies against CD49d and CD62L (CD49dposCD62Lneg, 84%). Several studies have indicated that activation is not an absolute requisite for T-cell infiltration into the CNS (69, 70). In our model, the preferential recruitment of activated CD8+ T-lymphocytes into the CNS of MCMV infected animals suggested that peripheral T-lymphocyte priming was an essential step for efficient CNS infiltration by effector T-lymphocytes, although we cannot exclude the possibility of T-lymphocyte priming in the CNS. Recent evidence from Toxoplasma gondii and TMEV infected mice suggested that T-lymphocyte infiltrate priming by parenchymal dendritic cells occurs in the CNS (71, 72). If T-cell priming occurred in MCMV infected brain, then a constant turnover of T-lymphocytes with a spectrum of naïve to activated phenotypes would likely be present. Thus, a higher fraction of T-cells in the CNS should display a naïve, CD44negCD69neg phenotype, a phenomenon that was not observed. Therefore, the priming of CNS T-cells during MCMV infection likely occurred in regional lymphoid tissues (73). In our model of MCMV encephalitis, multi-organ systemic infection is ongoing and immunogenic viral antigens are processed by tissue dendritic cells in most infected organs including the CNS, as illustrated by the presence of IE1168 specific CD8+ T-lymphocytes in both brain and liver of infected mice. This brings to question whether CNS T-cell priming during systemic virus infections occurs in the cervical lymph node or whether circulating virus specific T-cells primed in various secondary lymphoid tissues are recruited to the CNS.
An intriguing feature observed in our model was the nominal recruitment of CD4+ T-lymphocytes to the neonatal brain in MCMV infected mice. This was in contrast to the infected liver where CD4+ T-lymphocyte frequency increased as viral infection progressed. The peak CD4:CD8 ratio in the neonatal CNS was 0.11 (5%:42%) on PN day 18 whereas in the liver the ratio was 0.68 (22%:32%) on the same PN day. These data demonstrate the organ specific recruitment of CD4+ and CD8+ T-lymphocytes in these animals. This difference was also not dependent on the level of virus replication because similar amounts of virus per gram of organ were observed in both the liver and brain. Functional differences between the role of CD4+ and CD8+ T-lymphocytes in the control of virus replication have been well described in mice with MCMV infections. CD4+ T-lymphocytes are believed to play an essential role in the resolution of MCMV infection from salivary glands (74, 75). Immunodepletion of the CD4+ T-lymphocyte subset resulted in prolonged MCMV replication in the salivary glands of infected mice but there was no appreciable effect on MCMV clearance kinetics from the lungs and spleen in these animals (74). However, it is surprising that the ratio of CD4:CD8 T-lymphocytes in the submaxillary glands of MCMV infected adult mice was 0.22 (18%:81%), a ratio disproportionately skewed towards the CD8+ T-lymphocyte subset (76, 77). Therefore, even though there was no direct correlation between the magnitude of the CD4+ T-lymphocyte response and the infectious virus titer in MCMV infected newborn mice brain, the possibility that MCMV specific CD4+ T-lymphocytes also play a role in the resolution of virus infection in the brains of infected animals either by directly mediating non-cytolytic/cytolytic virus clearance of infected cells or indirectly via facilitating CD8+ T-cell recruitment, proliferation and maturation remains to be elucidated (78).
In summary, the findings presented here demonstrate a critical role of CD8+ T-cell mediated immunity in the control of MCMV infection of the developing CNS. CNS infiltrating CD8+ T-cells presented with a highly focused response. Adoptive transfer of these cells into immunedepleted hosts revealed in-vivo functionality of CD8+ T-cells and control of virus replication. Yet, it is important to realize that although our results define an important role of CD8+ T-cells in control of CNS MCMV infection they do not discount the contribution of other immune effector functions to MCMV clearance from the CNS, particularly in the very early phase of infection in the brain.
ACKNOWLEDGEMENTS
The authors would like to thank Zdenek Novak for assistance in flow cytometry and Allan Zajac for technical advice.
Abbreviations used in this article
- HCMV
human cytomegalovirus
- MCMV
murine cytomegalovirus
- PN
post-natal
- IE1
immediate early 1
Footnotes
This work was supported by NIH grant (HD 044721) to WJB.
REFERENCES
- 1.McCracken GH, Jr, Shinefield HM, Cobb K, Rausen AR, Dische R, Eichenwald HF. Congenital cytomegalic inclusion disease. A longitudinal study of 20 patients. Am J Dis Child. 1969;117:522–539. doi: 10.1001/archpedi.1969.02100030524005. [DOI] [PubMed] [Google Scholar]
- 2.Weller TH, Hanshaw JB. Virologic and clinical observations on cytomegalic inclusion disease. N Engl J Med. 1962;266:1233–1244. doi: 10.1056/NEJM196206142662401. [DOI] [PubMed] [Google Scholar]
- 3.Williamson WD, Desmond MM, LaFevers N, Taber LH, Catlin FI, Weaver TG. Symptomatic congenital cytomegalovirus. Disorders of language, learning, and hearing. Am J Dis Child. 1982;136:902–905. doi: 10.1001/archpedi.1982.03970460032007. [DOI] [PubMed] [Google Scholar]
- 4.Stagno S. Cytomegalovirus. In: Remington J, Klein JO, editors. Infectious Diseases of Fetus and Newborn. Philadelphia: W.B. Saunders Company; 2001. [Google Scholar]
- 5.Weller TH. The cytomegaloviruses: ubiquitous agents with protean clinical manifestations. I. N Engl J Med. 1971;285:203–214. doi: 10.1056/NEJM197107222850406. [DOI] [PubMed] [Google Scholar]
- 6.Kosugi I, Kawasaki H, Arai Y, Tsutsui Y. Innate immune responses to cytomegalovirus infection in the developing mouse brain and their evasion by virus-infected neurons. Am J Pathol. 2002;161:919–928. doi: 10.1016/S0002-9440(10)64252-6. [DOI] [PMC free article] [PubMed] [Google Scholar]
- 7.van Den Pol AN, Mocarski E, Saederup N, Vieira J, Meier TJ. Cytomegalovirus cell tropism, replication, and gene transfer in brain. J Neurosci. 1999;19:10948–10965. doi: 10.1523/JNEUROSCI.19-24-10948.1999. [DOI] [PMC free article] [PubMed] [Google Scholar]
- 8.Pass RF, Stagno S, Britt WJ, Alford CA. Specific cell-mediated immunity and the natural history of congenital infection with cytomegalovirus. J Infect Dis. 1983;148:953–961. doi: 10.1093/infdis/148.6.953. [DOI] [PubMed] [Google Scholar]
- 9.Chou S, Kim DY, Scott KM, Sewell DL. Immunoglobulin M to cytomegalovirus in primary and reactivation infections in renal transplant recipients. J Clin Microbiol. 1987;25:52–55. doi: 10.1128/jcm.25.1.52-55.1987. [DOI] [PMC free article] [PubMed] [Google Scholar]
- 10.Reusser P, Riddell SR, Meyers JD, Greenberg PD. Cytotoxic T-lymphocyte response to cytomegalovirus after human allogeneic bone marrow transplantation: pattern of recovery and correlation with cytomegalovirus infection and disease. Blood. 1991;78:1373–1380. [PubMed] [Google Scholar]
- 11.Li CR, Greenberg PD, Gilbert MJ, Goodrich JM, Riddell SR. Recovery of HLA-restricted cytomegalovirus (CMV)-specific T-cell responses after allogeneic bone marrow transplant: correlation with CMV disease and effect of ganciclovir prophylaxis. Blood. 1994;83:1971–1979. [PubMed] [Google Scholar]
- 12.Alberola J, Tamarit A, Cardenoso L, Estelles F, Igual R, Navarro D. Longitudinal analysis of human cytomegalovirus glycoprotein B (gB)-specific and neutralizing antibodies in AIDS patients either with or without cytomegalovirus end-organ disease. J Med Virol. 2001;64:35–41. doi: 10.1002/jmv.1014. [DOI] [PubMed] [Google Scholar]
- 13.Komanduri KV, Feinberg J, Hutchins RK, Frame RD, Schmidt DK, Viswanathan MN, Lalezari JP, McCune JM. Loss of cytomegalovirus-specific CD4+ T cell responses in human immunodeficiency virus type 1-infected patients with high CD4+ T cell counts and recurrent retinitis. J Infect Dis. 2001;183:1285–1289. doi: 10.1086/319683. [DOI] [PubMed] [Google Scholar]
- 14.Gibson L, Piccinini G, Lilleri D, Revello MG, Wang Z, Markel S, Diamond DJ, Luzuriaga K. Human cytomegalovirus proteins pp65 and immediate early protein 1 are common targets for CD8+ T cell responses in children with congenital or postnatal human cytomegalovirus infection. J Immunol. 2004;172:2256–2264. doi: 10.4049/jimmunol.172.4.2256. [DOI] [PubMed] [Google Scholar]
- 15.Tu W, Chen S, Sharp M, Dekker C, Manganello AM, Tongson EC, Maecker HT, Holmes TH, Wang Z, Kemble G, Adler S, Arvin A, Lewis DB. Persistent and selective deficiency of CD4+ T cell immunity to cytomegalovirus in immunocompetent young children. J Immunol. 2004;172:3260–3267. doi: 10.4049/jimmunol.172.5.3260. [DOI] [PubMed] [Google Scholar]
- 16.Gehrz RC, Marker SC, Balfour HH., Jr Specific cell-mediated immune defect in congenital cytomegalovirus infection. Lancet. 1977;1:811–812. doi: 10.1016/s0140-6736(77)93007-0. [DOI] [PubMed] [Google Scholar]
- 17.Chilmonczyk BA, Levin MJ, McDuffy R, Hayward AR. Characterization of the human newborn response to herpesvirus antigen. J Immunol. 1985;134:4184–4188. [PubMed] [Google Scholar]
- 18.Marchant A, Appay V, Van Der Sande M, Dulphy N, Liesnard C, Kidd M, Kaye S, Ojuola O, Gillespie GM, Vargas Cuero AL, Cerundolo V, Callan M, McAdam KP, Rowland-Jones SL, Donner C, McMichael AJ, Whittle H. Mature CD8(+) T lymphocyte response to viral infection during fetal life. J Clin Invest. 2003;111:1747–1755. doi: 10.1172/JCI17470. [DOI] [PMC free article] [PubMed] [Google Scholar]
- 19.Polic B, Hengel H, Krmpotic A, Trgovcich J, Pavic I, Luccaronin P, Jonjic S, Koszinowski UH. Hierarchical and redundant lymphocyte subset control precludes cytomegalovirus replication during latent infection. J Exp Med. 1998;188:1047–1054. doi: 10.1084/jem.188.6.1047. [DOI] [PMC free article] [PubMed] [Google Scholar]
- 20.Jonjic S, Pavic I, Polic B, Crnkovic I, Lucin P, Koszinowski UH. Antibodies are not essential for the resolution of primary cytomegalovirus infection but limit dissemination of recurrent virus. J Exp Med. 1994;179:1713–1717. doi: 10.1084/jem.179.5.1713. [DOI] [PMC free article] [PubMed] [Google Scholar]
- 21.Reddehase MJ, Weiland F, Munch K, Jonjic S, Luske A, Koszinowski UH. Interstitial murine cytomegalovirus pneumonia after irradiation: characterization of cells that limit viral replication during established infection of the lungs. J Virol. 1985;55:264–273. doi: 10.1128/jvi.55.2.264-273.1985. [DOI] [PMC free article] [PubMed] [Google Scholar]
- 22.Holtappels R, Pahl-Seibert MF, Thomas D, Reddehase MJ. Enrichment of immediate-early 1 (m123/pp89) peptide-specific CD8 T cells in a pulmonary CD62L(lo) memory-effector cell pool during latent murine cytomegalovirus infection of the lungs. J Virol. 2000;74:11495–11503. doi: 10.1128/jvi.74.24.11495-11503.2000. [DOI] [PMC free article] [PubMed] [Google Scholar]
- 23.Podlech J, Holtappels R, Pahl-Seibert MF, Steffens HP, Reddehase MJ. Murine model of interstitial cytomegalovirus pneumonia in syngeneic bone marrow transplantation: persistence of protective pulmonary CD8-T-cell infiltrates after clearance of acute infection. J Virol. 2000;74:7496–7507. doi: 10.1128/jvi.74.16.7496-7507.2000. [DOI] [PMC free article] [PubMed] [Google Scholar]
- 24.Del Val M, Volkmer H, Rothbard JB, Jonjic S, Messerle M, Schickedanz J, Reddehase MJ, Koszinowski UH. Molecular basis for cytolytic T-lymphocyte recognition of the murine cytomegalovirus immediate-early protein pp89. J Virol. 1988;62:3965–3972. doi: 10.1128/jvi.62.11.3965-3972.1988. [DOI] [PMC free article] [PubMed] [Google Scholar]
- 25.Reddehase MJ, Jonjic S, Weiland F, Mutter W, Koszinowski UH. Adoptive immunotherapy of murine cytomegalovirus adrenalitis in the immunocompromised host: CD4-helper-independent antiviral function of CD8-positive memory T lymphocytes derived from latently infected donors. J Virol. 1988;62:1061–1065. doi: 10.1128/jvi.62.3.1061-1065.1988. [DOI] [PMC free article] [PubMed] [Google Scholar]
- 26.Jonjic S, Pavic I, Lucin P, Rukavina D, Koszinowski UH. Efficacious control of cytomegalovirus infection after long-term depletion of CD8+ T lymphocytes. J Virol. 1990;64:5457–5464. doi: 10.1128/jvi.64.11.5457-5464.1990. [DOI] [PMC free article] [PubMed] [Google Scholar]
- 27.Biron CA, Byron KS, Sullivan JL. Severe herpesvirus infections in an adolescent without natural killer cells. N Engl J Med. 1989;320:1731–1735. doi: 10.1056/NEJM198906293202605. [DOI] [PubMed] [Google Scholar]
- 28.Daniels KA, Devora G, Lai WC, O'Donnell CL, Bennett M, Welsh RM. Murine cytomegalovirus is regulated by a discrete subset of natural killer cells reactive with monoclonal antibody to Ly49H. J Exp Med. 2001;194:29–44. doi: 10.1084/jem.194.1.29. [DOI] [PMC free article] [PubMed] [Google Scholar]
- 29.Welsh RM, Brubaker JO, Vargas-Cortes M, O'Donnell CL. Natural killer (NK) cell response to virus infections in mice with severe combined immunodeficiency. The stimulation of NK cells and the NK cell-dependent control of virus infections occur independently of T and B cell function. J Exp Med. 1991;173:1053–1063. doi: 10.1084/jem.173.5.1053. [DOI] [PMC free article] [PubMed] [Google Scholar]
- 30.Perlman JM, Argyle C. Lethal cytomegalovirus infection in preterm infants: clinical, radiological, and neuropathological findings. Ann Neurol. 1992;31:64–68. doi: 10.1002/ana.410310112. [DOI] [PubMed] [Google Scholar]
- 31.Malm G, Grondahl EH, Lewensohn-Fuchs I. Congenital cytomegalovirus infection: a retrospective diagnosis in a child with pachygyria. Pediatr Neurol. 2000;22:407–408. doi: 10.1016/s0887-8994(00)00126-0. [DOI] [PubMed] [Google Scholar]
- 32.Koontz T, Bralic M, Tomac J, Pernjak-Pugel E, Bantug G, Jonjic S, Britt WJ. Altered development of the brain after focal herpesvirus infection of the central nervous system. J Exp Med. 2008;205:423–435. doi: 10.1084/jem.20071489. [DOI] [PMC free article] [PubMed] [Google Scholar]
- 33.Lane TE, Liu MT, Chen BP, Asensio VC, Samawi RM, Paoletti AD, Campbell IL, Kunkel SL, Fox HS, Buchmeier MJ. A central role for CD4(+) T cells and RANTES in virus-induced central nervous system inflammation and demyelination. J Virol. 2000;74:1415–1424. doi: 10.1128/jvi.74.3.1415-1424.2000. [DOI] [PMC free article] [PubMed] [Google Scholar]
- 34.Crispe I. In Vitro assays for mouse lymphocyte function. In: Coico R, editor. Current Protocols in Immunology. John Wiley & Sons; 1997. pp. 3.21.21–23.21.28. [Google Scholar]
- 35.Fuller MJ, Zajac AJ. Ablation of CD8 and CD4 T cell responses by high viral loads. J Immunol. 2003;170:477–486. doi: 10.4049/jimmunol.170.1.477. [DOI] [PubMed] [Google Scholar]
- 36.Tebo AE, Fuller MJ, Gaddis DE, Kojima K, Rehani K, Zajac AJ. Rapid recruitment of virus-specific CD8 T cells restructures immunodominance during protective secondary responses. J Virol. 2005;79:12703–12713. doi: 10.1128/JVI.79.20.12703-12713.2005. [DOI] [PMC free article] [PubMed] [Google Scholar]
- 37.Irani DN, Griffin DE. Isolation of brain parenchymal lymphocytes for flow cytometric analysis. Application to acute viral encephalitis. J Immunol Methods. 1991;139:223–231. doi: 10.1016/0022-1759(91)90192-i. [DOI] [PubMed] [Google Scholar]
- 38.Carson MJ, Reilly CR, Sutcliffe JG, Lo D. Mature microglia resemble immature antigen-presenting cells. Glia. 1998;22:72–85. doi: 10.1002/(sici)1098-1136(199801)22:1<72::aid-glia7>3.0.co;2-a. [DOI] [PubMed] [Google Scholar]
- 39.Reddehase MJ, Rothbard JB, Koszinowski UH. A pentapeptide as minimal antigenic determinant for MHC class I-restricted T lymphocytes. Nature. 1989;337:651–653. doi: 10.1038/337651a0. [DOI] [PubMed] [Google Scholar]
- 40.Pahl-Seibert MF, Juelch M, Podlech J, Thomas D, Deegen P, Reddehase MJ, Holtappels R. Highly protective in vivo function of cytomegalovirus IE1 epitope-specific memory CD8 T cells purified by T-cell receptor-based cell sorting. J Virol. 2005;79:5400–5413. doi: 10.1128/JVI.79.9.5400-5413.2005. [DOI] [PMC free article] [PubMed] [Google Scholar]
- 41.Holtappels R, Thomas D, Podlech J, Geginat G, Steffens HP, Reddehase MJ. The putative natural killer decoy early gene m04 (gp34) of murine cytomegalovirus encodes an antigenic peptide recognized by protective antiviral CD8 T cells. J Virol. 2000;74:1871–1884. doi: 10.1128/jvi.74.4.1871-1884.2000. [DOI] [PMC free article] [PubMed] [Google Scholar]
- 42.Holtappels R, Thomas D, Podlech J, Reddehase MJ. Two antigenic peptides from genes m123 and m164 of murine cytomegalovirus quantitatively dominate CD8 T-cell memory in the H-2d haplotype. J Virol. 2002;76:151–164. doi: 10.1128/JVI.76.1.151-164.2002. [DOI] [PMC free article] [PubMed] [Google Scholar]
- 43.Harari A, Dutoit V, Cellerai C, Bart PA, Du Pasquier RA, Pantaleo G. Functional signatures of protective antiviral T-cell immunity in human virus infections. Immunol Rev. 2006;211:236–254. doi: 10.1111/j.0105-2896.2006.00395.x. [DOI] [PubMed] [Google Scholar]
- 44.Betts MR, Brenchley JM, Price DA, De Rosa SC, Douek DC, Roederer M, Koup RA. Sensitive and viable identification of antigen-specific CD8+ T cells by a flow cytometric assay for degranulation. J Immunol Methods. 2003;281:65–78. doi: 10.1016/s0022-1759(03)00265-5. [DOI] [PubMed] [Google Scholar]
- 45.Rubio V, Stuge TB, Singh N, Betts MR, Weber JS, Roederer M, Lee PP. Ex vivo identification, isolation and analysis of tumor-cytolytic T cells. Nat Med. 2003;9:1377–1382. doi: 10.1038/nm942. [DOI] [PubMed] [Google Scholar]
- 46.Podlech J, Holtappels R, Wirtz N, Steffens HP, Reddehase MJ. Reconstitution of CD8 T cells is essential for the prevention of multiple-organ cytomegalovirus histopathology after bone marrow transplantation. J Gen Virol. 1998;79(Pt 9):2099–2104. doi: 10.1099/0022-1317-79-9-2099. [DOI] [PubMed] [Google Scholar]
- 47.Polic B, Jonjic S, Pavic I, Crnkovic I, Zorica I, Hengel H, Lucin P, Koszinowski UH. Lack of MHC class I complex expression has no effect on spread and control of cytomegalovirus infection in vivo. J Gen Virol. 1996;77(Pt 2):217–225. doi: 10.1099/0022-1317-77-2-217. [DOI] [PubMed] [Google Scholar]
- 48.Reddehase MJ, Balthesen M, Rapp M, Jonjic S, Pavic I, Koszinowski UH. The conditions of primary infection define the load of latent viral genome in organs and the risk of recurrent cytomegalovirus disease. J Exp Med. 1994;179:185–193. doi: 10.1084/jem.179.1.185. [DOI] [PMC free article] [PubMed] [Google Scholar]
- 49.Lucin P, Jonjic S, Messerle M, Polic B, Hengel H, Koszinowski UH. Late phase inhibition of murine cytomegalovirus replication by synergistic action of interferon-gamma and tumour necrosis factor. J Gen Virol. 1994;75(Pt 1):101–110. doi: 10.1099/0022-1317-75-1-101. [DOI] [PubMed] [Google Scholar]
- 50.Sierro S, Rothkopf R, Klenerman P. Evolution of diverse antiviral CD8+ T cell populations after murine cytomegalovirus infection. Eur J Immunol. 2005;35:1113–1123. doi: 10.1002/eji.200425534. [DOI] [PubMed] [Google Scholar]
- 51.Riera L, Gariglio M, Valente G, Mullbacher A, Museteanu C, Landolfo S, Simon MM. Murine cytomegalovirus replication in salivary glands is controlled by both perforin and granzymes during acute infection. Eur J Immunol. 2000;30:1350–1355. doi: 10.1002/(SICI)1521-4141(200005)30:5<1350::AID-IMMU1350>3.0.CO;2-J. [DOI] [PubMed] [Google Scholar]
- 52.Riera L, Gariglio M, Pagano M, Gaiola O, Simon MM, Landolfo S. Control of murine cytomegalovirus replication in salivary glands during acute infection is independent of the Fas ligand/Fas system. New Microbiol. 2001;24:231–238. [PubMed] [Google Scholar]
- 53.Dunn HS, Haney DJ, Ghanekar SA, Stepick-Biek P, Lewis DB, Maecker HT. Dynamics of CD4 and CD8 T cell responses to cytomegalovirus in healthy human donors. J Infect Dis. 2002;186:15–22. doi: 10.1086/341079. [DOI] [PubMed] [Google Scholar]
- 54.Sylwester AW, Mitchell BL, Edgar JB, Taormina C, Pelte C, Ruchti F, Sleath PR, Grabstein KH, Hosken NA, Kern F, Nelson JA, Picker LJ. Broadly targeted human cytomegalovirus-specific CD4+ and CD8+ T cells dominate the memory compartments of exposed subjects. J Exp Med. 2005;202:673–685. doi: 10.1084/jem.20050882. [DOI] [PMC free article] [PubMed] [Google Scholar]
- 55.Kannanganat S, Ibegbu C, Chennareddi L, Robinson HL, Amara RR. Multiple-cytokine-producing antiviral CD4 T cells are functionally superior to single-cytokine-producing cells. J Virol. 2007;81:8468–8476. doi: 10.1128/JVI.00228-07. [DOI] [PMC free article] [PubMed] [Google Scholar]
- 56.Griffin DE. Immune responses to RNA-virus infections of the CNS. Nat Rev Immunol. 2003;3:493–502. doi: 10.1038/nri1105. [DOI] [PMC free article] [PubMed] [Google Scholar]
- 57.Binder GK, Griffin DE. Interferon-gamma-mediated site-specific clearance of alphavirus from CNS neurons. Science. 2001;293:303–306. doi: 10.1126/science.1059742. [DOI] [PubMed] [Google Scholar]
- 58.Patterson CE, Lawrence DM, Echols LA, Rall GF. Immune-mediated protection from measles virus-induced central nervous system disease is noncytolytic and gamma interferon dependent. J Virol. 2002;76:4497–4506. doi: 10.1128/JVI.76.9.4497-4506.2002. [DOI] [PMC free article] [PubMed] [Google Scholar]
- 59.Shrestha B, Samuel MA, Diamond MS. CD8+ T cells require perforin to clear West Nile virus from infected neurons. J Virol. 2006;80:119–129. doi: 10.1128/JVI.80.1.119-129.2006. [DOI] [PMC free article] [PubMed] [Google Scholar]
- 60.Munks MW, Gold MC, Zajac AL, Doom CM, Morello CS, Spector DH, Hill AB. Genome-wide analysis reveals a highly diverse CD8 T cell response to murine cytomegalovirus. J Immunol. 2006;176:3760–3766. doi: 10.4049/jimmunol.176.6.3760. [DOI] [PubMed] [Google Scholar]
- 61.McGavern DB, Truong P. Rebuilding an immune-mediated central nervous system disease: weighing the pathogenicity of antigen-specific versus bystander T cells. J Immunol. 2004;173:4779–4790. doi: 10.4049/jimmunol.173.8.4779. [DOI] [PMC free article] [PubMed] [Google Scholar]
- 62.Medawar P. Immunity to homologous grafted skin. III. The fate of skin homografts transplanted to the brain, to subcutaneous tissue, and to anterior chamber of the eye. British Journal of Experimental Pathology. 1948;29:58–69. [PMC free article] [PubMed] [Google Scholar]
- 63.Hurwitz AA, Sullivan TJ, Sobel RA, Allison JP. Cytotoxic T lymphocyte antigen-4 (CTLA-4) limits the expansion of encephalitogenic T cells in experimental autoimmune encephalomyelitis (EAE)-resistant BALB/c mice. Proc Natl Acad Sci U S A. 2002;99:3013–3017. doi: 10.1073/pnas.042684699. [DOI] [PMC free article] [PubMed] [Google Scholar]
- 64.Salama AD, Chitnis T, Imitola J, Ansari MJ, Akiba H, Tushima F, Azuma M, Yagita H, Sayegh MH, Khoury SJ. Critical role of the programmed death-1 (PD-1) pathway in regulation of experimental autoimmune encephalomyelitis. J Exp Med. 2003;198:71–78. doi: 10.1084/jem.20022119. [DOI] [PMC free article] [PubMed] [Google Scholar]
- 65.Li MO, Wan YY, Sanjabi S, Robertson AK, Flavell RA. Transforming growth factor-beta regulation of immune responses. Annu Rev Immunol. 2006;24:99–146. doi: 10.1146/annurev.immunol.24.021605.090737. [DOI] [PubMed] [Google Scholar]
- 66.Moore KW, de Waal Malefyt R, Coffman RL, O'Garra A. Interleukin-10 and the interleukin-10 receptor. Annu Rev Immunol. 2001;19:683–765. doi: 10.1146/annurev.immunol.19.1.683. [DOI] [PubMed] [Google Scholar]
- 67.Gomes FC, Sousa Vde O, Romao L. Emerging roles for TGF-beta1 in nervous system development. Int J Dev Neurosci. 2005;23:413–424. doi: 10.1016/j.ijdevneu.2005.04.001. [DOI] [PubMed] [Google Scholar]
- 68.Kossmann T, Morganti-Kossmann MC, Orenstein JM, Britt WJ, Wahl SM, Smith PD. Cytomegalovirus production by infected astrocytes correlates with transforming growth factor-beta release. J Infect Dis. 2003;187:534–541. doi: 10.1086/373995. [DOI] [PubMed] [Google Scholar]
- 69.Krakowski ML, Owens T. Naive T lymphocytes traffic to inflamed central nervous system, but require antigen recognition for activation. Eur J Immunol. 2000;30:1002–1009. doi: 10.1002/(SICI)1521-4141(200004)30:4<1002::AID-IMMU1002>3.0.CO;2-2. [DOI] [PubMed] [Google Scholar]
- 70.Galea I, Bernardes-Silva M, Forse PA, van Rooijen N, Liblau RS, Perry VH. An antigen-specific pathway for CD8 T cells across the blood-brain barrier. J Exp Med. 2007;204:2023–2030. doi: 10.1084/jem.20070064. [DOI] [PMC free article] [PubMed] [Google Scholar]
- 71.Fischer HG, Bonifas U, Reichmann G. Phenotype and functions of brain dendritic cells emerging during chronic infection of mice with Toxoplasma gondii. J Immunol. 2000;164:4826–4834. doi: 10.4049/jimmunol.164.9.4826. [DOI] [PubMed] [Google Scholar]
- 72.McMahon EJ, Bailey SL, Castenada CV, Waldner H, Miller SD. Epitope spreading initiates in the CNS in two mouse models of multiple sclerosis. Nat Med. 2005;11:335–339. doi: 10.1038/nm1202. [DOI] [PubMed] [Google Scholar]
- 73.Marten NW, Stohlman SA, Zhou J, Bergmann CC. Kinetics of virus-specific CD8+ -T-cell expansion and trafficking following central nervous system infection. J Virol. 2003;77:2775–2778. doi: 10.1128/JVI.77.4.2775-2778.2003. [DOI] [PMC free article] [PubMed] [Google Scholar]
- 74.Jonjic S, Mutter W, Weiland F, Reddehase MJ, Koszinowski UH. Site-restricted persistent cytomegalovirus infection after selective long-term depletion of CD4+ T lymphocytes. J Exp Med. 1989;169:1199–1212. doi: 10.1084/jem.169.4.1199. [DOI] [PMC free article] [PubMed] [Google Scholar]
- 75.Lucin P, Pavic I, Polic B, Jonjic S, Koszinowski UH. Gamma interferon-dependent clearance of cytomegalovirus infection in salivary glands. J Virol. 1992;66:1977–1984. doi: 10.1128/jvi.66.4.1977-1984.1992. [DOI] [PMC free article] [PubMed] [Google Scholar]
- 76.Humphreys IR, de Trez C, Kinkade A, Benedict CA, Croft M, Ware CF. Cytomegalovirus exploits IL-10-mediated immune regulation in the salivary glands. J Exp Med. 2007;204:1217–1225. doi: 10.1084/jem.20062424. [DOI] [PMC free article] [PubMed] [Google Scholar]
- 77.Cavanaugh VJ, Deng Y, Birkenbach MP, Slater JS, Campbell AE. Vigorous innate and virus-specific cytotoxic T-lymphocyte responses to murine cytomegalovirus in the submaxillary salivary gland. J Virol. 2003;77:1703–1717. doi: 10.1128/JVI.77.3.1703-1717.2003. [DOI] [PMC free article] [PubMed] [Google Scholar]
- 78.Tishon A, Lewicki H, Andaya A, McGavern D, Martin L, Oldstone MB. CD4 T cell control primary measles virus infection of the CNS: regulation is dependent on combined activity with either CD8 T cells or with B cells: CD4, CD8 or B cells alone are ineffective. Virology. 2006;347:234–245. doi: 10.1016/j.virol.2006.01.050. [DOI] [PubMed] [Google Scholar]