Abstract
Aim: To explore Trichostatin A (TSA) effect on SGC-7901 gastric cancer cells. Methods: MTT, fluorescence microscopy, and flow cytometry were used to assess TSA effect on cell growth and apoptosis in SGC-7901. Immunocytochemistry was used to evaluate the expression of acetylated histone H4 in SGC-7901 cells.Gene expression profile was determined by microarray assays. Glycoprotein hormones alpha subunit (CGA) gene and protein expressions in SGC-7901 cells were evaluated by Real-time PCR and Western blot, respectively. In addition, CGA protein levels in gastric adenocarcinoma and normal adjacent tissues were assessed by immunohistochemistry. Results: TSA inhibited SGC-7901 cell growth. In addition, cell proliferation was significantly decreased (P = 0.02) in TSA treatment groups (0.93 ± 0.07) compared with controls (1.15 ± 0.07). Apoptosis related morphological changes, including nuclear chromatin condensation and fluorescence strength, were observed by fluorescence microscopy. These findings corroborated the increased expression of acetylated histone H4 observed in TSA treated cells compared to controls, as determined by immunocytochemistry. Interestingly, treatment of SGC-7901 cells with TSA (75 ng/ml) resulted in CGA gene down-regulation (P = 0.0381). Accordingly, CGA protein levels were decreased in TSA treated SGC-7901 cells. Finally, immunohistochemistry analysis showed that CGA expression was significantly higher in gastric adenocarcinoma tissues than normal adjacent tissues (P = 0.001). Conclusion: TSA induces cell apoptosis and increases the levels of acetylated histone H4 in SGC-7901 cells. In addition, TSA treatment decreases the expression in gastric cancer cells of the CGA gene, which is upregulated in gastric adenocarcinoma tissues.
Keywords: Gastric cancer, trichostatin A, SGC-7901, apoptosis, histone H4, glycoprotein hormones α subunit
Introduction
Gastric cancer is one of the most malicious diseases and constitutes a serious threat to human health [1]. Most cases are diagnosed in advanced stages, which results in poor prognosis. Trichostatin A (TSA), one of the most potent histone acetylase and deacetylase (HDAC) inhibitors, has recently attracted increasing attention. Indeed, TSA has been shown to inhibit the proliferation of tumor cells and induce cancer cell apoptosis [2-4]. Considering that TSA induces apoptosis in different cell types, this study aimed to assess its effect on apoptosis and acetylated histone H4 expression in SGC-7901 gastric cancer cells. In addition, the gene expression profile of SGC-7901 cells was determined after treatment with TSA by microarray experiments and real-time PCR. Furthermore, CGA protein expression was assessed by immunohistochemistry in gastric carcinoma and normal adjacent tissues, to determine the mechanisms by which TSA induces apoptosis in SGC-7901 gastric cancer cells.
Materials and methods
Reagents and antibodies
TSA (Sigma-Aldrich, United Kingdom) stock solutions were prepared in ethanol and stored at -20°C. Dimethylthiazol diphenyl tetrazolium bromide (MTT) and propidium iodide (PI) were from Zhongshan Golden Bridge Biotechnology (Beijing China), and Hoechst 33342 was purchased from Sigma-Aldrich. Anti-GAPDH and Anti-acetyl-histone H4 antibodies were purchased from Upstate Biotechnology (Upstate Biotechnology, USA). The Jing Xin ® cDNA amplification tag kit and 22 k Human Genome Array were obtained from Capital Bio Corporation (Beijing, China). Trizol was purchased from Invitrogen (USA), while the Applied Biosystems High Capacity Reverse Transcriptase and ExScriptTM RT-PCR kits were from Applied Biosystems (USA). Antihuman Glycoprotein hormones alpha subunit (CGA) polyclonal and secondary antibodies were purchased from Abcam Corporation (United Kingdom). The enhanced SABC immunocytochemical detection kit and AEC (0.02% 3-amino-9-ethylcarbazole) were purchased from Biosynthesis Biotechnology Co., Ltd (Beijing, China) and Zhongshan Golden Bridge Biotechnology Co., Ltd (Beijing, China), respectively.
Cell culture and treatments
The human gastric epithelial cell line SGC-7901 was provided by Heilongjiang Institute of Cancer Research. SGC-7901 cells were cultured in RPMI-1640 supplemented with 10% (v/v) fetal calf serum, 100 units/ml penicillin and 100 μg/ml streptomycin at 37°C in humidified environment containing 5% CO2.
MTT assay
The MTT assay was used to assess cell viability. Cells were seeded in 96-well plates at predetermined optimal density to ensure exponential growth for the assay duration. Four wells were set up for each treatment, and untreated cells served as control. Treatment was carried out for 12, 24, 48 and 72 h with TSA at final concentrations of 37.5 and 75 ng/ml, respectively. At each time point, 10 μl MTT (6 g/L) was added per well, followed by incubation for 4 h at 37°C. After careful removal of the medium, the MTT solubilization solution (dimethylsulphoxide: ethanol, 1:1) was added and shaken for 10 min until complete dissolution of the crystals. Finally, optical density (OD) was measured on an ELISA microplate reader at 550 nm. Data analysis was performed with the SPPS statistical software (Version 13.0). P < 0.05 was considered statistically significant.
Detection of chromatin condensation
Chromatin condensation was detected by nucleus staining with Hoechst 33342. SGC-7901 cells were collected by centrifugation (500 g for 5 min at 4°C) and washed twice with PBS. Then, cells were fixed in 10% formaldehyde and stored at 4°C. For analysis, cells were washed in PBS and Hoechst 33342 (5 mg/L) was directly added to the medium with gentle shaking at 4°C for 5 min. The stained nuclei were visualized on a Zeiss Axiophot fluorescence microscope at 400 × magnification with excitation at 355-366 nm and emission at 465-480 nm. Four independent replicates were assessed per treatment.
Cell apoptosis assays
To assess apoptosis, cells were trypsinized, washed and fixed in ice-cold ethanol at 4°C for at least 12 h. Immediately before flow cytometry analysis, cells were permeabilized and stained with propidium iodide for 20 min. FACS analysis was carried out on a FACSCalibur Analytic Flow cytometer.
Immunocytochemistry
Immunocytochemical detection was carried out by the SABC method. Cells were cultured in six well plates containing sterile cover glass. At each time point, the culture medium was aspirated and cells were fixed with 4% formaldehyde at room temperature for 30 minutes. After 3 washes in PBS, nuclei staining was carried out with acetylated histone H4 antibodies. Positive staining appeared explicitly in nuclei as tan or brown signals. For analysis, 10 high magnification fields were randomly selected and the percentage of positive cells was determine during UTHSCSA Image Tool version 3.0. Data expressed as mean ± standard deviation (x̅ ± S) were analyzed using F test, with the SPPS statistical software (Version 13.0). P < 0.05 was considered statistically significant.
RNA isolation
Total RNA was extracted with the Trizol one-step extraction kit, according to the manufacturer’s protocol. Then, RNA concentrations and integrity were assessed spectrophotometrically.
Microarray assays
Microarray experiments were carried out by CapitalBio Corporation (Beijing) on LuxScan 10 Ka two-channel laser scanner (CapitalBio Corporation). Microarray data were obtained using LuxScan image analysis software 3.0 (CapitalBio Corporation). Microarray experiments were repeated 3 times. Data analysis was performed by SAM (Significance Analysis of Microarrays) software (CapitalBio Corporation), with FDR (False discovery rate) control within 5% and q < 0.05 considered significant for differentially expressed genes.
RT-qPCR
First strand cDNA synthesis was performed with the Applied Biosystems High Capacity Reverse Transcriptase kit (Applied Biosystems, Foster City, CA). Subsequently, quantitative PCR (qPCR) was carried out using primers designed with Primer-BLAST (www.ncbi.nlm.nih.gov/tools/primer-blast).
All primers were synthesized by Genechem chemical technology co., LTD (Shanghai, China). Primer sequences were as follows: (1) CGA Forward: 5’- CACATTGTCGGTGTTTCT -3’; CGA Reverse: 5’- ACCTTAGTGGAGTGGGATA -3’. (2) GAPDH Forward: 5’- TGACTTCAACAGCGACACCCA -3’, GAPDH reverse: 5’- CACCCTGTTGCTGTAGCCAAA -3’. Amplicon sizes were 161 and 121 bp, respectively. Each PCR reaction mix contained 5 μl Applied Biosystems SYBR ® green PCR master mix, 2.5 μl of 3 μM forward and reverse primer mix, 0.5 μl RNAse-free H2O, and 2 μl of 2 ng/μl cDNA. Reactions were added to a 384-well optical reaction plate (Applied Biosystems) and fluorescence was quantified in real-time on an Applied Biosystems 7300 Real Time PCR System (Foster City, CA) under the following conditions: 50°C for 2 min, 95°C for 10 min, and 45 cycles of 95°C for 15 s and 60°C for 30 s. Melting curves were obtained for each reaction, and relative mRNA expression was determined by the comparative ΔΔCt method, using GAPDH as internal control. Statistical differences in mRNA amounts were assessedby unpaired, two-tailed Student’ t-test, using Graphpad Prism 4.0. p < 0.05 was considered statistically significant.
Western blotting
Cells treated as indicated were harvested in 5 ml medium, pelleted by centrifugation (1000×g for 5 min at 4°C), washed twice with ice-cold PBS and lysed in ice-cold HEPES buffer [50 mM HEPES (pH 7.5), 10 mM NaCl, 5 mM MgCl2, 1 mM EDTA, 10% (V/V) glycerol, 1% (v/v) Triton X-100, a cocktail of protease inhibitors and 1 µg/mL TSA] on ice for 30 min. After lysate clarification by centrifugation (15000×g for 10 min at 4°C) the supernatants were either analyzed immediately or stored at -80°C. Equal protein amounts (50 µg) from total cell lysates were resolved by SDS-PAGE using precast 12% Bis-Tris gradient gels and transferred onto polyvinylidene difluoride (PVDF) membranes. Then, membranes were blocked overnight at 4°C in blocking buffer [5% (v/v) nonfat dried milk, 150 mM NaCl, 10 mM Tris (pH 8.0) and 0.05% (v/v) Tween 20]. After incubation with primary antibodies at appropriate dilutions in blocking buffer overnight at 4°C., membranes were washed with Tris-buffered saline (pH 7.2) containing 0.5% Tween 20 (TBS-T) and incubated at room temperature with horseradish peroxidase-conjugated secondary antibodies. After extensive washing with TBS-T, bands were visualized by enhanced chemiluminescence followed by exposure to autoradiography films.
Immunohistochemistry
100 tissue samples from advanced gastric adenocarcinoma cases and matching normal gastric tissue specimens adjacent to carcinoma were obtained from our pathology department, from 2011 to 2013. Samples were fixed in 10% formaldehyde and embedded in paraffin. Hematoxylin and Eosin (H & E) stained slides were reviewed by a board-certified pathologist to confirm histological consistency for advanced gastric adenocarcinoma and to verify that normal adjacent specimens contained no tumor cells. Slides were analyzed by the SP immunohistochemical staining procedure. CGA positive signals appeared mainly in the cytoplasm. Data were obtained based on the semi-quantitative method [5], taking into account the percentage of positive cells and staining intensity. According to the percentage of positive cells, < 5% was attributed 0 point; 5% ~ 25% was represented by 1 point; 26% ~ 50% counted for 2 points, 51% ~ 75% for 3 points, and > 75% for 4 points. Based on staining strength, no color was rated 0 point; pale tan was represented by 1 point; tan was attributed 2 points, and deep palm red 3 points. Overall, two scores were obtained: ≤ 2 was considered negative, and > 2 was deemed positive. Qualitative data were analyzed using χ2 test, with the SPPS statistical software (Version 13.0). P < 0.05 was considered statistically significant.
Results
TSA inhibited SGC-7901 cell proliferation
As shown in Table 1A and 1B, treatment of SGC-7901 with TSA at 75 ng/ml for 48 and 72 h resulted in significantly decreased cell viability, compared to control cells (P < 0.05).
Table 1A.
SGC-7091cell proliferation in presence of various concentrations of TSA for 72 h (Mean ± SD)
| TSA | 1 | 2 | 3 | 4 | 5 | control |
|---|---|---|---|---|---|---|
| SGC-7091 | 1.11 ± 0.081 | 0.76 ± 0.091 | 0.72 ± 0.102 | 0.15 ± 0.032 | 0.15 ± 0.022 | 1.15 ± 0.05 |
p = 0.02 vs control;
p = 0.005 vs control.
1: 37.5 ng/ml; 2: 75 ng/ml; 3: 150 ng/ml; 4: 300 ng/ml; 5: 600 ng/ml.
Table 1B.
SGC-7091 cell proliferation (37.5 and 75 ng/ml) for 12, 24, 48, and 72 h (Mean ± SD)
| TSA | 12 h | 24 h | 48 h | 72 h | control |
|---|---|---|---|---|---|
| 37.5 ng/ml | 1.14 ± 0.12 | 1.13 ± 0.04 | 1.12 ± 0.03 | 1.11 ± 0.06 | 1.15 ± 0.07 |
| 75 ng/ml | 1.12 ± 0.06 | 1.09 ± 0.08 | 0.93 ± 0.071 | 0.75 ± 0.132 |
p = 0.02 vs control;
p = 0.005 vs control;
The treatment with TSA at 75 ng/ml for 48 and 72 h resulted in a significant decrease in SGC-7901 cell viability compared to the control group.
TSA induced apoptosis in SGC-7901 cells
To further characterize the TSA induced cytotoxicity, the apoptosis related morphological changes were assessed by fluorescence microscopy. At 48 h, SGC-7901 cells treated with TSA were stained by Hoechst 33342, a classical method for identification of apoptotic cells based on nucleus morphology. The results indicated that the nuclei of most SGC-7901 cells treated with TSA were highly condensed and brightly stained; while the cells in the control group appeared slightly blue. In addition, flow cytometry confirmed that TSA treatment (75 ng/ml at 48 h) overtly induced apoptosis in SGC-7901 cells, with rates increasing from 9.25 to 22.01% in control and treatment groups, respectively (Figure 1).
Figure 1.
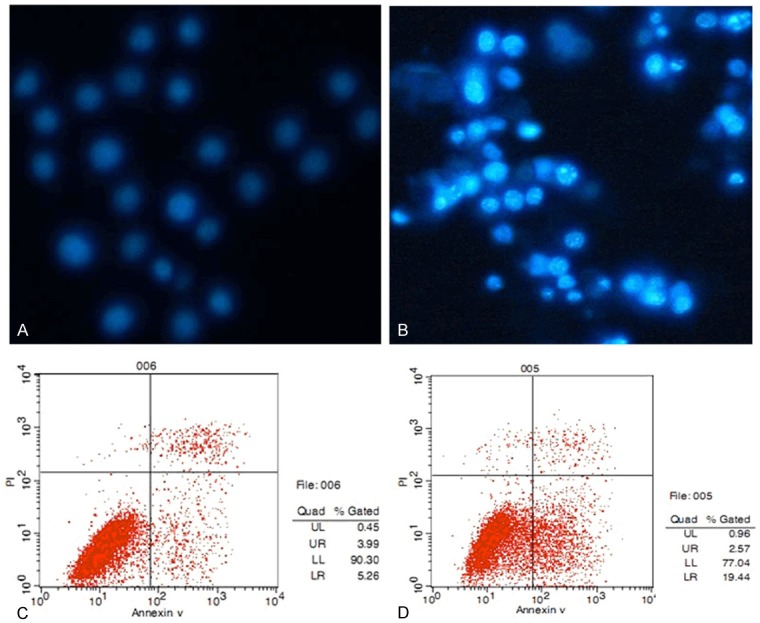
TSA induced apoptosis in SGC-7901 cells. A, B: Nuclei of most SGC-7901 cells treated with TSA were highly condensed and brightly stained; while the cells in the control group mostly appeared slightly blue. C, D: TSA treatment (75 ng/ml for 48 h) overtly induced apoptosis in SGC-7901 cells, with rates increasing from 9.25% (control group) to 22.01% (TSA group) as shown by flow cytometry.
Immunocytochemistry detection of histone H4 acetylation
Histone H4 acetylation was detected by immunocytochemistry. As shown in Figure 2, cells stained positive for acetylated histone H4 in the control group was 7.12 ± 2.06; this value was significantly increased after TSA treatment to 25.43 ± 6.07, indicating a statistically significant difference between both groups (F = 35.85, P < 0.01).
Figure 2.
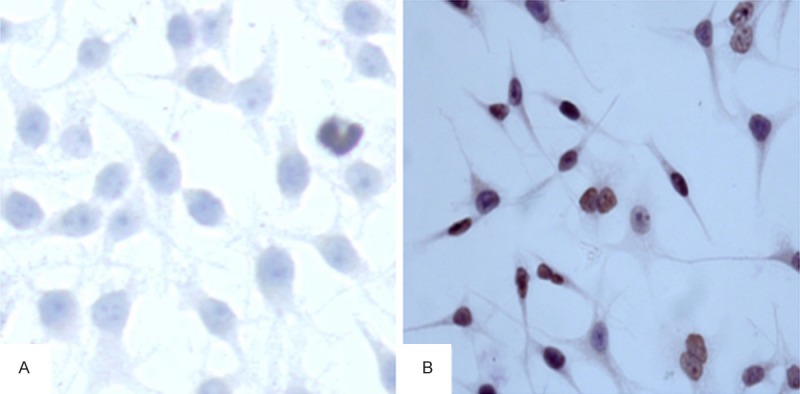
Expression of acetylated histone H4 in SGC-7901. The expression of acetylated histone H4 was increased in the TSA group (25.43 ± 6.07) at 48 h compared with controls (7.12 ± 2.06) as detected by immunocytochemistry (×400). Acetylated histone H4 positive staining was localized in the nuclei and positive signals appeared tan or brown. A: Negative, B: Positive.
Gene expression profile by microarray analyses
Each array contained 25122 probes of which 20449 represented unique genes. Differentially expressed genes were detected in SGC-7901 gastric cancer cells after treatment with 75 ng/ml TSA for 48 h (Figure 3). Interestingly, the expression of 201 genes decreased in SGC-7901 cells in these conditions. Specifically, glycoprotein hormones alpha subunit (CGA) gene expression in SGC-7901 cells was significantly reduced: the mean value of CGA gene expression ratio was 0.4468 (0.4232, 0.4503, and 0.4558 for individual replicates, respectively). The Q-value was 0.0372, indicating astatistically significant downregulation.
Figure 3.
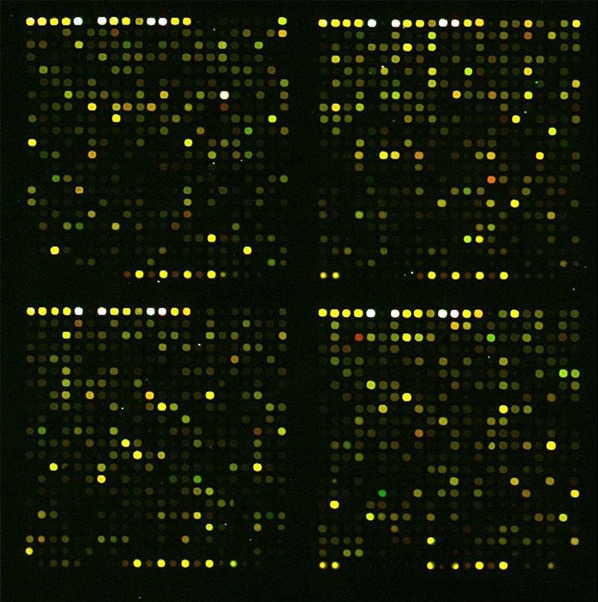
Microarray hybridization pseudo color chart. Each array contained 25122 probes of which 20449 represented unique genes. The expression of 201 genes decreased in SGC-7901 cells treated with 75 ng/ml TSA for 48 hours. (red: increased expression, green: decreased expression).
CGA gene expression assessed by RT-qPCR data
A statistically significant downregulation of CGA gene expression was observed in SGC-7901 cells after 48 h treatment with TSA at 75 ng/ml. Indeed, ratio (2-ΔΔCt) values of 1.002 ± 0.0883 and 0.445 ± 0.0261 were obtained for control and TSA groups, respectively (p-value = 0.0381) as shown in Figure 4.
Figure 4.
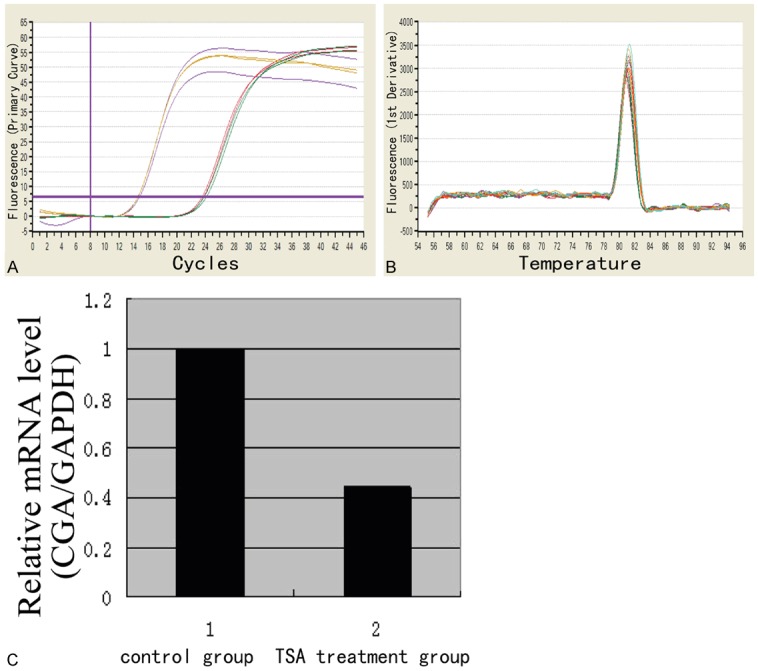
CGA gene expression levels detected by RT-qPCR. A: CGA gene amplification curve; B: CGA gene melting curve; C: CGA gene expression; A statistically significant downregulation of CGA gene expression was detected in SGC-7901 gastric cancer cells after 48 h treatment with TSA at 75 ng/ml. Indeed, ratio (2-ΔΔCt) values of 1.002 ± 0.0883 and 0.445 ± 0.0261 were obtained for control and TSA groups, respectively (p-value = 0.0381).
CGA protein expression
Protein levels were determined by western blot. In agreement with gene expression data, decreased CGA protein amounts were detected in SGC-7901 cells after 48 h incubation in presence of TSA at 75 ng/ml (Figure 5).
Figure 5.
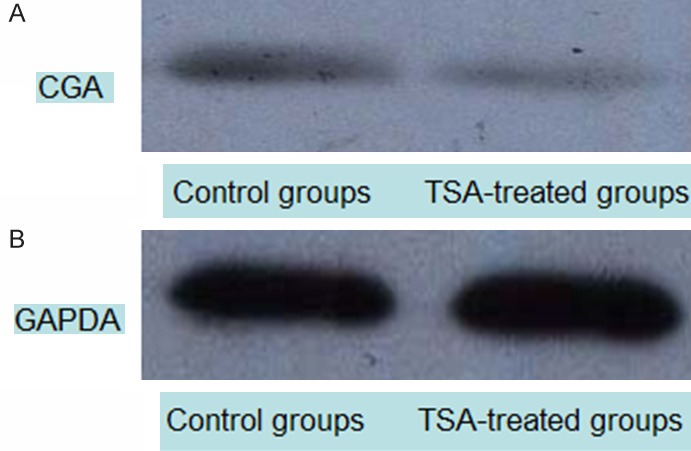
CGA protein levels detected by western blot. Cell lysates were analyzed by Western blot using anti-GAPDH and Anti-CGA antibodies. A: CGA (56 KDa); B: GAPDH (loading control, 37 KDa). CGA protein expression was reduced in the TSA group at 48 h compared with controls.
Immunohistochemistry detection of CGA ex vivo
Positive expression of CGA was detected in 74% gastric adenocarcinoma tissue samples. In normal tissues adjacent to carcinoma, only 24% specimens exhibited positive CGA expression (Figure 6). These results indicated a significant increase in CGA expression in gastric adenocarcinoma compared with normal tissue (χ2 value 10.454, P = 0.001).
Figure 6.
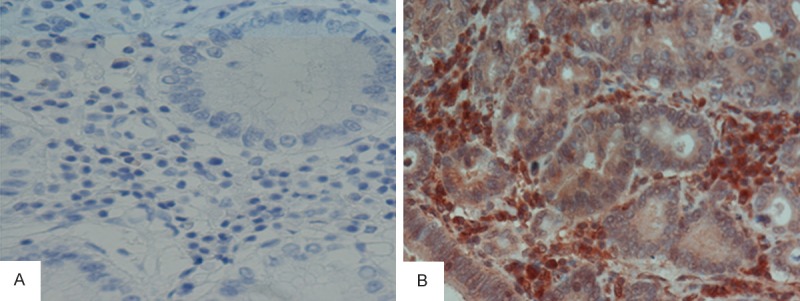
CGA detection by immunohistochemistryin tissue specimens from gastric adenocarcinoma patients. Expression of CGA was mainly localized tothe cytoplasm. Based on a method combining the percentage of positive cells and signal intensity, 74% were positive for CGA expression in gastric adenocarcinoma tissue samples. In normal tissue specimens adjacent to carcinoma, only 24% were deemed positive. This indicates a significant difference in CGA expression between gastric adenocarcinoma than normal tissues (A: Negative, B: Positive; ×400).
Discussion
Regulation of acetylation is a balance between deacetylators and acetylators [6]. Histone deacetylases (HDACs) are a class of histone modifiers that remove acetyl units from lysine residues on histones. To date, 18 HDACs have been described and are classified into four groups (HDAC I, II, III and IV) according to their similarity, with reference to their analogues in yeast [7]. The overexpression of histone deacetylase (HDAC) and subsequent decrease in the acetylation levels of nuclear histones are frequently observed in cancer cells. Indeed, HDACs are particularly important in cancer biology, promoting proliferation, angiogenesis, migration/metastasis, and resistance to chemotherapy, and inhibiting apoptosis and differentiation [8]. Generally it is accepted that histone deacetylation suppresses the expression of bound genes. Therefore, it has been suggested that HDAC might contribute to cancer cell survival [9,10]. Identification of HDAC inhibitors is therefore a new therapeutic approach to treat cancer [11]. Trichostatin A (TSA) is an antifungal antibiotic and a specific inhibitor of HDAC activity that has been reported by numerous studies to induce apoptosis in cancer cells [12-14].
Considering the ability of TSA to induce apoptosis in different cell types, we assessed apoptosis in SGC-7901 gastric cancer cells treated with TSA. We found that TSA significantly reduced cell growth and induced apoptosis in SGC-7901 tumor cells. Our study also demonstrated that TSA increased the levels of acetylated histone H4 in SGC-7901 cells. In addition, several genes were found regulated in gene microarray experiments. Specifically, CGA (Glycoprotein hormones alpha subunit) gene expression was significantly decreased in SGC-7901 gastric cancer cells after treatment with TSA. This was verified by Real-time PCR and Western blot data corroborated these findings. GCA codes for the common alpha subunit to the four glycoprotein hormones Hcg (human chorionic gonadotropin), LH (luteinizing hormone), FSH (follicle-stimulating hormone) and TSH (thyroid-stimulating hormone). Most studies focusing on CGA gene expression in placenta and pituitary tissues have suggested that the tissue-specific expression of the CGA gene is determined by a combination of several factors, some of which are common to all tissues and others specific to the given tissue. The structure of the CGA promoter has been described [15], and an antisense sequence to the CGA gene was shown to inhibit the growth of tumor cells [16]. However, little is known about CGA involvement in carcinogenesis.
In order to understand CGA gene expression in vivo, clinical specimens from advanced gastric cancer patients were assessed. The results indicated a significantly higher CGA gene expression in advanced gastric carcinoma tissues samples in comparison with normal tissue specimens adjacent to carcinoma. Our results might suggest a correlation between CGA gene expression and gastric cancer cell apoptosis. However, this hypothesis needs to be validated in further studies.
In summary, the CGA gene may play a role in the occurrence of gastric carcinoma, and its overexpression may be related to apoptosis in gastric cancer cells.
Acknowledgements
This work was supported by State-Province Key Laboratories of Biomedicine-Pharmaceutics of China and the Opening Project of Key Laboratory of Medical Genetics (Harbin Medical University), Heilongjiang Higher Education Institutions of China.
Disclosure of conflict of interest
None.
References
- 1.Hartgrink HH, Jansen EP, van Grieken NC, van de Velde CJ. Gastric cancer. Lancet. 2009;374:477–490. doi: 10.1016/S0140-6736(09)60617-6. [DOI] [PMC free article] [PubMed] [Google Scholar]
- 2.Chatterjee N, Wang WL, Conklin T, Chittur S, Tenniswood M. Histone deacetylase inhibitors modulate miRNA and mRNA expression, block metaphase, and induce apoptosis in inflammatory breast cancer cells. Cancer Biol Ther. 2013;14:658–671. doi: 10.4161/cbt.25088. [DOI] [PMC free article] [PubMed] [Google Scholar]
- 3.Chen CQ, Chen CS, Chen JJ, Zhou LP, Xu HL, Jin WW, Wu JB, Gao SM. Histone deacetylases inhibitor trichostatin A increases the expression of Dleu2/miR-15a/16-1 via HDAC3 in non-small cell lung cancer. Mol Cell Biochem. 2013;383:137–148. doi: 10.1007/s11010-013-1762-z. [DOI] [PubMed] [Google Scholar]
- 4.Liu Y, He G, Wang Y, Guan X, Pang X, Zhang B. MCM-2 is a therapeutic target of trichostatin A in colon cancer cells. Toxicol Lett. 2013;221:23–30. doi: 10.1016/j.toxlet.2013.05.643. [DOI] [PubMed] [Google Scholar]
- 5.Kyo S, Sakaguchi J, Ohno S, Mizumoto Y, Maida Y, Hashimoto M, Nakamura M, Takakura M, Nakajima M, Masutomi K, Inoue M Kyo S, Sakaguehi J. High twist expression is involved in infiltrative endometrial cancer and affects patient survival. Hum Pathol. 2006;37:431–38. doi: 10.1016/j.humpath.2005.12.021. [DOI] [PubMed] [Google Scholar]
- 6.Verdone L, Agricola E, Caserta M, Di ME. Histone acetylation in gene regulation. Brief Funct Genomic Proteomic. 2006;5:209–221. doi: 10.1093/bfgp/ell028. [DOI] [PubMed] [Google Scholar]
- 7.Groselj B, Sharma NL, Hamdy FC, Kerr M, Kiltie AE. Histone deacetylase inhibitors as radiosensitisers: effects on DNA damage signalling and repair. Br J Cancer. 2013;108:748–754. doi: 10.1038/bjc.2013.21. [DOI] [PMC free article] [PubMed] [Google Scholar]
- 8.Witt O, Deubzer HE, Milde T, Oehme I. HDAC family: What are the cancer relevant targets? Cancer Lett. 2009;277:8–21. doi: 10.1016/j.canlet.2008.08.016. [DOI] [PubMed] [Google Scholar]
- 9.Son CH, Keum JH, Yang K, Nam J, Kim MJ, Kim SH, Kang CD, Oh SO, Kim CD, Park YS, Bae J. Synergistic enhancement of NK cell-mediated cytotoxicity by combination of histone deacetylase inhibitor and ionizing radiation. Radiat Oncol. 2014;9:49. doi: 10.1186/1748-717X-9-49. [DOI] [PMC free article] [PubMed] [Google Scholar]
- 10.Huang EC, Zhao Y, Chen G, Baek SJ, McEntee MF, Minkin S, Biggerstaff JP, Whelan J. Zyflamend, a polyherbal mixture, down regulates class I and class II histone deacetylases and increases p21 levels in castrate-resistant prostate cancer cells. BMC Complement Altern Med. 2014;14:68. doi: 10.1186/1472-6882-14-68. [DOI] [PMC free article] [PubMed] [Google Scholar]
- 11.Hoshino I, Matsubara H. Recent advances in histone deacetylase targeted cancer therapy. Surg Today. 2010;40:809–815. doi: 10.1007/s00595-010-4300-6. [DOI] [PubMed] [Google Scholar]
- 12.Song WF, Wang L, Huang WY, Cai X, Cui JJ, Wang LW. MiR-21 Upregulation Induced by Promoter Zone Histone Acetylation is Associated with Chemoresistance to Gemcitabine and Enhanced Malignancy of Pancreatic cancer Cells. Asian Pac J Cancer Prev. 2013;14:7529–7536. doi: 10.7314/apjcp.2013.14.12.7529. [DOI] [PubMed] [Google Scholar]
- 13.Peng L, Li FX, Shao WF, Xiong JB. Tricostantin A inhibits self-renewal of breast cancer stem cells in vitro. Nan Fang Yi Ke Da Xue Xue Bao. 2013;33:1421–1426. [PubMed] [Google Scholar]
- 14.Yang H, Zhong Y, Xie H, Lai X, Xu M, Nie Y, Liu S, Wan YJ. Induction of the liver cancer-down-regulated long noncoding RNA uc002mbe. 2 mediates trichostatin-induced apoptosis of liver cancer cells. Biochem Pharmacol. 2013;85:1761–1769. doi: 10.1016/j.bcp.2013.04.020. [DOI] [PMC free article] [PubMed] [Google Scholar]
- 15.Bièche I, Parfait B, Le Doussal V, Olivi M, Rio MC, Lidereau R, Vidaud M. Identification of CGA as aNovel Estrogen Receptor-resonsive Gene in breast Cancer: An Outstanding Candidate Marker to Predict the Response to Endocrine Therapy. Cancer Res. 2001;61:1652–1658. [PubMed] [Google Scholar]
- 16.Meng R, Tang HY, Westfall J, London D, Cao JH, Mousa SA, Luidens M, Hercbergs A, Davis FB, Davis PJ, Lin HY. Crosstalk between integrin αvβ3 and estrogen receptor-α is involved in thyroid hormone-induced proliferation in human lung carcinoma cells. PLoS One. 2011;6:e27547. doi: 10.1371/journal.pone.0027547. [DOI] [PMC free article] [PubMed] [Google Scholar]


