

Abstract
The present study aimed to evaluate the effect of two weeks of physical detraining (PD) on energy balance components, white adipose tissue (WAT) metabolism, body weight (BW) and adiposity. Male C57BL/6J mice were assigned into groups sedentary (S, n = 20) and trained (T, n = 18). Physical training (PT) consisted of two 1.5 h daily sessions of swimming, 5 times/week for 4 weeks. After the PT, some of the S (S4, n = 10) and T (T4, n = 8) animals were sacrificed, and the others were kept sedentary (S6, n = 10) or detrained for two weeks (D, n = 10). After PT, the T group showed lower BW compared with S group, but PD reversed this response. The BW gains were 4%, 3% and 6.3% in S, S6 and D groups, respectively, however the T group decreased by 1.7%. T4 and D groups showed lower visceral fat depots and larger heart and left ventricle weights compared with S4 and S6 groups. Food intake, oxygen consumption at rest and fasting-induced weight loss were higher in T4 group compared with S4, and this was reversed by PD. Serum concentration of insulin, the activity of enzyme FAS and mean blood pressure did not differ among groups, but the concentration of leptin and resting heart rate were lower in T4 and D groups compared with S4 and S6 groups. T4 group increased lipolytic activity stimulated by isoproterenol and citrate synthase activity, which were reversed by PD. In conclusion, PD reversed the components of energy balance by reducing food intake and resting metabolism, and impaired WAT lipolytic activity, but not lipogenic activity. These changes resulted in remodeling of BW, but not adiposity.
Keywords: Physical training suspension, energy balance, body weight, lipolysis
Introduction
Physical training (PT) has been recommend to control body weight, to prevent and to treat obesity by improving energy expenditure [1], and reducing white adipose tissue (WAT) mass and body weight [2,3]. These responses can be associated with an increase in the lipolytic activity of WAT (triacylglycerol hydrolysis) and the higher use of fatty acids as an energy source by skeletal muscle [3,4]. In fact, PT improves the transport of fatty acids in skeletal muscle [5], increases the activity of oxidative enzymes [6,7] and promotes mitochondrial biogenesis [8], which favors fatty acid oxidation instead of storage.
Although the effect of PT on energy metabolism and its preventive role against obesity and cardiovascular diseases are well described in the literature, performing regular PT throughout life is rarely observed in the population. In this context, the benefits obtained with PT can be reversed after a period of physical detraining (PD). The increase in adiposity and body weight are typically observed in ex-athletes, which become more susceptible to weight gain after the suspension of PT [9]. Furthermore, considering the association between high adiposity and insulin resistance, adipokines secretion by the WAT, lipid profile damage and metabolic syndrome [3,10], PD can favor the development of chronic metabolic diseases [11].
Previous studies have shown the effects of PD in the cardiovascular system and energy metabolism [12,13]. PD impairs fatty acid oxidation [14], which may lead to increased adiposity and body weight [15-17]. Recently, Sertie and colleagues [13] identified that increases in adipocyte volume and size associated with PD in rats are mediated by increases in adipogenesis and lipogenic activity of adipocytes, resulting in higher body weight gain and adiposity. Although part of the cellular mechanisms involved in body weight gain and adiposity induced by PD have been revealed, a knowledge gap still exists regarding the effect of PD on other determinants of energy balance such as food intake and resting energy expenditure, and their effects on WAT metabolism and body weight. Evidence in the literature shows that PT can improve energy expenditure and induce negative energy balance [18,19], however the effect of PD remains to be investigated.
Considering the role of PT to control body weight and adiposity, and the potential of PD to reverse the metabolic adaptations induced by PT, the present study aimed to determine the effect of two weeks of PD on energy balance components, WAT metabolism, body weight and adiposity. We hypothesized that the remodeling of body weight and adiposity induced by PD are mediated by losses in energy balance and WAT metabolic activities.
Material and methods
Mice
Eight-week-old male C57BL/6 mice were randomized into two groups, sedentary (S, n = 20) and exercise-trained (T, n = 18). After PT, some of the exercise-trained (T4, n = 8) and sedentary (S4, n = 10) mice were sacrificed, and the remaining mice were detrained for 2 weeks (D, n = 10) or kept sedentary (S6, n = 10), respectively. Animals were maintained in the same housing conditions (12 h light/12 h dark cycle and temperature 22°C), with free access to tap water and food. All experimental procedures were approved by the ethics in Research Committee from School of Physical Education and Sport from University of Sao Paulo (Protocol 14/2010).
Swimming physical training
The animals were submitted to PT as described in detail by Evangelista and colleagues [20]. Briefly, PT consisted of two sessions of 1.5 h daily swimming, 5 days/wk, for 4 wk, without addition of workload. The swimming sessions started at 20 min and were progressively increased by 10 min per day until reaching 1.5 h. This protocol was efficient to promote aerobic adaptations such as resting bradycardia, cardiac hypertrophy and increased skeletal muscle oxidative capacity [20]. In order to minimize the influence of water stress, sedentary mice were placed in the swimming apparatus for 5 min two times a week during the experimental protocol.
Food intake and body weight
24 h food intake was determined weekly throughout the study in mice that were group-housed (4 animals per cage). Body weight was measured weekly at the same time of day using a digital balance (Gehaka, Model BK4001, Brazil). Body weight gain was calculated as the difference between body weight measured at the beginning and at the end of the experimental protocol.
Metabolic measurements
At the end of the physical training period, indirect calorimetry (AMETEK, Pittsburgh, PA, USA) after overnight fasting (8 h) was used to evaluate resting oxygen uptake. The lowest amount of oxygen consumption observed for 30 minutes was considered the rest value. For the calculation of oxygen consumption, we used the following formula: VO2 = (FiO2-FeO2) × 1165/weight, where: FiO2 = oxygen inspired fraction, FeO2 = oxygen expired fraction; air pump flow = 1165 L.
Fasting-induced weight loss was measured by body weights determined before and after 16 hours of fasting. This measurement provides a simple approximation of energy expenditure because of the elimination of energy intake [21].
Resting blood pressure and heart rate measurements
Tail-cuff blood pressure (BP) and heart rate (HR) (estimated from the pulse rate) were determined after eight weeks of PT via the use of a computerized tail-cuff system (BP 2000 Visitech Systems). BP and HR values for each animal were determined by averaging 20 measurements obtained during their dark cycle.
Tissue and blood collection
Forty-eight hours after the end of the last training session (groups T4 and S4) or after 2 weeks of PD (groups T6 and S6), the animals were killed with an intraperitoneal injection of pentobarbital sodium (4 mg/100 g body weight). Visceral (periepididymal and retroperitoneal) fat pads, organs and skeletal muscle were harvested, weighed and stored at -80°C. The cava venous blood was collected and centrifuged at 4°C (10.000 g for 10 min) and serum was stored at -80°C.
Serum analysis
Insulin and leptin were quantified using mouse-specific radioimmunoassay (RIA) kits (Linco Research, Inc.). The insulin detection sensitivity was 0.02 ng/mL, the within-run variation was less than 5.8%, and the interassay CV was less than 10%. Assays were performed in duplicate using a sample volume of 50 μL. The leptin detection sensitivity was 0.2 ng/mL, the within-run variation was less than 4.6% and the interassay CV was less than 10%. Assays were performed in duplicate with a sample volume of 50 μL.
Adipocyte isolation
Visceral fat pads were minced with fine scissors, digested at 37°C in Earle’s salts, 25 mM 4-(2-hydroxyethyl)-1-piperazineethanesulfonic acid (HEPES), 4% bovine serum albumin (BSA), pH 7.4 (EHB buffer 1), containing collagenase type II (1.25 mg/mL, Sigma-Aldrich®, St. Louis, MO, USA), and the adipocytes were isolated according to Rodbell [22]. The isolated adipocytes were suspended in EHB buffer 2 (Earle’s salts, 20 mmol/L HEPES, 1% BSA, 2 mmol/L sodium pyruvate and 4.8 mmol/L NaHCO3), pH 7.4, at 37°C. The cells were photographed under an optical microscope (magnification, ×100), and the mean adipocyte diameters were determined by measuring 100 cells using Leica Quantimet 500 software. The cell volume was determined as previously described [23].
Lipolytic activity
Aliquots (40 μL) of adipocyte suspension in EHB buffer 2 were transferred to microfuge tubes (1.5 mL) containing 10 μL of adenosine (Sigma-Aldrich®, St. Louis, MO, USA, 1 μg/mL) and were incubated at 37°C for 30 min. Next, 20 μL of adenosine deaminase (Sigma-Aldrich®, St. Louis, MO, USA, 0.2 U/mL) was added, and the resulting samples were incubated at 37°C for 30 min. The samples were then incubated for 1 h at 37°C with or without the addition of 10 μL of isoproterenol 10-5 mol/L (Sigma-Aldrich®, St. Louis, MO, USA) in a final volume of 200 μL. At the end of incubation, the reaction was stopped by moving the tubes to a cold water bath followed by centrifugation at 10.000 × g for 10 min at 4°C. The infranatant incubation medium was transferred to microtubes and stored at -80°C. The glycerol content, measured using an enzymatic-colorimetric assay (Sigma-Aldrich®, St. Louis, MO, USA), was used as an index of lipolysis and was corrected to be expressed as nanomoles/106 cells/h.
Enzymatic assay
Fatty acid synthase (FAS) enzyme activity was determined in samples of visceral fat as described by Bazin and Ferré [24] with minor modifications. Briefly, a sample of fat (100 mg) was homogenized in extraction buffer (1:3 ratio) containing sucrose (250 mM), EDTA (1 mM), DTT (1 mM), leupeptin (50 μM) e aprotinin (5 μM), pH = 7.4. After the centrifugation, 20 μL of infranatant were used to determine FAS activity. Citrate synthase activity was determined as previously described by Alp and colleagues [25]. Briefly, a sample of soleus muscle was homogenized for 30 s at maximum speed (Polytron PT 3100, Switzerland) in 300 μL of extraction buffer (50 mM Tris HCl and 1 mM EDTA, pH 7.4) and centrifuged (3800 g, 15 min, 4°C). Citrate synthase (EC 4.1.3.7) activity was measured by incubating 15 μL of supernatant with assay buffer [100 mM Tris base, 0.2 mM 5, 5’ ditio-bis-(2-nitrobenzoic acid), 0.01% Triton X-100, 1 mg acetyl-CoA, pH 8.1]. The reaction was initiated with the addition of 10 μL of 0.5 mM oxaloacetic acid to a final volume of 300 μL, and analyzed spectrophotometrically (412 nm) at 25°C. Protein concentrations of the homogenates were measured by the BCA method with a protein assay kit (PIERCE Biotechnology, Rockford, IL, USA) using bovine serum albumin as a standard.
Statistical analyses
All values are expressed as means ± SE. The results of body weight were compared among groups using one-way analyses of variance (ANOVA) for repeated measurements. The others variables were compared using one-way ANOVA. The Bonferroni post hoc test was used to determine differences between means when a significant change was observed using ANOVA. A p value equal to or less than 0.05 was considered to be statistically significant (StatSoft®, Statistica v.10).
Results
Body weight and adiposity
Changes in body weight during PT and PD periods are shown in Figure 1. No differences in body weight were observed between S and T groups during the 1st, 2nd and 3rd weeks of PT. However, the T group showed lower body weight than the S group in the 4th week. After PD, no differences in body weight were observed between S6 and D groups (Figure 1). While S and S6 groups showed 4% and 3% in body weight gain during the PT and PD periods, the T group reduced 1.7% and D group increased 6.3%. These results revealed that 2 weeks of PD resulted in the fold increase of body weight in the D group compared with S6 group.
Figure 1.
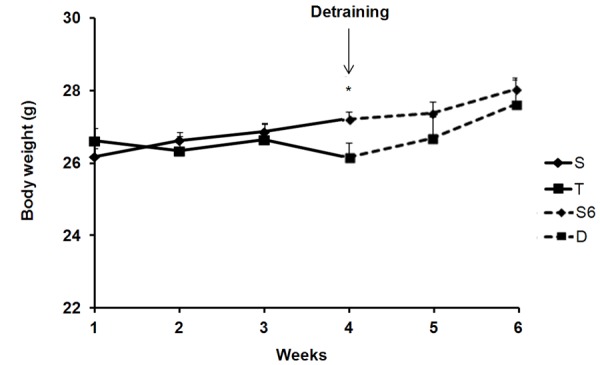
Body weight during the experimental protocol. S (Sedentary, n = 20) and T (Exercise-trained, n = 18) animals during PT period. At the end of PT, some of them were sacrificed and the remaining animals were detrained (D, n = 10) or kept sedentary (S6, n = 10) during two weeks. Data are presented as mean ± SE. *p<0.05 T vs. S.
T4 and D groups had lower periepididymal and retroperitoneal visceral fat pads weights compared with S4 and S6 groups. Furthermore, the S6 group showed a larger adipocyte diameter compared with S4 and T groups. The weights of skeletal muscles, lung, liver, kidney and spleen did not differ significantly among groups. However, the heart and the left ventricle were larger in the T4 group compared with S4 and S6, and in the D group compared with S6 (Table 1).
Table 1.
Weight of tissue and organs
| S4 | T4 | S6 | D | |
|---|---|---|---|---|
| Retroperitoneal fat pad (mg/g) | 7.58±0.9 | 3.35±0.6* | 7.52±0.5 | 4.50±0.9* |
| Periepididymal fat pad (mg/g) | 18.84±1.1 | 12.94±1.4* | 20.75±1.1 | 13.92±1.8* |
| Adipocyte diameter (μm) | 61.6±2.1# | 61.3±0.8# | 71.4±3.1 | 66.1±1.6 |
| Gastrocnemius muscle (mg/g) | 10.50±0.2 | 10.51±0.2 | 8.81±0.8 | 10.31±0.5 |
| Soleus muscle (mg/g) | 0.41±0.1 | 0.51±0.01 | 0.53±0.01 | 0.61±0.03 |
| Lungs (mg/g) | 6.38±0.1 | 6.13±0.7 | 6.44±0.3 | 6.48±0.2 |
| Liver (mg/g) | 43.91±1.1 | 46.27±2.0 | 43.54±0.9 | 41.93±0.7 |
| Kidneys (mg/g) | 13.07±0.3 | 10.26±1.3 | 9.47±0.8 | 10.82±0.3 |
| Adrenal glands (mg/g) | 0.38±0.08 | 0.25±0.06 | 0.13±0.03 | 0.24±0.02 |
| Heart (mg/g) | 4.28±0.1 | 5.15±0.2* | 4.08±0.1 | 4.51±0.1# |
| Left ventricle (mg/g) | 3.29±0.05 | 3.88±0.1* | 3.17±0.04 | 3.51±0.05# |
Data are presented as mean ± SE. S4 = sedentary (4 weeks); T4 = exercise-trained; S6 = sedentary (6 weeks); D = detrained. S4 and T4 were sacrificed at the end of PT; S6 and D were sacrificed two weeks later.
p<0.05 vs. S4 and S6;
p<0.05 vs. S6.
Energy balance
As shown in Table 2, the food intake in grams assessed over a 24-h period and the oxygen consumption at rest were higher in the T4 group compared with S4 and S6. The T4 group had higher fasting-induced weight loss compared with the S4 group. These metabolic responses were reversed after 2 weeks of PD in the D group compared with S6 group. In addition, insulin concentration did not differ among groups, however the groups T4 and D had lower serum leptin concentration compared with S4 and S6 groups.
Table 2.
Metabolic parameters
| S4 | T4 | S6 | D | |
|---|---|---|---|---|
| Food intake (g/animal/24 h) | 4.0±0.2 | 5.1±0.1* | 3.9±0.2 | 4.4±0.2 |
| Oxygen consumption (ml/kg/min) | 85.58±6.2 | 124.7±10.9* | 76.28±6.2 | 96.89±6.7 |
| Fasting-induced weight loss (g) | 0.89±0.1 | 2.0±0.1# | 1.72±0.2 | 1.76±0.1 |
| Insulin (ng/mL) | 0.59±0.1 | 0.48±0.1 | 0.65±0.2 | 0.53±0.1 |
| Leptin (ng/mL) | 9.40±1.4 | 4.32±0.2* | 7.71±0.9 | 3.68±0.2* |
Data are presented as mean ± SE. S4 = sedentary (4 weeks); T4 = exercise-trained; S6 = sedentary (6 weeks); D = detrained. S4 and T4 were sacrificed at the end of PT; S6 and D were sacrificed two weeks later.
p<0.05 vs. S4 and S6;
p<0.001 vs. S4.
WAT metabolism
No difference in basal lipolysis was found among groups (Figure 2). Adipocytes from T4 group (14528.8±2291.3 mmol/106 cells) presented a higher rate of lipolysis stimulated by isoproterenol and measured by glycerol release compared with S4 (7135.9±1133.9 mmol/106 cells), S6 (7937.2±795.8 mmol/106 cells) and D (4828.5±478.7 mmol/106 cells) groups (Figure 2). In addition, the activity of FAS, which is a key enzyme of lipogenesis, did not differ among groups (Figure 3).
Figure 2.
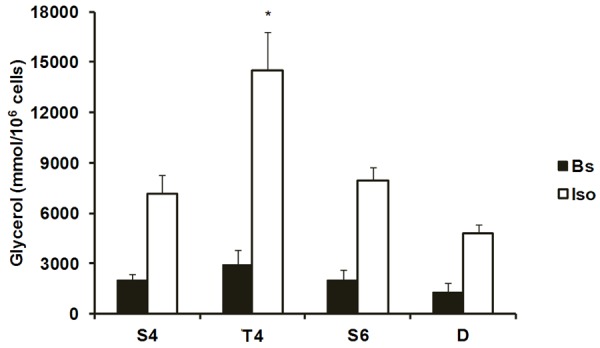
Lipolysis rates in the absence (basal) and presence of isoproterenol (10-5 M) in adipocytes isolated from white adipose tissue. Data are presented as mean ± SE. Bs = basal; Iso = isoproterenol. S4 = sedentary (4 weeks); T4 = exercise-trained; S6 = sedentary (6 weeks); D = detrained. S4 and T4 were sacrificed at the end of PT; S6 and D were sacrificed two weeks later. *p<0.05 vs. S4, S6 and D (Iso).
Figure 3.
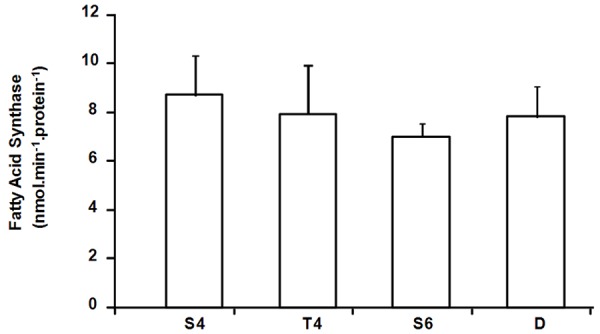
Fatty acid synthase enzyme activity in the white adipose tissue. Data are presented as mean ± SE. S4 = sedentary (4 weeks); T4 = exercise-trained; S6 = sedentary (6 weeks); D = detrained. S4 and T4 were sacrificed at the end of PT; S6 and D were sacrificed two weeks later.
Markers of PT
As showed in Figure 4, the T4 group had a higher citrate synthase activity compared with other groups. This typical aerobic adaptation induced by PT was reversed by PD because no difference was observed in D group compared with S6 group. On the other hand, the reduction in resting heart rate showed by T4 compared with S4 group was maintained after the PD period because the group D also showed a lower resting heart rate compared with S6 group (Figure 5A). Baseline blood pressure remained unchanged among the groups during the PT and the PD periods (Figure 5B).
Figure 4.
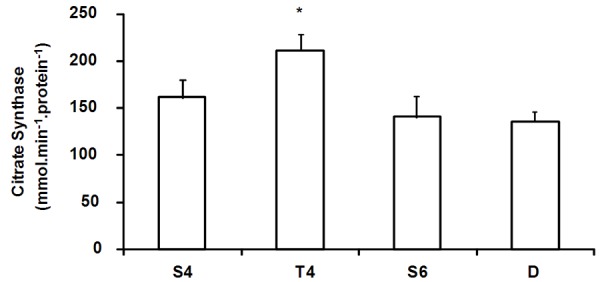
Citrate synthase enzyme activity in the skeletal muscle. Data are presented as mean ± SE. S4 = sedentary (4 weeks); T4 = exercise-trained; S6 = sedentary (6 weeks); D = detrained. S4 and T4 were sacrificed at the end of PT; S6 and D were sacrificed two weeks later. *p<0.05 vs. S4, S6 and D.
Figure 5.

Resting arterial blood pressure and heart rate. Data are presented as mean ± SE. S4 = sedentary (4 weeks); T4 = exercise-trained; S6 = sedentary (6 weeks); D = detrained. S4 and T4 were sacrificed at the end of PT; S6 and D were sacrificed two weeks later. *p<0.05 vs. S4; #p<0.05 vs. S6.
Discussion
In the present study we investigated the effect of two weeks of PD on energy balance components, BW and adiposity, and our findings provide evidence that PD reduced food intake, resting energy metabolism, and WAT lipolytic activity, but did not change WAT lipogenic activity. These changes are responsible for remodeling of BW, but not adiposity. Our findings show that PT is effective at maintaining body weight as observed in the T group, which confirm the potential of PT to control BW [6,7]. However, we did not observe difference in BW between S6 and D groups, revealing that BW gain was reversed after two weeks of PD. These data are in accordance with other studies which show an association between PD and greater BW gain [9,13], which may increase the susceptibility to the development of obesity.
Although there was lower BW gain in T group compared with S group, and a loss of BW gain control in D group after PD, the weight of fat pads in both T4 and D groups were reduced compared with S4 and S6 groups. These data was not accompanied by changes in tissue and organ weights, except the greater heart and left ventricle weights observed in T4 group compared with S4 and S6, and in D group compared with the S6 group. The impact of PD on the WAT mass may be due to the PD period used in this study and also to differences in experimental models and protocols of PT. Indeed, Despres and colleagues [26] showed that 50 days of PD increases body fat percentage, but this effect is not observed by Michelin and colleagues [27] after 30 days of PD. Sertie and colleagues [13] observed a significant increase in fat mass in rats trained on a treadmill and subjected to a longer period of PD (4 weeks). Furthermore, they showed that one of the mechanisms responsible for increase fat mass after PD is greater lipogenic activity in the WAT identified through the increased activity of FAS and malic enzymes. In our study, we observed no changes in the activity of the enzyme FAS in group D, which confirms the values held in fat mass after PD.
Changes in body weight are directly associated with energy balance, and therefore, the components of energy balance were evaluated in the present study. Food intake was significantly higher in the T4 group during the PT period, indicating that an increased caloric intake is associated with PT [7,28]. Furthermore, the resting energy metabolism assessed by oxygen uptake and by body weight loss after fasting was significantly higher in T4 group compared with S4 group. Although some determinants of daily energy expenditure were not evaluated in this study, such as energy expenditure during physical training and the thermogenic effect of food, and that the assessment of resting energy metabolism refers only to a period of 24 h, our results indicate that the lower body weight and fat mass in trained mice may be due to daily energy expenditure higher than calorie intake. Interestingly, when PT increases caloric intake but does not change energy metabolism at rest, we observe higher body weight gain in trained group compared to sedentary, but fat mass does not differ [7].
Detrained group showed reversal of the responses of food intake and resting energy metabolism since both variables did not differ between groups D and S6. Arciero and colleagues [29] observed decreases in resting metabolic rate after 7-10 days of PD, however, our study showed for the first time that the reduction of food intake during detraining may be important for the maintenance WAT mass, at least during the two weeks of PD. This answer might be different if the period of PD was longer and/or the caloric intake was not reduced to compensate the lower daily energy expenditure.
Changes in adiposity result from the balance between lipogenic and lipolytic activities of the WAT. Previous studies show that PT increases lipolytic activity, which is critical for reducing adiposity and increasing the availability of fatty acids for oxidation during PT [4,30]. In the present study, PT induced marked increase in lipolytic activity in the T4 group. However, we did not observe differences in the D group compared to S4 and S6 groups, revealing that PD induced loss of lipolytic activity of WAT. Recently it was demonstrated that 4 weeks of PD does not change the lipolytic activity of WAT in rats [13], however, differences in the experimental model, in the period of PD and in the size of adipocytes may explain the contradictory results.
The amount of adiposity is directly associated with the modulation of adipokinesecretion, including leptin [31]. In the present study, the lower concentration of serum leptin was observed in T4 and D groups in accordance with the reduced weight of WAT in both groups. Reductions in leptin concentrations after PT were observed in other studies [13,32], and considering that hyperleptinemia is associated with the development of leptin resistance [33], the effect of PT is important to maintain the ability of leptin to control energy metabolism and glycemic homeostasis. On the other hand, the concentration of serum insulin did not differ among groups, suggesting that body weight changes in larger magnitudes are necessary to reflect changes in insulin secretion. In this case, the use of obese or diabetic animals subjected to PT or a longer period of PD to induce higher adiposity could alter insulin levels.
The effect of PD on energy metabolism in this study is strengthened by the observation of the reversal of the enzyme citrate synthase in skeletal muscle, which has been widely used as a marker of the aerobic PT efficiency. Our data corroborate previous studies that demonstrate that PT increases the activity of citrate synthase [6,7] and that the PD induces loss of this response [13,34]. Another marker of aerobic PT is resting bradycardia, which was showed by the T4 group. This response was maintained in the D group after the period of PD, as well as cardiac hypertrophy assessed by heart and left ventricle weights. The arterial blood pressure did not change after PT and PD. These results may suggest that the metabolic reversal is earlier than the reversal of cardiovascular adaptations. In a previous study conducted by our group in rats, the peak of oxygen consumption decreases significantly after 1 week of PD, while resting bradycardia reverses only after 2 weeks of PD [12]. Importantly, the differences in the experimental models, type of exercise and PT period between studies may explain the differences in the time course of the loss of adaptations induced by PD.
Collectively, the present study provides evidence that despite higher food intake, PT increased daily energy expenditure and WAT lipolytic activity, which were responsible for a reduction in body weight and adiposity. However, two weeks of PD reversed the components of energy balance by reducing food intake and resting energy metabolism, and impairing WAT lipolytic activity, but not lipogenic activity. These changes resulted in remodeling of BW, but not adiposity.
Acknowledgements
We thank Prof. José E. Krieger for providing laboratory support. This study was supported by Grant from The São Paulo Research Foundation (FAPESP) to F.S. Evangelista (# 2009/52904-5). F. Mazzucatto held a scholarship from Conselho Nacional de Pesquisa e Desenvolvimento, Brazil (CNPq, PIBIC). We also thank Dr. Laura Szymanski for the thorough checking of the English in this manuscript.
Disclosure of conflict of interest
None.
References
- 1.Iglesias Bolaños P, Olivar Roldán J, Peñalver Tavalera D, Irving BA, Davis CK, Brock DW, Weltman JY, Swift D, Barret EJ, Gaesser GA, Weltman A. Effect of exercise training intensity on abdominal visceral fat and body composition. Med Sci Sports Exerc. 2008;40:1863–72. doi: 10.1249/MSS.0b013e3181801d40. [DOI] [PMC free article] [PubMed] [Google Scholar]
- 2.Swift DL, Johannsen NM, Lavie CJ, Earnest CP, Church TS. The Role of Exercise and Physical Activity in Weight Loss and Maintenance. Prog Cardiovasc Dis. 2014;56:441–7. doi: 10.1016/j.pcad.2013.09.012. [DOI] [PMC free article] [PubMed] [Google Scholar]
- 3.Higa TS, Spinola AV, Fonseca-Alaniz MH, Evangelista FS. Remodeling of white adipose tissue metabolism by physical training prevents insulin resistance. Life Sci. 2014;103:41–48. doi: 10.1016/j.lfs.2014.02.039. [DOI] [PubMed] [Google Scholar]
- 4.Lima-Silva AE, Adami F, Nakamura FY, De Oliveira FR, Gevaerd MS. Muscle glycogen metabolism during exercise: mechanism of regulation. Braz J Kinanthropom Hum Performance. 2006;4:106–114. [Google Scholar]
- 5.Holloway GP, Bezaire V, Heigenhauser GJF, Tandon NN, Glatz JFC, Luiken JJFP, Bonen A, Spriett LL. Mitochondrial long chain fatty acid oxidation, fatty acid translocase/CD36 content and carnitine palmitoyltransferase I activity in human skeletal muscle during aerobic exercise. J Physiol. 2006;571:201–10. doi: 10.1113/jphysiol.2005.102178. [DOI] [PMC free article] [PubMed] [Google Scholar]
- 6.Evangelista FS, Krieger JE. Small gene effect and exercise-training induced cardiac hypertrophy in mice: an ACE gene dosage study. Physiol Genomics. 2006;27:231–6. doi: 10.1152/physiolgenomics.00022.2006. [DOI] [PubMed] [Google Scholar]
- 7.Higa TS, Bergamo FC, Mazzucatto F, Fonseca-Alaniz MH, Evangelista FS. Physical training prevents body weight gain but does not modify adipose tissue gene expression. Brazi J Med Biol Res. 2012;45:988–994. doi: 10.1590/S0100-879X2012007500097. [DOI] [PMC free article] [PubMed] [Google Scholar]
- 8.Ljubicic V, Joseph AM, Sallem A, Uguccioni G, Collu-Marchese M, Lai RYJ, Nguyen LM, Hood DA. Transcriptional and post-transcriptional regulation of mitochondrial biogenes in skeletal muscle: Effects of exercise and aging. Biochim Biophys Acta. 2010;1800:223–34. doi: 10.1016/j.bbagen.2009.07.031. [DOI] [PubMed] [Google Scholar]
- 9.García-Pallarés J, Sánchez-Medina L, Pérez CE, Izquierdo M. Physiological effects of tapering and detraining in world-class kayakers. Med Sci Sports Exerc. 2010;42:1209–14. doi: 10.1249/MSS.0b013e3181c9228c. [DOI] [PubMed] [Google Scholar]
- 10.Shah A, Mehta N, Reilly MP. Adipose inflammation, insulin resistance, and cardiovascular disease. J Parenter Enteral Nutr. 2008;32:638–44. doi: 10.1177/0148607108325251. [DOI] [PMC free article] [PubMed] [Google Scholar]
- 11.Booth FW, Laye MJ, Lees SJ, Rector RS, Thyfault JP. Reduced physical activity and risk of chronic disease: the biology behind the consequences. Eur J Appl Physiol. 2008;102:381–90. doi: 10.1007/s00421-007-0606-5. [DOI] [PubMed] [Google Scholar]
- 12.Evangelista FS, Martuchi SED, Negrão CE, Brum PC. Loss of resting bradycardia with detraining is associated with intrinsic heart rate changes. Braz J Med Biol Res. 2005;38:1141–6. doi: 10.1590/s0100-879x2005000700018. [DOI] [PubMed] [Google Scholar]
- 13.Sertie RA, Andreotti S, Proença AR, Campana AB, Lima-Salgado TM, Batista ML Jr, Seelaender MC, Curi R, Oliveira AC, Lima FB. Cessation of physical exercise changes metabolism and modifies the adipocyte cellularity of the periepididymal white adipose tissue in rats. J Appl Physiol. 2013;115:394–402. doi: 10.1152/japplphysiol.01272.2012. [DOI] [PubMed] [Google Scholar]
- 14.Laye MJ, Rector RS, Borengasser SJ, Naples SP, Uptergrove GM, Ibdah JA, Booth FW, Thyfault JP. Cessation of daily wheel running differentially alters fat oxidation capacity in liver, muscle, and adipose tissue. J Appl Physiol. 2009;106:161–8. doi: 10.1152/japplphysiol.91186.2008. [DOI] [PMC free article] [PubMed] [Google Scholar]
- 15.Chen SY, Chen SM, Chang WH, Lai CH, Chen MC, Chou CH, Cuo CH. Effect of 2-month detraining on body composition and insulin sensitivity in young female dancers. Int J Obes. 2006;30:40–4. doi: 10.1038/sj.ijo.0803073. [DOI] [PubMed] [Google Scholar]
- 16.Yasari S, Dufresne E, Prud`Homme D, Lavoie JM. Effect of the detraining status on high-fat diet induced fat accumulation in the adipose tissue and liver in female rats. Physiol Behav. 2007;91:281–9. doi: 10.1016/j.physbeh.2007.03.012. [DOI] [PubMed] [Google Scholar]
- 17.Laye MJ, Thyfault JP, Stump CS, Booth FW. Inactivity induces increases in abdominal fat. J Appl Physiol. 2007;102:1308–9. doi: 10.1152/japplphysiol.01018.2006. [DOI] [PubMed] [Google Scholar]
- 18.Hunter GR, Brock DW, Byrne NM, Chandler-Laney PC, Del CP, Gower BA. Exercise training prevents regain of visceral fat for 1 year following weight loss. Obesity. 2010;18:690–695. doi: 10.1038/oby.2009.316. [DOI] [PMC free article] [PubMed] [Google Scholar]
- 19.Artham SM, Lavie CJ, Milani RV, Ventura HO. Value of weight reduction in patients with cardiovascular disease. Curr Treat Options Cardiovasc Med. 2010;12:21–35. doi: 10.1007/s11936-009-0056-y. [DOI] [PubMed] [Google Scholar]
- 20.Evangelista FS, Brum PC, Krieger JE. Duration-controlled swimming exercise training induces cardiac hypertrophy in mice. Braz J Med Biol Res. 2003;36:1751–1759. doi: 10.1590/s0100-879x2003001200018. [DOI] [PubMed] [Google Scholar]
- 21.Harada K, Shen WJ, Patel S, Natu V, Wang J, Osuga J, Ishibashi S, Kraemer FB. Resistance to high-fat diet-induced obesity and altered expression of adipose-specific genes in HSL-deficient mice. Am J Physiol Endocrinol Metab. 2003;285:E1182–1195. doi: 10.1152/ajpendo.00259.2003. [DOI] [PubMed] [Google Scholar]
- 22.Rodbell M. Metabolism of isolated fat cells. i. effects of hormones on glucose metabolism and lipolysis. J Biol Chem. 1964;239:375–80. [PubMed] [Google Scholar]
- 23.Di Girolamo M, Mendlinger S, Fertig JW. A simple method to determine fat cell size and number in four mammalian species. Am J Physiol. 1971;221:850–858. doi: 10.1152/ajplegacy.1971.221.3.850. [DOI] [PubMed] [Google Scholar]
- 24.Bazin R, Ferré P. Assays of lipogenic enzymes. Methods Mole Biol. 2001;155:121–127. doi: 10.1385/1-59259-231-7:121. [DOI] [PubMed] [Google Scholar]
- 25.Alp PR, Newsholme EA, Zammit VA. Activities of citrate synthase and NAD+-linked and NADP+-linked isocitrate dehydrogenase in muscle from vertebrates and invertebrates. Biochem J. 1976;154:689–700. doi: 10.1042/bj1540689. [DOI] [PMC free article] [PubMed] [Google Scholar]
- 26.Després JP, Bouchard C, Savard R, Tremblay A, Marcotte M, Thériault G. Effects of exercise-training and detraining on fat cell lipolysis in men and woman. Eur J Appl Physiol Occup Physiol. 1984;53:25–30. doi: 10.1007/BF00964685. [DOI] [PubMed] [Google Scholar]
- 27.Michelin E, Faria Coelho C, Burini RC. Effects of one month detraining over health-related physical fitness in a lifestyle change program. Braz J Sports Med. 2008;14:192–6. [Google Scholar]
- 28.Eguchi R, Cheik NC, Oyama LM, do Nascimento CMO, Mello MT, Tufik S, Dâmaso AR. Effects of the chronic exercise on the circulating concentration of leptin and ghrelin in rats with diet-induced obesity. Braz J Sports Med. 2007;14:182–187. [Google Scholar]
- 29.Arciero PJ, Smith DL, Calles-Escandon J. Effects of short-term inactivity on glucose tolerance, energy expenditure, and blood flow in trained subjects. J Appl Physiol. 1998;84:1365–73. doi: 10.1152/jappl.1998.84.4.1365. [DOI] [PubMed] [Google Scholar]
- 30.De Glisezinski I, Larrouy D, Bajzova M, Koppo K, Polak J, Berlan M, Bulow J, Langin D, Marques MA, Crampes F, Lafontan M, Stich V. Adrenaline but not noradrenaline is a determinant of exercise-induced lipid mobilization in human subcutaneous adipose tissue. J Physiol. 2009;587:3393–3404. doi: 10.1113/jphysiol.2009.168906. [DOI] [PMC free article] [PubMed] [Google Scholar]
- 31.Fonseca-Alaniz MH, Takada J, Alonso-Vale MIC, Bessa Lima F. The adipose tissue as a regulatory center of the metabolism. Braz Arch Endocrinol Metabol. 2006;50:216–29. doi: 10.1590/s0004-27302006000200008. [DOI] [PubMed] [Google Scholar]
- 32.Miyazaki S, Izawa T, Ogasawara JE, Sakurai T, Nomura S, Kizaki T, Ohno H, Komabayashi T. Effect of exercise training on adipocyte-size-dependent expression of leptin and adiponectin. Life Sci. 2010;86:691–698. doi: 10.1016/j.lfs.2010.03.004. [DOI] [PubMed] [Google Scholar]
- 33.Sahin-Efe A, Katsikeris F, Mantzoros CS. Advances in adipokines. Metabolism. 2012;61:1659–1665. doi: 10.1016/j.metabol.2012.09.001. [DOI] [PubMed] [Google Scholar]
- 34.Evangelista FS, Brum PC. Effects of physical detraining on athlete performance: a review about skeletal muscle and cardiovascular changes. Paulista J Phys Education. 1999;13:239–49. [Google Scholar]