Abstract
Purpose
Determining the culprit allergen is important for the diagnosis and management of allergic diseases. The skin prick test (SPT) has been widely used to identify culprit allergens. Skin reactivity to allergens has changed due to changes in lifestyle and outdoor environments. Therefore, the aim of the present paper was to examine changes in allergen sensitization in Korea.
Methods
We enrolled 1,135 patients with respiratory allergic diseases who were diagnosed at Severance Hospital from January 2010 to December 2011. SPTs were performed with inhalant allergens, and were compared to our previous studies of the SPTs in the 1980s and the 1990s.
Results
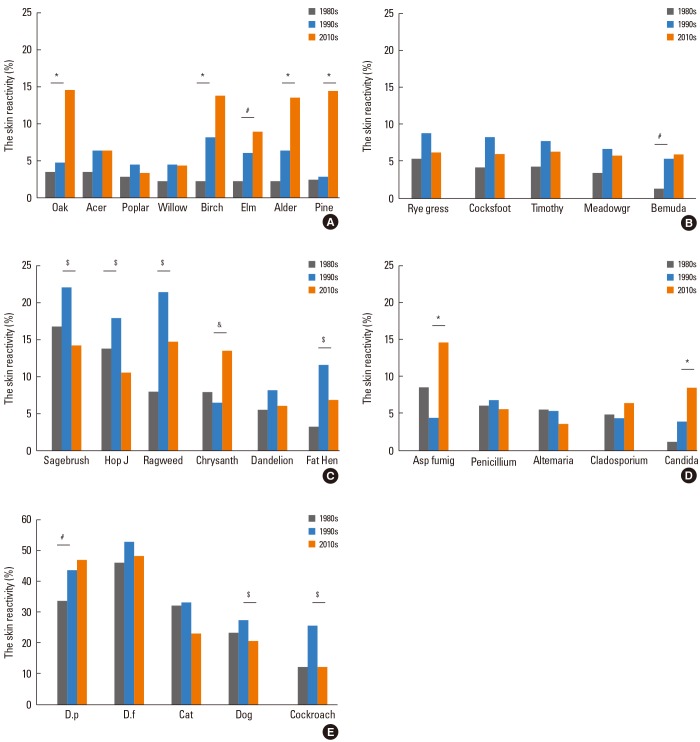
In the 2010s, the SPT positive rate of allergic rhinitis or allergic conjunctivitis was higher than asthma without allergic rhinitis or allergic conjunctivitis. The SPT positive rate was decreased by increments of age (P value <0.01). Skin reactivity to tree pollens was significantly increased to 36.4% in the 2010s from 19.0% in the 1990s and 8.8% in the 1980s. Among tree pollens, skin reactivity to oak (4.7%->14.4%), birch (7.1%->13.6%), alder (6.3%->13.4%) and pine (2.9%->14.3%) was significantly increased in the 2010s compared with the 1990s, respectively. Current skin reactivity to grass pollens (13.9%) and weed pollens (27.0%) has significantly decreased since the 1990s (20.3%, 40.9%, respectively). Skin reactivity to house dust mites showed no difference between the 1990s (55.2%) and the 2010s (55.6%). Skin reactivity to dog (27.3%->20.7%) and cockroach (25.3%->12.3%) have significantly decreased in the 2010s in comparison with the 1990s.
Conclusions
In light of the above results, we revealed the changes in skin reactivity to inhalant allergens that have occurred in Korean allergic patients over the past three decades. Since outdoor environmental factors such as the amount of pollen, global warming and plant distribution causes the changes in skin reactivity, further study and continuous close observation will be needed.
Keywords: Change, allergen, skin test, Korea
INTRODUCTION
Allergic diseases, such as bronchial asthma, allergic rhinitis, and allergic conjunctivitis, have received attention due to their globally increasing prevalence, including in Korea.1,2,3,4,5,6 The recent rapid increase in prevalence is caused by lifestyle and cultural, economic, ecological and other factors.7,8,9,10 The economic burden of allergic diseases is also considerable.11 Therefore, early and accurate diagnosis is important for appropriate management of allergic diseases.
Finding the culprit allergen is crucial for the diagnosis and management of allergic diseases. The skin prick test (SPT) for allergens has been widely used to determine sensitization to allergens. Sensitization to allergens is affected by many complicated factors, such as genetics, age, exposure time, exposure amount to allergens, and environmental factors.12,13,14 Exposure opportunities to various allergens have been changing according to changes in environmental factors. Therefore, patterns of sensitization have been changing worldwide over time.12,15,16
Researching changes in allergen sensitization is important to predicting changes in allergic diseases' prevalence and distribution. Understanding changes in allergen sensitization might be helpful to the diagnosis, management and prevention of allergic diseases. The present study collected and organized data from subjects diagnosed with allergic diseases in the early 2010s and compared it with data from the 1980s and the 1990s to investigate changes in allergen sensitization in Korea.
MATERIALS AND METHODS
Participants
The present study enrolled 1,135 patients with respiratory allergic diseases who were diagnosed at Severance Hospital from January 2010 to December 2011. The inclusion criteria for respiratory allergic disease were allergic rhinitis, allergic conjunctivitis, bronchial asthma, and chronic idiopathic urticaria with respiratory allergic diseases. Allergic rhinitis and allergic conjunctivitis were diagnosed by the clinicians based on symptoms, physical examination results, and rhinoscopic findings. Bronchial asthma and COPD were diagnosed based on symptoms, physical examination (e.g., wheezing sound), and pulmonary function test results (increased 12% and 200 mL FEV1 after bronchodilator use, FEV1/FVC <0.7) according to the GINA guideline updated in 2010 and the GOLD guideline. Chronic urticaria was defined as transient hives and flares lasting over 6 weeks.
SPT
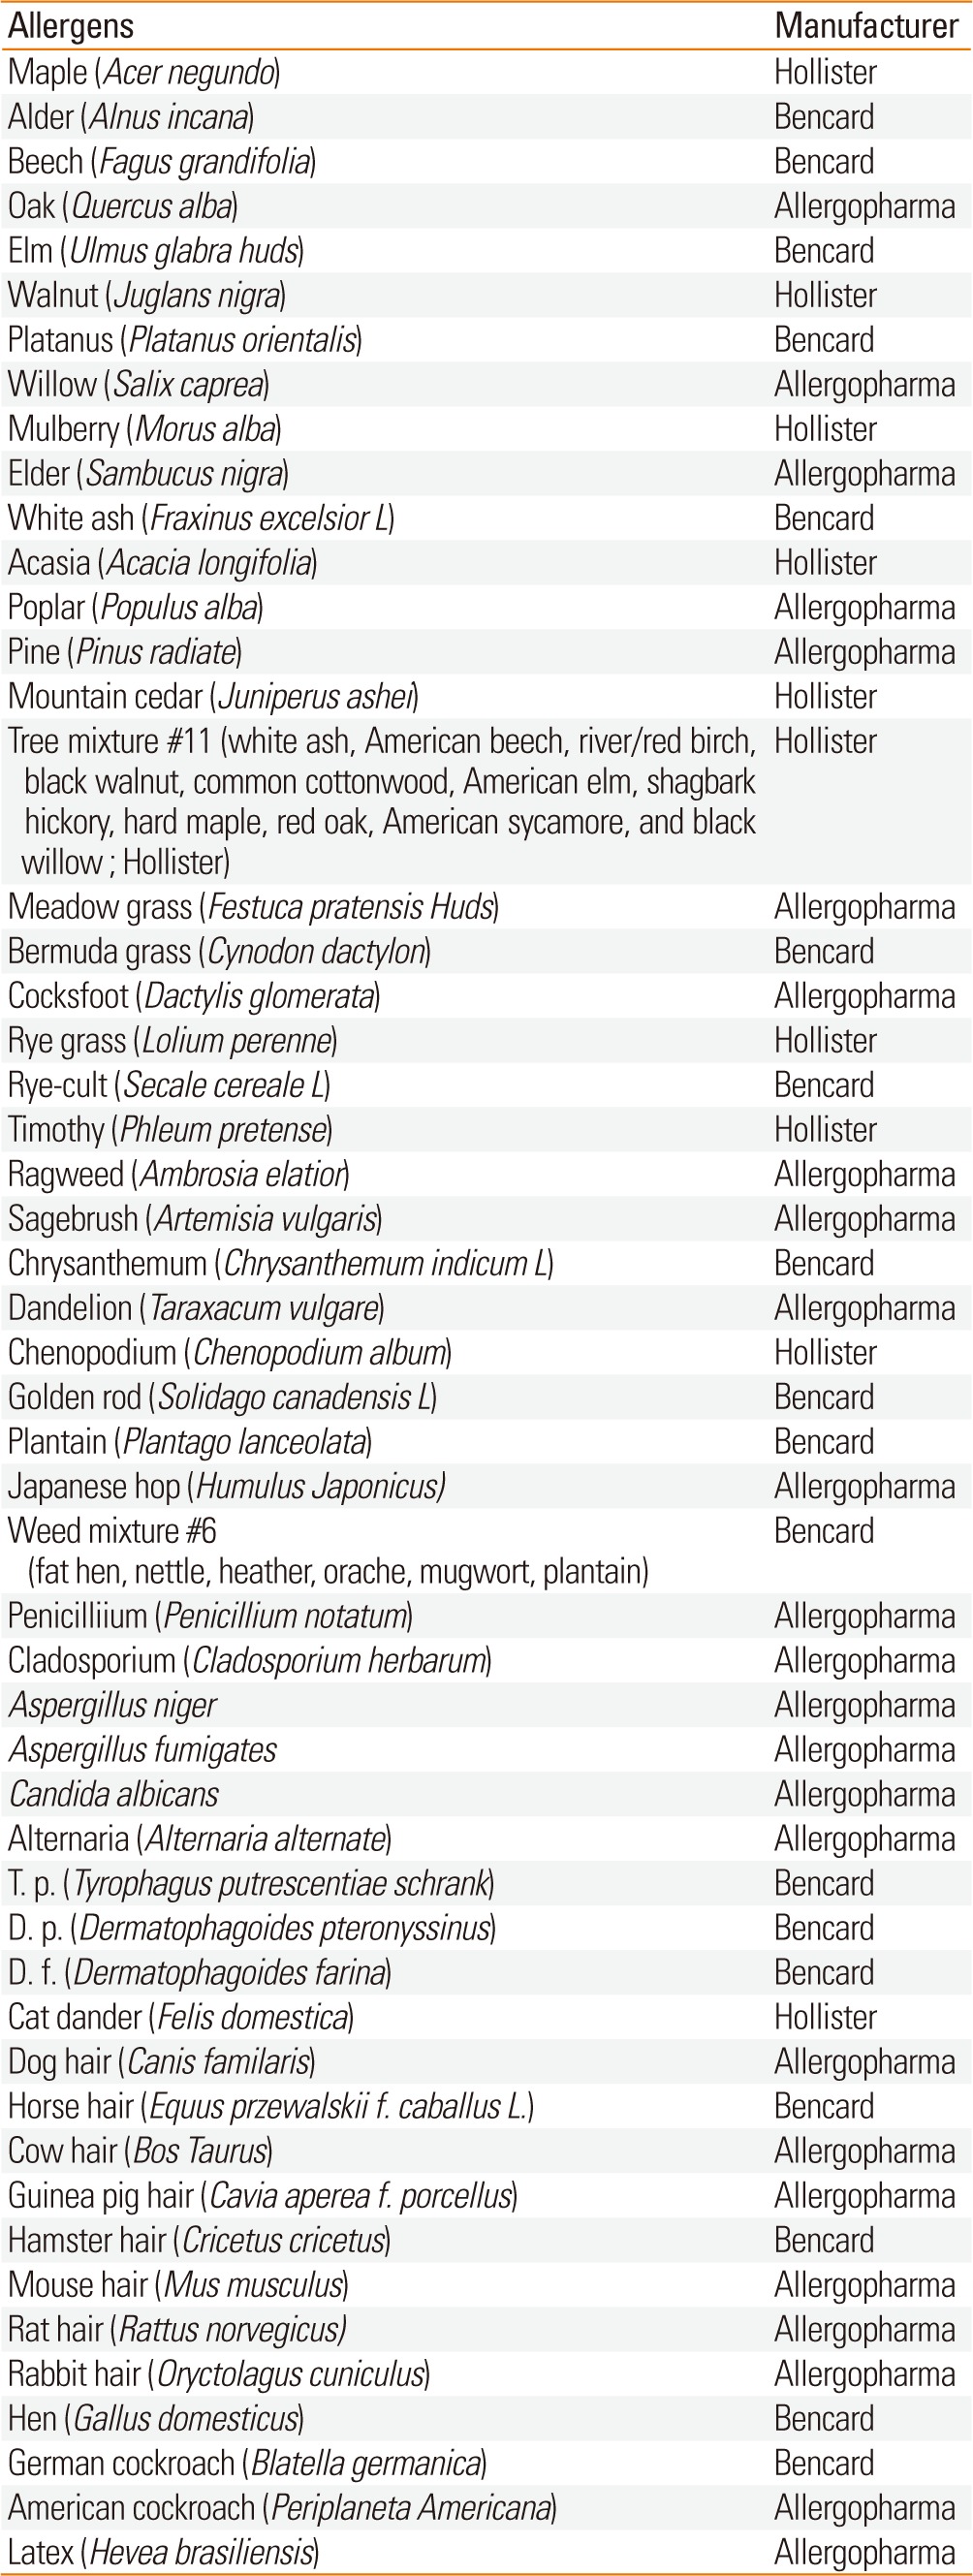
SPTs with 55 inhalant allergens were performed, including negative control (0.9% saline) and positive control (1% histamine). The allergens were produced in different institutes (Allergopharma, Reinbek, Germany; Hollister-Stier, Spokane, USA; Bencard, London, England). The 53 inhalant allergens used SPTs are listed in Table 1. Extracts of gingko (Gingko biloba L.) and pharaoh ant (Monomorium pharaonis) were manufactured according to a protocol which designed by our lab (Institute of Allergy, Yonsei University, Seoul, Korea) in previous studies.17,18 The most inhalant allergens which were used in previous studies in the 1980s and the 1990s were produced in Bencard. But some inhalant allergens were produced in Torri company which was no longer in existence. The results were read after 15 minutes. We defined the results according to the size of flare and the ratio of allergen wheal to histamine wheal.19 A "positive" on SPT was defined as a grade of 2+ or more. Atopy was defined as positive (≥2+) to at least 1 allergen.
Table 1.
Manufactured 53 allergens used in this study
Previous data
We reviewed our previous research regarding SPTs in the 1980s and the 1990s.
Data from the 1990s included 384 subjects with respiratory allergic diseases who were diagnosed at Severance Hospital from June 1992 to May 1994.20 Data from the 1980s included 500 subjects with respiratory allergic diseases who were diagnosed at the same institute from January 1984 to May 1987.21 We reviewed the results of SPTs and compared them with the current data.
Statistical analysis
All statistical analyses were performed using SPSS version 18.0 (SPSS Inc., Chicago, IL, USA). Comparison between the groups for each variable was assessed using the ANOVA and the Chi-square test. The correlation between the groups for variables was assessed using Pearson's test. A P value of less than 0.05 was set as the level of statistical significance.
RESULTS
Age and sex distribution
In the 2010s, a total of 1,135 subjects were enrolled, consisting of 492 (43.3%) males and 645 (56.7%) females. The mean age was 38.8 years. Three hundred and ninety nine patients were 30 years old or under (35.2%). Four hundred and nine (36.0%) and 327 (28.8%) patients were 31-50 and over 50 years old, respectively. There were no significant differences in the sex distribution or mean age among the study groups. However, there were significantly more young patients (≤30 years) in the 2010s compared with the 1980s (Table 2).
Table 2.
Age and sex distribution
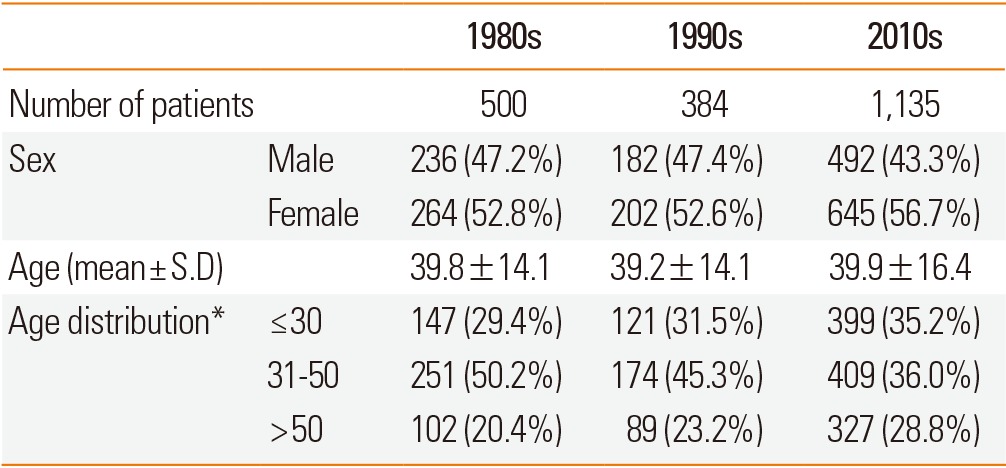
*P<00.05.
S.D, Standard Deviation.
Allergic diseases distribution
In the 2010s, the most common allergic disease was allergic rhinitis (27.5%). Patients in the bronchial asthma with COPD (chronic obstructive pulmonary disease) group were older than subjects in the other groups. Atopy rates of bronchial asthma with allergic conjunctivitis, allergic conjunctivitis, and allergic rhinitis were 93.8%, 88.2%, and 73.3%, respectively. The SPT positive rate for allergic rhinitis or allergic conjunctivitis was higher than for asthma without allergic rhinitis or allergic conjunctivitis (Table 3).
Table 3.
Allergic disease distribution
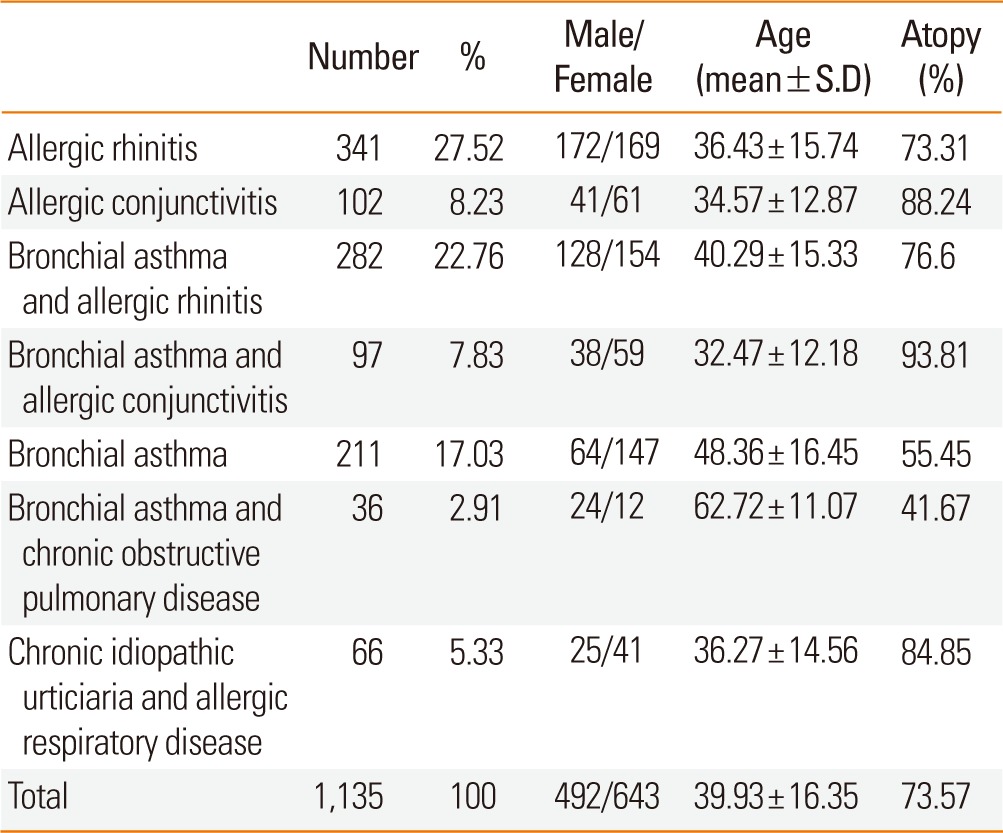
S.D, Standard Deviation.
The skin reactivity of allergen groups in the 2010s
The skin reactivity rates of tree, grass, and weed pollens were 34.1%, 14.1%, and 28.7%, respectively. Among tree pollens, the skin reactivity rates of alder, birch, oak, and pine were 13.4%, 13.6%, 14.4%, and 14.3%, respectively. Among weed pollens, the skin reactivity rates of ragweed, sagebrush, chrysanthemum, and Japanese hop were 15.2%, 14.8%, 13.9%, and 11.0%, respectively. The skin reactivity rates of molds, house dust mites, animal hair, and insects were 23.6%, 52.0%, 32.9%, and 15.6%, respectively. For animal hair, the skin reactivity rates of cat and dog were 23.0% and 20.7%. For insects, the skin reactivity rates of German cockroach, American cockroach, and pharaoh ant were 12.3%, 10.2%, and 19.7%, respectively (Table 4). Skin reactivity to allergen groups varied across allergic diseases (Fig. 1). The grades of skin reactivity varied according to allergens. The number of high grade of skin reactivity of alder, birch, sagebrush, chrysanthemum, golden rod, D. p, D. f and cat dander were higher than those of other allergens. Especially, allergens which showed ≥3+ reactivity in over half of SPT(+) cases were alder, birch, beech, oak, mountain cedar, meadow grass, cocksfoot, ryegrass, timothy, sagebrush, chrysanthemum, T. p, D. p, and D. f. On SPTs including acacia, pine, plantain, weak reactivity (≤2+) was significantly larger than that with strong reactivity (≥3+) although total skin reactivity rates were relatively high (Table 5).
Table 4.
The skin reactivity of allergens in the 2010s
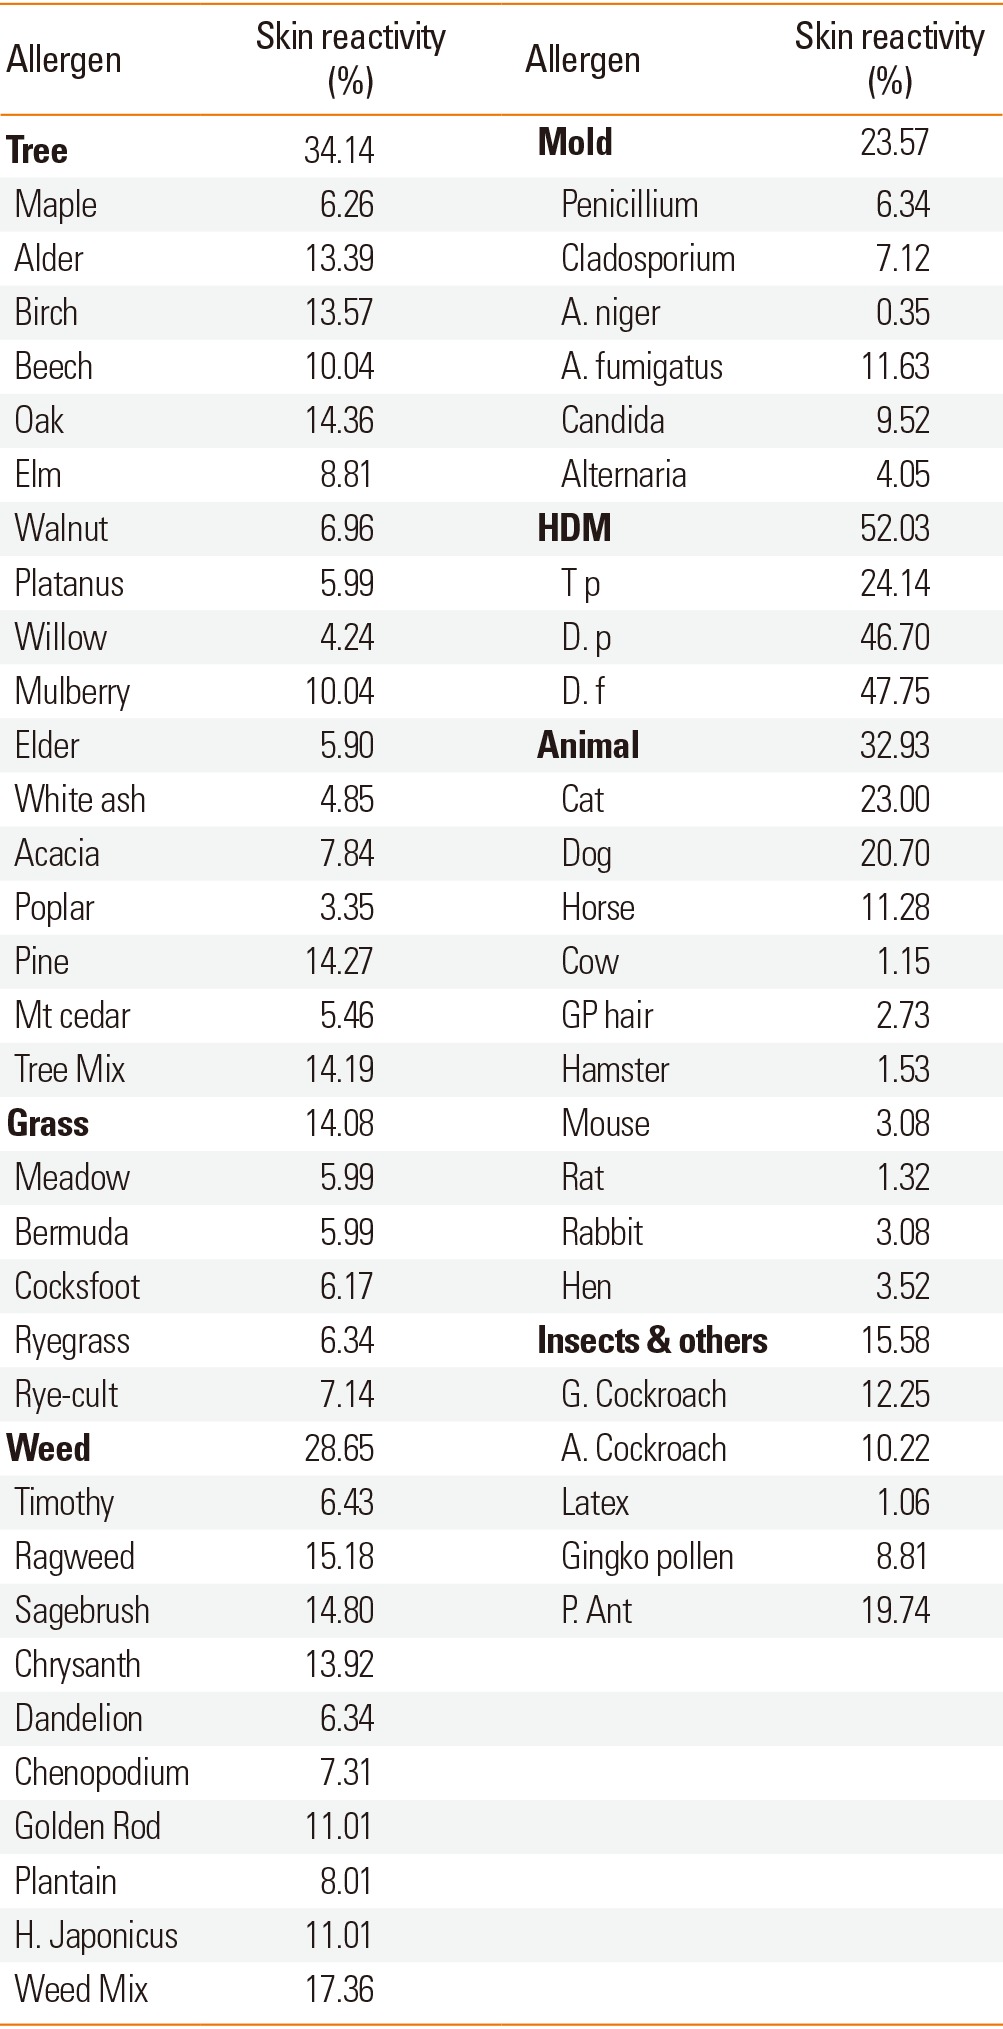
HDM, house dust mite; H. Japanese, Humulus japonicus; A. niger, Aspergillus niger; A. fumigates, Aspergillus fumigates; T p, Tyrophagus putrescentiae; D. p, Dermatophagoides pteronyssinus; D. f, Dermatophagoides farina; G. Cockroach, German Cockroach; A. Cockroach, American Cockroach; P. Ant, Pharaoh Ant.
Fig. 1.

Skin reactivity of allergen groups for each respiratory allergic disease in the 2010s.
Table 5.
Number of patients according to the grade of skin reactivity of allergens in the 2010s
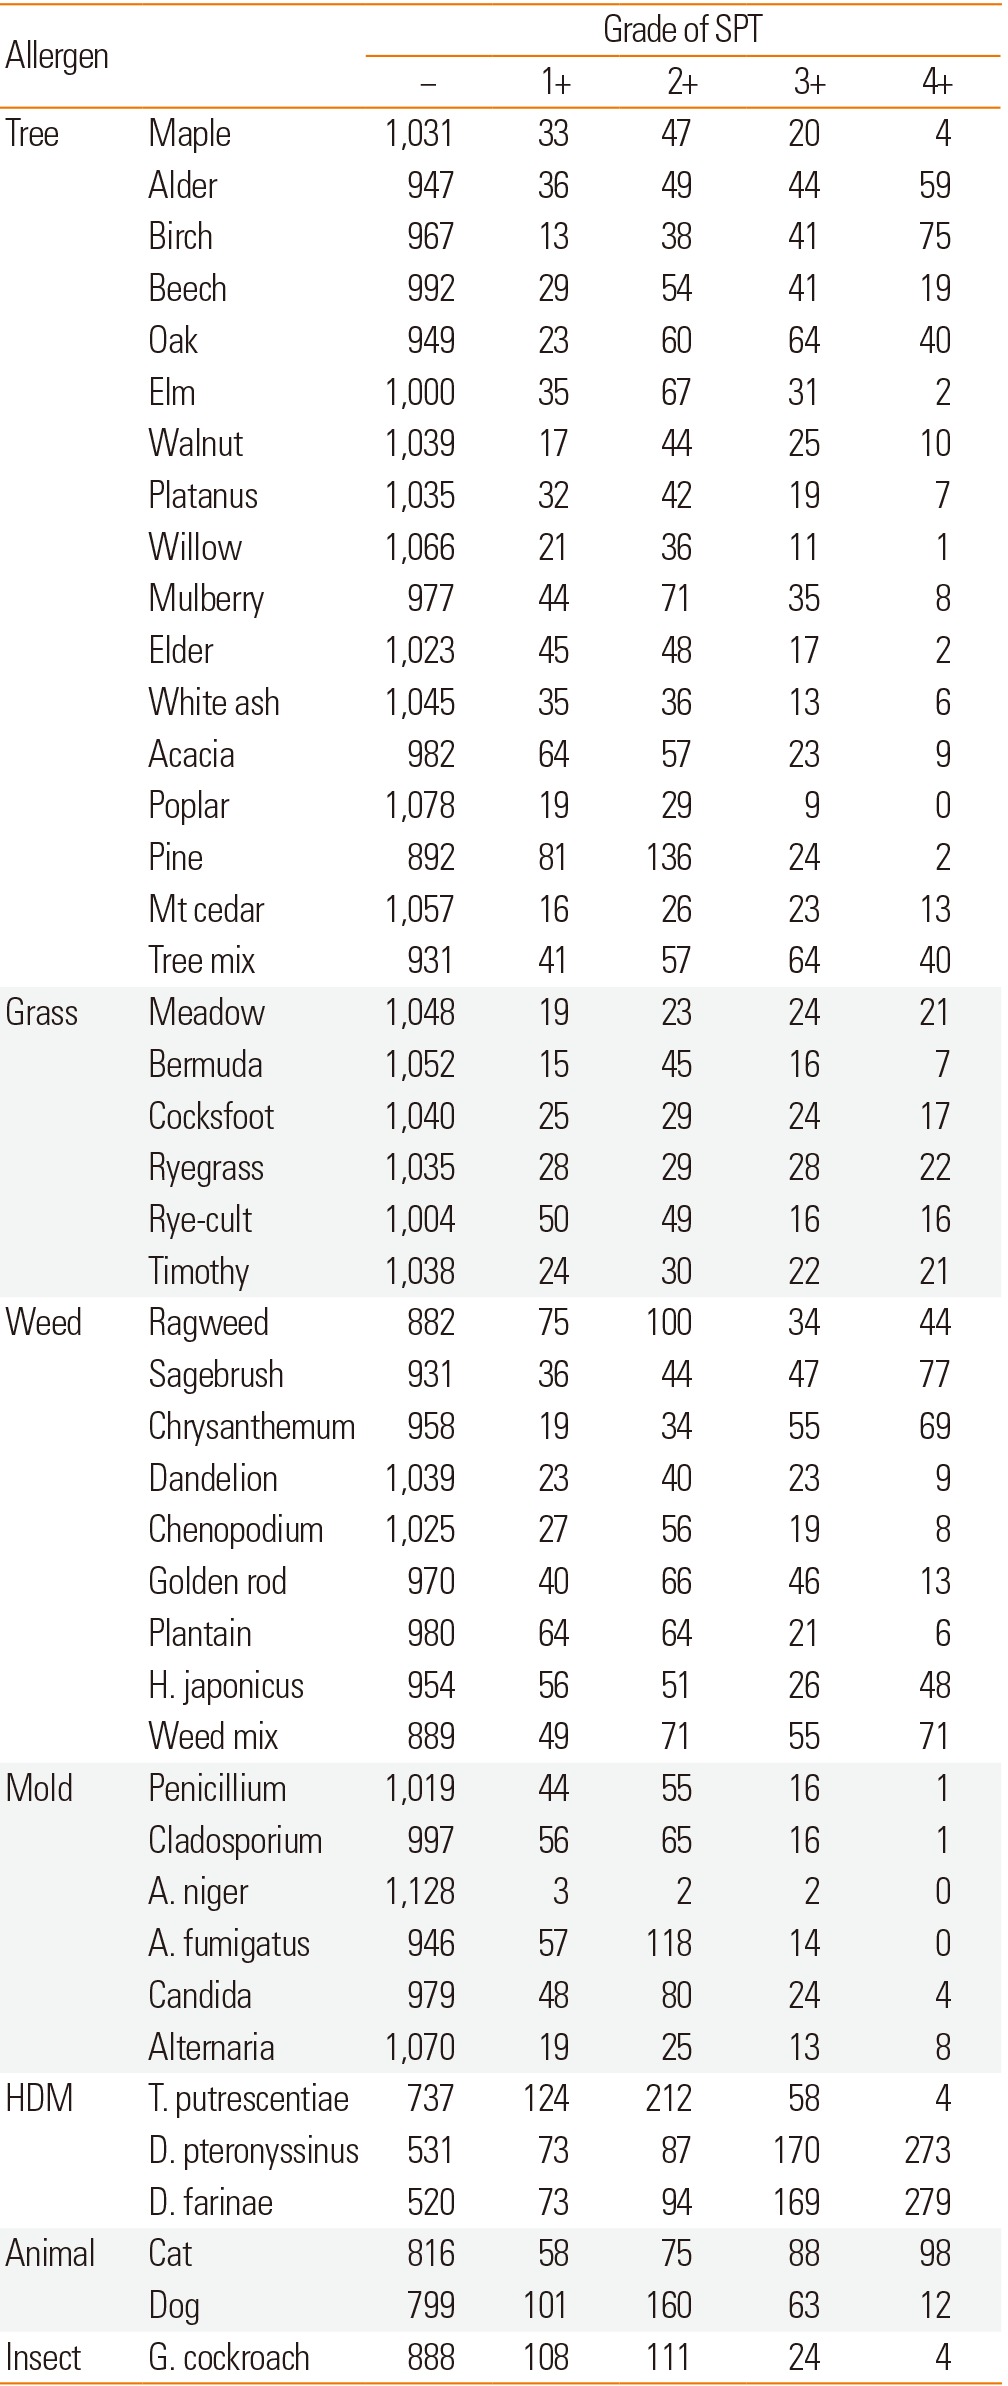
*Reactivity to allergen was determined by the CAP test.
Mt. cedar, Mountain cedar; H. japonicas, Humulus japonicas; A. niger, Aspergillus niger; A. fumigates, Aspergillus fumigates; T. pteronyssinus, Tyrophagus putrescentiae; D. pteronyssinus, Dermatophagoides pteronyssinus; D. farinae, Dermatophagoides farinae
Changes in skin reactivity according to age groups over the last 30 years
Skin reactivity to all allergens in the 2010s was decreased by increments of age (P value <0.01) (Fig. 2). We compared the skin reactivity of allergens according to ages between the 1990s and the 2010s. Although the skin reactivity rate to house dust mites has no changes, that to tree pollen was significantly increased in the 2010s in all age groups. Skin reactivity rates to grass and weed pollens were significantly decreased only in young age groups in the 2010s (<30 years old) (Fig. 3).
Fig. 2.

Comparison of skin reactivity according to age groups in the 2010s. *Skin reactivity (%) to all allergens was decreased according to increase in age (P<00.01).
Fig. 3.
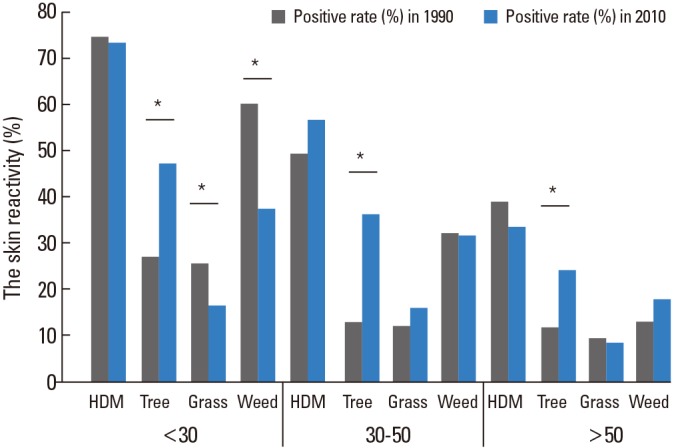
Changes in skin reactivity to allergic diseases according to age and test period. *P<00.05 for comparison of skin reactivity (%) between the 1990s and the 2010s.
Changes in skin reactivity over the last 30 years
There was no significant change in atopy rate during the last 30 years (71.9%, 74.0%, and 73.6% in the 1980s, the 1990s, and the 2010s, respectively) (Fig. 4). Skin reactivity to tree pollens was significantly increased to 36.4% in the 2010s from 19.0% in the 1990s and 8.8% in the 1980s. In the 2010s, skin reactivity to grass pollens (13.9%) was significantly decreased compared with those of the 1990s (20.3%) which is higher than those of the 1980s (10.4%). Also, skin reactivity to weed pollens (27.0%) was significantly decreased compared with those of the 1990s (40.9%) which is higher than those of the 1980s (25.6%) (Fig. 4). In the 2010s, skin reactivity to oak (14.4%), birch (13.6%), alder (13.4%) and pine (14.3%) were significantly increased compared with those of the 1990s (Oak 4.4%; Birch 7.1%; Alder 6.3%; Pine 2.9%). Among grass pollens, skin reactivity to Bermuda grass (5.5%) was significantly increased in the 1990s as compared with the 1980s (1.3%). In the 2010s, skin reactivity to sagebrush (14.8%), Japanese hop (11%), ragweed (15.8%) and fat hen (7.3%) were significantly decreased as compared with those of 1990s (Sagebrush 22.7%; Japanese hop 18.5%; Ragweed 22.1%; Fat hen 12%). Skin reactivity to chrysanthemum (13.9%) was significantly increased in the 2010s as compared with the 1990s (6.8%). Among mold allergens, skin reactivity to Aspergillus fumigatus (16.4%) and Candida albicans (9.5%) were significantly increased in the 2010s as compared with the 1990s (Aspergillus fumigatus 4.9%; Candida albicans 4.4%). Skin reactivity to D. p (43.2%) was significantly increased in the 1990s compared with the 1980s (33.4%). Skin reactivity to dog (20.7%) and cockroach (12.3%) were significantly decreased in the 2010s as compared with the 1990s (Dog 27.3%; cockroach 25.3%) (Fig. 5).
Fig. 4.
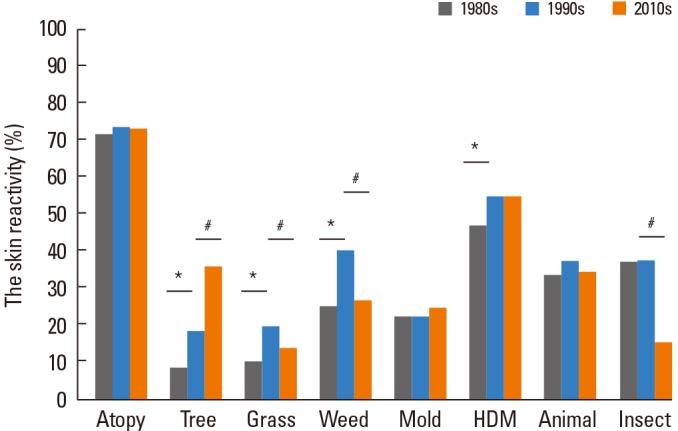
Changes in the skin reactivity of allergen groups during the last 30 years. *P<00.05 for comparison of skin reactivity (%) between the 1980s and the 1990s. #P<00.05 for comparison of skin reactivity (%) between the 1990s and the 2010s.
Fig. 5.
Changes in the skin reactivity of each allergen during the last 30 years. (A) Tree pollen, (B) Grass pollen, (C) Weed pollen, (D) Molds, (E) House dust mites, animal hairs and cockroach. *2010s vs 1980s (P<00.01), #1990s vs 1980s (P<00.01), $Higher value in the 1990s than the 2010s (P<00.01), &Higher value in the 2010s than the 1990s (P<00.01).
Meadow gr, Meadow grass; Hop J, Humulus japonicus ; Asp fumig, Aspergillus fumigatus; D. p, Dermatophagoides pteronyssinus; D. f, Dermatophagoides farinae.
Although data was not shown in graph, we analyzed the change of skin reactivity in bronchial asthma only group and bronchial asthma with allergic rhinitis group over last 30 years. The number of bronchial asthma patients and bronchial asthma with allergic rhinitis patients were 342 and 158 in the 1980s, 237 and 147 in the 1990s, and 211 and 282 in the 2010s. Tree pollen sensitization rate has significantly increased in both disease groups (bronchial asthma only: 1980s/1990s/2010s=6.4%/12.7%/23.2%, P value <0.001; bronchial asthma with allergic rhinitis: 1980s/1990s/2010s=13.9%/24.5%/40.1%, P value <0.001). Grass and weed pollens sensitization rates have no change in bronchial asthma only group (grass pollen: 1980s/1990s/2010s=8.2%/10.6%/9.5%; weed pollen: 1980s/1990s/2010s=20.2%/25.3%/18%). In bronchial asthma with allergic rhinitis group, both grass and weed pollens sensitization rate have significantly increased in the 1990s than those in the 1980s (grass pollen: 15.2%->24.5%, P value=0.006; weed pollen: 37.3%->55.8%, P value <0.001) and decreased in the 2010s than those in the 1990s (grass pollen: 16% in the 2010s<-24.5% in the 1990s, P value 0.024; weed pollen: 28.7% in the 2010s<-55.8% in the 1990s, P value <0.001). The sensitization of indoor allergens in bronchial asthma with allergic rhinitis group have significantly decreased in the 2010s than those of the 1990s (HDM: 55.7% in the 2010s<-66% in the 1990s, P value: 0.025; animal: 38.7% in the 2010s<-57.1% in the 1990s, P value <0.001; insect: 17.4% in the 2010s<-38.8% in the 1990s, P value <0.001). In bronchial asthma only group, the sensitization rates of HDM and insect have significantly decreased in the 2010s than those of in the 1990s (HDM: 37.4% in the 2010s <-48.5% in the 1990s, P value: 0.017; insect: 12.3% in the 2010s <-29.5% in the 1990s, P value <0.001). The sensitization rate of molds was not change in both disease groups over last 30 years.
DISCUSSION
Sensitization to allergens is an important step in the development of allergic diseases, such as bronchial asthma, allergic rhinitis, and allergic conjunctivitis. Determining the culprit allergens involved in the development of clinical symptoms is important to the diagnosis and management of allergic diseases. SPT is a fundamental tool which is widely used to determine sensitized allergens.
The increase in allergic diseases and changes in allergen sensitization have been attributed to changes in lifestyle, culture, and environment.7,8,12 The economic, social and lifestyle environments have rapidly improved in Korea during the last 30 years. In addition, climate and pollen amounts have changed as well.22 These changes have affected the prevalence of allergic diseases and sensitization to allergens in Korea.9 We researched the change of allergen sensitization of allergic diseases in Severance Hospital which is affiliated with Yonsei University College of Medicine. We reviewed and compared data on sensitized allergens which had been collected during the last 30 years.
The allergic sensitization rates involved in different allergic diseases have been described in previous papers. In the 1980s, skin reactivity rates for allergic rhinitis, asthma, and combined cases were 74.7%, 69.0%, and 84.8%, respectively, in Korea.21 According to SPT results in the 2010s, the skin reactivity rate was 73%-93% for allergic rhinitis or allergic conjunctivitis and 55% for bronchial asthma. In both periods, skin reactivity was higher in allergic rhinitis with or without asthma than in asthma only group.
The age distribution for allergic diseases in the 2010s was similar to the reported distribution in the 1980s and 1990s. The positivity rate to SPTs in patients younger than 30 years old was higher than the rate in patients older than 30 years. This is in concordance with other studies which have shown that younger patients were more sensitized than older patients.12 Careful observation of the ratio of younger patients is needed to determine whether it is increasing.
The present study analyzed changes in skin reactivity to allergens during the last 30 years. Allergens can be divided to 2 groups (outdoor allergens including pollens of tree, grass, and weed; indoor allergens including HDM, insect, and animal hair). Among outdoor allergens, changes of skin reactivity to pollens of tree, grass, and weed were different. Skin reactivity to tree pollen was significantly increased in the 2010s as compared with those in the 1980s and 1990s, especially for oak, birch, alder, and pine. The amount of pollen in the air is associated with the sensitization rate. There is a positive correlation between the amount of pollen and the rate of sensitization.23,24,25 According to a Korean Forest Service report, the total amount of forest trees has dramatically increased during the last 30 years. In particular, the total amount of forest trees has doubled during the last 10 years.26 Sprouting and blooming dates affect the amount of tree pollen. The average sprouting and blooming date of cherry blossoms has been shortened with global warming. According to the National Institute of Meteorological Research report, the average yearly temperature in Korea has increased from 11.8℃ in the 1960s-1990s to 12.5℃ in the 1980s-2010s.27 The amount of tree pollen has significantly increased during the last 12 years in Korea as well.26 We analyzed data from the National Institute of Meteorological Research and confirmed that the amount of oak pollen has increased during the last 15 years (P value 0.042, Pearson's test coefficient r=0.513) (Fig. 6). The increase in pollen production of trees which has resulted from the increasing total amount of forest trees, global warming, and earlier sprouting/blooming date may have caused an increase in skin reactivity to tree pollens.
Fig. 6.
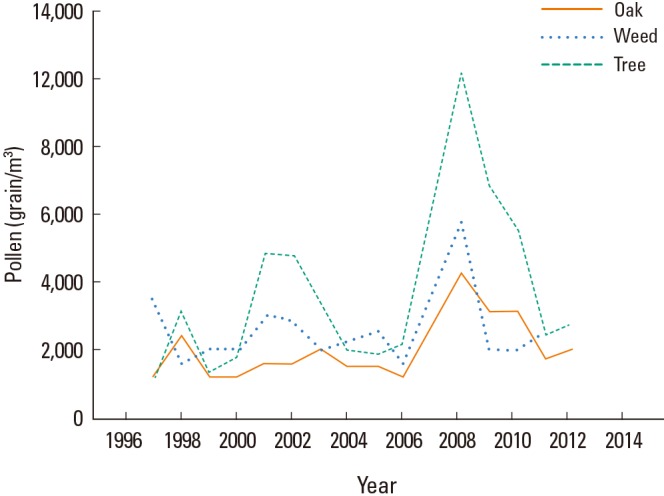
Changes in pollen counts in the air in Korea from 1997 to 2012. The amount of oak pollen has significantly increased over the last 15 years (P=0.042).
Gingko pollen is outstanding allergen especially in Korea. Gingko has been planted along streets in preference to other tree species in Korea because of its endurance and cleanliness and resistance to disease and pests. The ratio of gingko trees among total street trees was 43% in 1998. According to a Korean Forest Service report in 2012, cherry blossom (22%) and gingko (18%) were the most widely planted street trees. In a previous study among respiratory allergic patients, skin reactivity to gingko was 4.7% in 2000.17 In the present study, the skin reactivity rate to gingko increased to 8.8% in the 2010s. Gingko should be considered to be one of inhalant allergenic pollen for Korean respiratory allergic patients.
Even though many cases showed skin reactivity to pine pollen (≥2+), a small number of patients (26/158) were strongly reactant (≥3+). In addition, the CAP positivity rate for pine pollen was only 23.1% (3 out of 13). Pine pollen has long been considered a low-allergenic pollen. However, pollenosis to pine pollen has been reported in Spain and New Zealand.28 It is not yet known why skin reactivity to pine pollen has increased in Korea during the last 20 years from 2.9% to 14.3%. It is assumed that this is due to a change in the allergenicity of pine. Further study is needed to examine the increase in skin reactivity to pine pollen.
Skin reactivity to grass and weed pollens was significantly decreased in the 2010s compared with the 1990s. This may be affected by change in the inhabited environment and climate change. The amount of grass and weed pollen present is affected by climate. We analyzed annual changes in rainfall from mid-August to mid-September which is flowering season of sagebrush, ragweed, and Japanese hop in Korea. Although the data is not shown, there was no significant change in the dates of rainfall during the last 30 years. In other studies, skin reactivity to grass and weed pollens was significantly increased in recent years in Croatia and Sweden.12,16 Further study is needed to determine why skin reactivity to grass and weed pollens has decreased in Korea. The current SPT does not include important pollens in Korea, such as foxtail, silver grass, and reed, and it is therefore unable to reflect the actual sensitization to grass pollens in Korea. The allergens for SPTs need to be modified to reflect the actual sensitization patterns in Korea.
Among the indoor allergens, house dust mites have been the most common inhaled allergens in Korea for the last 30 years. House dust mites are widely known as the most important inhalant allergens worldwide. In Korea, many studies have reported the importance of house dust mites in allergic disease.29,30,31 The present study confirmed the importance of house dust mites as the most common allergen in Korea. Another indoor allergen, the pharaoh ant (Monomorium pharaonis) has been described as one of the important inhalant allergens. According to a previous paper in 2005, the skin reactivity rate to pharaoh ant was 18.2% in asthma patients.18 In the present study, the rate of skin reactivity to pharaoh ant in the 2010s was 19.7%, and was higher than reactivity to G. cockroach (12.3%). Therefore, pharaoh ant should be included in SPT for screening of culprit allergens in Korea.
Skin reactivity to molds and animal hair has not changed, while skin reactivity to insects was significantly decreased in the 2010s. Skin reactivity to cockroach, which is the most important insect allergen, is affected by exposure to cockroach allergens.32,33,34 The improvement of hygiene and development of insecticides may have resulted in a decrease of exposure to cockroach allergens and sensitization to cockroach. On the other hand, skin reactivity rate to some indoor allergens didn't decrease in the 2010s despite of improvement of hygiene. So, supplementary methods to eradicate some indoor allergens such as house dust mite and pharaoh ant should be considered.
These data do not include important factors which are crucial for sensitization to allergens, such as the region of inhabitance, cohabitation with pets and economic level.13,14 Furthermore, the study does not include some important allergic diseases such as atopic dermatitis and food allergy. In addition, this study has limitation in exact comparison because of its retrospective design such as small sample size, prevalence of allergic disease, batches of inhalant allergens used in SPT, and participant's criteria. But the summary of above results would be enough to suggest the tendency of changes in skin reactivity in Korean respiratory allergic patients over the last 30 years. We recommend that further prospective study and multi-center study are needed including non-respiratory allergic diseases and other important factors.
We have described the major allergic diseases and predominant allergens in Korea. Additionally, our study documented changes in allergic sensitization in Korea over the last 30 years. Skin reactivity to tree pollen, such as oak, birch, alder, and pine, was significantly increased in the 2010s compared with the 1990s and the 1980s. On the contrary, skin reactivity to grass and weed was significantly decreased in the 2010s. Skin reactivity will be increased because the amount of pollen will be increased according to increase of forest trees and average temperature. Continuous close observation of changes in environmental factors, such as the amount of pollen, global warming, and plant distribution, is needed. Furthermore, regular review and analysis of changes in allergen sensitization is needed for the proper diagnosis, management and prevention of allergic disease.
ACKNOWLEDGMENTS
Pollen data used in this study were collected through the financial support of the National Institute of Meteorological Research and the Korean Academy of Pediatric Allergy and Respiratory Disease.
Footnotes
There are no financial or other issues that might lead to conflict of interest.
References
- 1.Suh M, Kim HH, Sohn MH, Kim KE, Kim C, Shin DC. Prevalence of allergic diseases among Korean school-age children: a nationwide cross-sectional questionnaire study. J Korean Med Sci. 2011;26:332–338. doi: 10.3346/jkms.2011.26.3.332. [DOI] [PMC free article] [PubMed] [Google Scholar]
- 2.Zar HJ, Ehrlich RI, Workman L, Weinberg EG. The changing prevalence of asthma, allergic rhinitis and atopic eczema in African adolescents from 1995 to 2002. Pediatr Allergy Immunol. 2007;18:560–565. doi: 10.1111/j.1399-3038.2007.00554.x. [DOI] [PubMed] [Google Scholar]
- 3.Maziak W, Behrens T, Brasky TM, Duhme H, Rzehak P, Weiland SK, Keil U. Are asthma and allergies in children and adolescents increasing? Results from ISAAC phase I and phase III surveys in Münster, Germany. Allergy. 2003;58:572–579. doi: 10.1034/j.1398-9995.2003.00161.x. [DOI] [PubMed] [Google Scholar]
- 4.Lee SL, Wong W, Lau YL. Increasing prevalence of allergic rhinitis but not asthma among children in Hong Kong from 1995 to 2001 (Phase 3 International Study of Asthma and Allergies in Childhood) Pediatr Allergy Immunol. 2004;15:72–78. doi: 10.1046/j.0905-6157.2003.00109.x. [DOI] [PubMed] [Google Scholar]
- 5.Pearce N, Aït-Khaled N, Beasley R, Mallol J, Keil U, Mitchell E, Robertson C ISAAC Phase Three Study Group. Worldwide trends in the prevalence of asthma symptoms: phase III of the International Study of Asthma and Allergies in Childhood (ISAAC) Thorax. 2007;62:758–766. doi: 10.1136/thx.2006.070169. [DOI] [PMC free article] [PubMed] [Google Scholar]
- 6.Williams H, Stewart A, von Mutius E, Cookson W, Anderson HR International Study of Asthma and Allergies in Childhood (ISAAC) Phase One and Three Study Groups. Is eczema really on the increase worldwide? J Allergy Clin Immunol. 2008;121:947–954.e15. doi: 10.1016/j.jaci.2007.11.004. [DOI] [PubMed] [Google Scholar]
- 7.Strachan DP. The role of environmental factors in asthma. Br Med Bull. 2000;56:865–882. doi: 10.1258/0007142001903562. [DOI] [PubMed] [Google Scholar]
- 8.The International Study of Asthma and Allergies in Childhood (ISAAC) Steering Committee. Worldwide variation in prevalence of symptoms of asthma, allergic rhinoconjunctivitis, and atopic eczema: ISAAC. Lancet. 1998;351:1225–1232. [PubMed] [Google Scholar]
- 9.Hong SJ, Lee MS, Sohn MH, Shim JY, Han YS, Park KS, Ahn YM, Son BK, Lee HB Korean ISAAC Study Group. Self-reported prevalence and risk factors of asthma among Korean adolescents: 5-year follow-up study, 1995-2000. Clin Exp Allergy. 2004;34:1556–1562. doi: 10.1111/j.1365-2222.2004.02084.x. [DOI] [PubMed] [Google Scholar]
- 10.Ellwood P, Asher MI, Beasley R, Clayton TO, Stewart AW ISAAC Steering Committee. The international study of asthma and allergies in childhood (ISAAC): phase three rationale and methods. Int J Tuberc Lung Dis. 2005;9:10–16. [PubMed] [Google Scholar]
- 11.Böcking C, Renz H, Pfefferle PI. Prevalence and socio-economic relevance of allergies in Germany. Bundesgesundheitsblatt Gesundheitsforschung Gesundheitsschutz. 2012;55:303–307. doi: 10.1007/s00103-011-1427-6. [DOI] [PubMed] [Google Scholar]
- 12.Mehulić M, Mehulić K, Vuljanko IM, Kukulj S, Grle SP, Vukić AD, Barisić B, Plavec D. Changing pattern of sensitization in Croatia to aeroallergens in adult population referring to allergy clinic during a period of 15 years. Coll Antropol. 2011;35:529–536. [PubMed] [Google Scholar]
- 13.Yong SB, Wu CC, Tzeng YC, Hung WC, Yang KD. Different profiles of allergen sensitization in different ages and geographic areas in Changhua, Taiwan. J Microbiol Immunol Infect. 2013;46:295–301. doi: 10.1016/j.jmii.2012.07.002. [DOI] [PubMed] [Google Scholar]
- 14.Moral L, Roig M, Garde J, Alós A, Toral T, Fuentes MJ. Allergen sensitization in children with asthma and rhinitis: marked variations related to age and microgeographical factors. Allergol Immunopathol (Madr) 2008;36:128–133. [PubMed] [Google Scholar]
- 15.Linneberg A, Nielsen NH, Madsen F, Frølund L, Dirksen A, Jørgensen T. Increasing prevalence of specific IgE to aeroallergens in an adult population: two cross-sectional surveys 8 years apart: the Copenhagen Allergy Study. J Allergy Clin Immunol. 2000;106:247–252. doi: 10.1067/mai.2000.108312. [DOI] [PubMed] [Google Scholar]
- 16.Movérare R, Kosunen TU, Haahtela T. Change in the pattern of IgE reactivity to timothy grass and birch pollen allergens over a 20-year period. J Investig Allergol Clin Immunol. 2006;16:274–278. [PubMed] [Google Scholar]
- 17.Yun YY, Ko SH, Park JW, Hong CS. IgE immune response to Ginkgo biloba pollen. Ann Allergy Asthma Immunol. 2000;85:298–302. doi: 10.1016/S1081-1206(10)62533-1. [DOI] [PubMed] [Google Scholar]
- 18.Kim CW, Kim DI, Choi SY, Park JW, Hong CS. Pharaoh ant (Monomorium pharaonis): newly identified important inhalant allergens in bronchial asthma. J Korean Med Sci. 2005;20:390–396. doi: 10.3346/jkms.2005.20.3.390. [DOI] [PMC free article] [PubMed] [Google Scholar]
- 19.Son BK, Lim DH. Allergic skin test. Korean J Pediatr. 2007;50:409–415. [Google Scholar]
- 20.Kim CW, Lee JH, Jung HW, Choi SR, Cheong JW, Park JW, Hong CS. Changing patterns of skin reactivity to inhalant allergens in asthmatic patients. J Asthma Allergy Clin Immunol. 2001;21:205–215. [Google Scholar]
- 21.Yoon YW, Lee MK, Park HS, Park SS, Hong CS. The skin test reactivity and the level of the total IgE in the Allergic Patients. Allergy. 1989;26:385–398. [Google Scholar]
- 22.Oh JW, Lee HB, Kang IJ, Kim SW, Park KS, Kook MH, Kim BS, Baek HS, Kim JH, Kim JK, Lee DJ, Kim KR, Choi YJ. The revised edition of Korean calendar for allergenic pollens. Allergy Asthma Immunol Res. 2012;4:5–11. doi: 10.4168/aair.2012.4.1.5. [DOI] [PMC free article] [PubMed] [Google Scholar]
- 23.Lin RY, Clauss AE, Bennett ES. Hypersensitivity to common tree pollens in New York City patients. Allergy Asthma Proc. 2002;23:253–258. [PubMed] [Google Scholar]
- 24.Ariano R, Passalacqua G, Panzani R, Scordamaglia A, Venturi S, Zoccali P, Canonica GW. Airborne pollens and prevalence of pollenosis in western Liguria: a 10-year study. J Investig Allergol Clin Immunol. 1999;9:229–234. [PubMed] [Google Scholar]
- 25.Lee HR, Kim KR, Choi YJ, Oh JW. Meteorological impact on daily concentration of pollens in Korea. Korean J Agric For Meteorol. 2012;14:99–107. [Google Scholar]
- 26.Korea Forest Service. Online Forest basic statistics publications in 2010 [Internet] Daejeon: Korea Forest Service; [cited 2011 Aug 23]. Available from: http://www.forest.go.kr/ [Google Scholar]
- 27.Korea Meteorological Administration. Online Mean temperature data (30 years) [Internet] Seoul: Korea Meteorological Administration; [cited 2010 Dec 31]. Available from: http://www.kma.go.kr/ [Google Scholar]
- 28.Gastaminza G, Lombardero M, Bernaola G, Antepara I, Muñoz D, Gamboa PM, Audicana MT, Marcos C, Ansotegui IJ. Allergenicity and cross-reactivity of pine pollen. Clin Exp Allergy. 2009;39:1438–1446. doi: 10.1111/j.1365-2222.2009.03308.x. [DOI] [PubMed] [Google Scholar]
- 29.Jeong KY, Park JW, Hong CS. House dust mite allergy in Korea: the most important inhalant allergen in current and future. Allergy Asthma Immunol Res. 2012;4:313–325. doi: 10.4168/aair.2012.4.6.313. [DOI] [PMC free article] [PubMed] [Google Scholar]
- 30.Shin JW, Sue JH, Song TW, Kim KW, Kim ES, Sohn MH, Kim KE. Atopy and house dust mite sensitization as risk factors for asthma in children. Yonsei Med J. 2005;46:629–634. doi: 10.3349/ymj.2005.46.5.629. [DOI] [PMC free article] [PubMed] [Google Scholar]
- 31.Kim J, Lee S, Woo SY, Han Y, Lee JH, Lee IY, Lim IS, Choi ES, Choi BW, Cheong HK, Lee SI, Ahn K. The indoor level of house dust mite allergen is associated with severity of atopic dermatitis in children. J Korean Med Sci. 2013;28:74–79. doi: 10.3346/jkms.2013.28.1.74. [DOI] [PMC free article] [PubMed] [Google Scholar]
- 32.Sohn MH, Kim KE. The cockroach and allergic diseases. Allergy Asthma Immunol Res. 2012;4:264–269. doi: 10.4168/aair.2012.4.5.264. [DOI] [PMC free article] [PubMed] [Google Scholar]
- 33.Gruchalla RS, Pongracic J, Plaut M, Evans R, 3rd, Visness CM, Walter M, Crain EF, Kattan M, Morgan WJ, Steinbach S, Stout J, Malindzak G, Smartt E, Mitchell H. Inner City Asthma Study: relationships among sensitivity, allergen exposure, and asthma morbidity. J Allergy Clin Immunol. 2005;115:478–485. doi: 10.1016/j.jaci.2004.12.006. [DOI] [PubMed] [Google Scholar]
- 34.Eggleston PA, Rosenstreich D, Lynn H, Gergen P, Baker D, Kattan M, Mortimer KM, Mitchell H, Ownby D, Slavin R, Malveaux F. Relationship of indoor allergen exposure to skin test sensitivity in inner-city children with asthma. J Allergy Clin Immunol. 1998;102:563–570. doi: 10.1016/s0091-6749(98)70272-6. [DOI] [PubMed] [Google Scholar]


