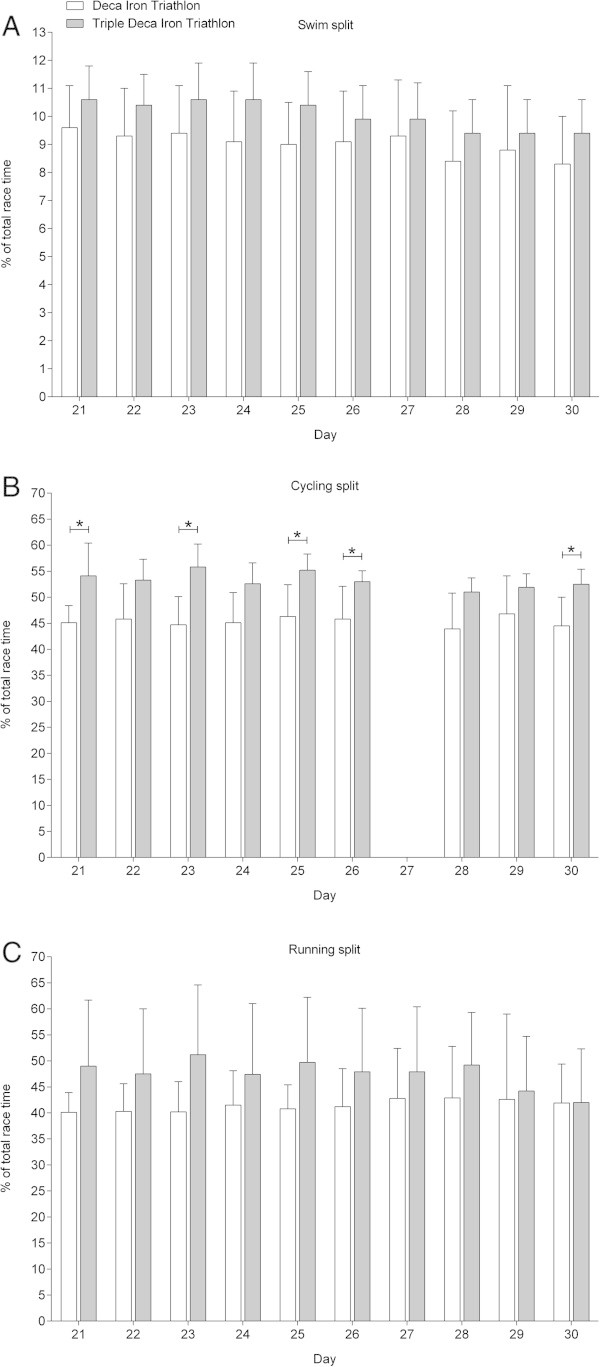
Figure 8.

Comparison of split and overall race times for Deca Iron ultra-triathletes ( i.e. all ten race days) and Triple Deca Iron ultra-triathletes ( i.e. Day 21-Day 30) expressed in percent of overall race time. (Panel A) swimming, (Panel B) cycling, (Panel C) running. Values are means ± SD.
