Abstract
This paper presents the implementation details, system architecture and performance of a wearable sensor network that was designed for human activity recognition and energy expenditure estimation. We also included ActiGraph GT3X+ as a popular single sensor solution for detailed comparison with the proposed wearable sensor network. Linear regression and Artificial Neural Network are implemented and tested. Through a rigorous system study and experiment, it is shown that the wearable multi-sensor network outperforms the single sensor solution in terms of energy expenditure estimation.
Keywords: Wearable Sensor Network, Activity Recognition, Energy Expenditure Estimation
I. Introduction
According to the data from World Health Organization, worldwide obesity increased over 200% since 1980 [1]. It has been proven that obesity can cause coronary heart disease, type-2 diabetes, and various types of cancers [2]. Diet control and physical exercise are the two most important components of obesity control. Traditionally, self-reported questionnaires were widely used by researchers for estimating both food intake and physical activity levels for high-risk individuals. In recent years, however, accelerometers, gyroscope, pressure sensor and heart rate monitor have been deployed for physical activity detection and energy expenditure (EE) [3].
Recent advances in low-cost and energy-efficient sensing and networking technology are opening up new possibilities for wearable medical diagnostics[4][5]. A number of tiny sensors, strategically placed on the human body, can create a network that can monitor physical activities, EE, and vital signs, and provide real-time feedback analytics to medical service providers. Many patient diagnostic procedures can benefit from such continuous health monitoring for optimal management of prevention of chronic conditions and supervised illness recovery.
Traditional EE measuring methods, such as direct and indirect calorimetry, doubly labeled water, physical activity scoring through observation and the Compendium of Physical Activities [6], are too involved and expensive to be used over a long period of time or for a large population. Accelerometers and heart rate monitors are therefore widely used for EE estimation[7][8], since they are cheap and non-invasive.
Some other papers include heart rate into consideration to improve the accuracy of EE estimation [7][9]. In [7], two gel electrodes were placed on the subjects’ chest for ECG data collection, and the ECG data is stored on a device attached to an elastic belt on the chest, which also has a tri-axial accelerometer. Brage [9] uses a Polar Vantage NV HR belt for heart rate monitoring, and two CSA accelerometers on each hip for movement capturing. The heart rate indeed improve the accuracy in EE estimation, but these heart rate monitoring devices requires direct skin contact and are not comfortable to wear for everyday usage. Zhang [10] uses 5 wirely connected sensors to achieve highly accurate physical activity detection and EE, all of which also require skin contact.
Crouter and Rothney [11][12] proposed two popular regression schemes for EE estimation based on a single accelerometer mounted at the hip. The main idea of [11] is to classify activities into three different groups based on the intensity, and apply different regression models for each activity group. Rothney [12] first extracts features of the accelerometers capturing the intensity of movement, and incorporate demographic features to include the inter-subject variations. The extracted features are then fed into an Artificial Neural Network for training and testing purposes. A significant disadvantage of the methods abovementioned is that they are not able to capture movement of the limbs, because they use a single accelerometer on the hip.
To address that limitation we used a wearable sensor network with multiple accelerometers. This system is expected to work better than single accelerometer solution. To the best of our knowledge, there has not been any detailed comparison between the performances of single and multi-sensor solutions in this context. In this paper, we report the results from a systems level study of the multi-sensor wearable sensor network applied for EE estimation analytics. Based on acceleration data from 3 biaxial accelerometer sensors worn on the right wrist, right thigh and right ankle, the system was trained for energy expenditure estimation. We compare its performance with a popular single sensor solution using an accelerometer on the hip.
II. System Architecture
A. Architecture
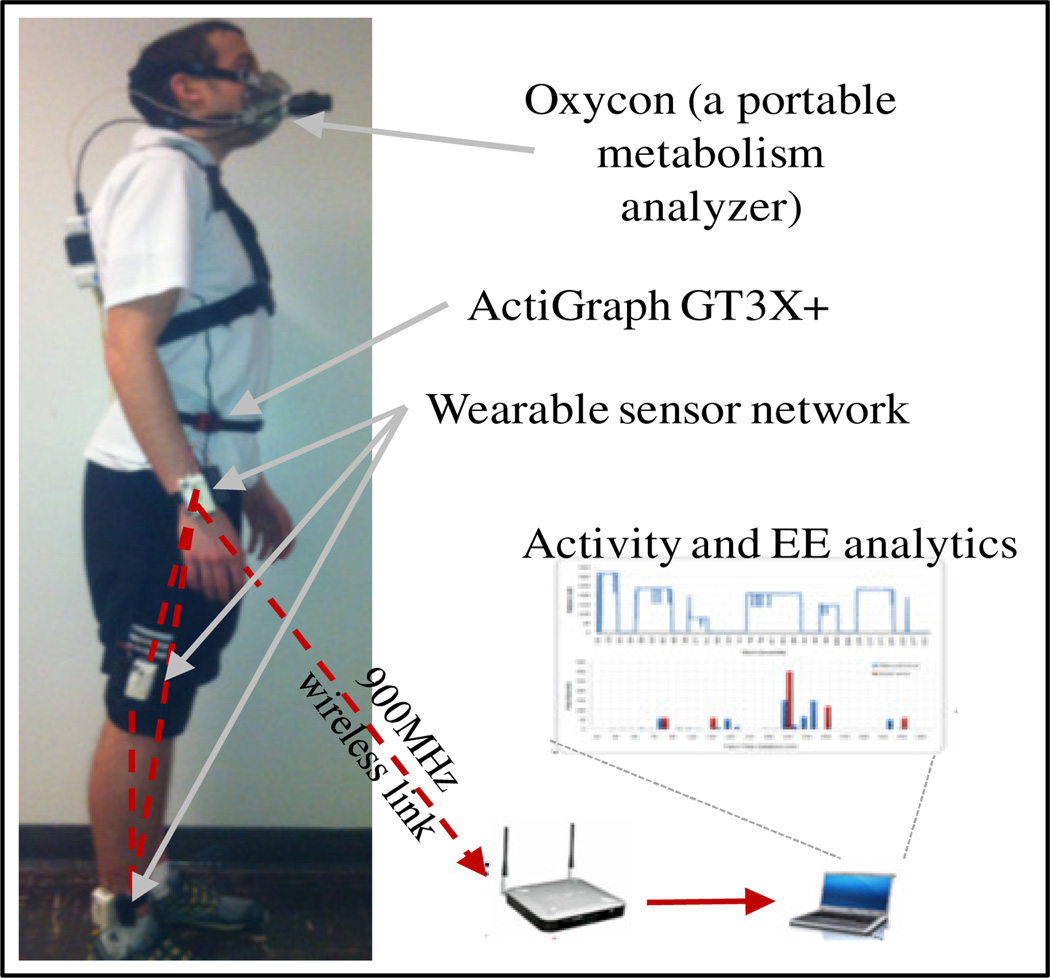
As shown in Fig. 1, the experimental system consists of three main components: an Oxycon Mobile indirect calorimeter [13], an ActiGraph GT3X+ [14] worn on the hip, and a wearable wireless sensor network with three sensors worn on the right wrist, right thigh, and right ankle. The Oxycon Mobile calorimeter is a battery powered system that measures breath-by-breath air exchange. It consists of a gas analyzing unit, a wireless telemetry unit, and a mask. It measures the volume of air, and the O2 and CO2 percentage during each exhalation. The gas analyzing unit is calibrated right before each experiment using a certified gas mixture of 16% O2 and 4.01% CO2. We use 30-second window for the calculation of MET (Metabolic Equivalent of Task), where 1 MET corresponds to 3.5 mlO2/Kg·min. An ActiGraph GT3X+ is secured on the hip using an elastic belt, and it is programmed to sample at 30Hz with a resolution of 2.93mg and the range up to ±6g.
Fig. 1.
Wearable energy expenditure estimation system
For the sensor network, each wearable sensor is a small 6cm × 3.2cm × 1.5cm package, weighing approximately 20 grams. The package contains a sensor subsystem (MTS310 from MemSic Inc.), a processor and radio subsystem (Mica2 motes), running TinyOS operating system. Batteries weigh approximately 13 grams and are attached separately. For each sensor package, two 600mAh AAAA batteries are able to support the system for more than 30 hours. A sensor package is worn with an elastic band so that once worn, the sensor orientation does not change with respect to the body segments. Once activated, each sensor package continuously samples its acceleration (−2g to +2g) in two axes and sends them to a nearby (within 50 meters) laptop using a 900MHz wireless link via an access point.
B. Media Access Control
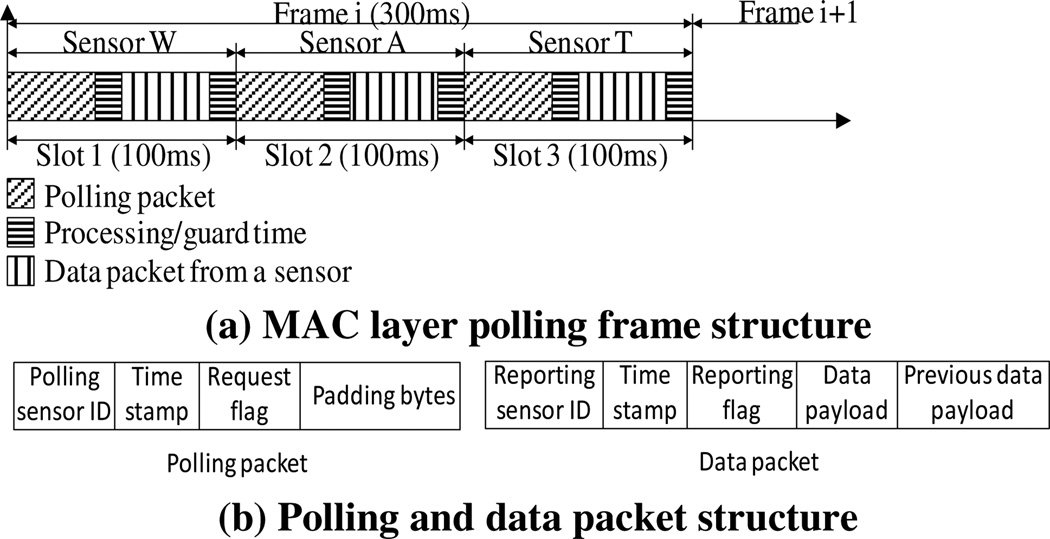
A collision-free TDMA MAC protocol is used for both intra-body and out-of-body radio communication. As shown in Figure 2:a, the access point is programmed to send periodic polling packets to sensors W, A, and T, referring to those on the wrist, ankle, and thigh respectively. Upon reception of a polling packet, a sensor sends its data packet out. A guard time is allocated between the polling and data packets in order to accommodate clock drifts and processing latencies. Frame duration of 300 ms is used in the polling process. A packet occupies approximately 30ms, and the allocated guard time is approximately 20ms.
Figure 2.
TDMA MAC layer for on- and off-body communication
Figure 2:b depicts the polling and data packet structures. In a polling packet, the Polling Sensor ID represents the sensor that is being polled, and the sent Time Stamp captures the current time of the access point. The polled sensor returns this Time Stamp as is with the sampled acceleration data, thus enabling the receivers to synchronize data samples from all three sensors with reference to the Access Point’s time. The Request Flag is used to indicate the requested type of data. Finally, the Padding Bytes are inserted to keep its size equal to that of the data packets.
In a data packet, the Reporting Sensor ID represents the sending node’s identity, and the Time Stamp contains the same value in the corresponding received polling packet. The Request Flag is used to indicate the type of data being sent. As shown in Figure 2:b, the data part of the packet contains two components: 1) Data Payload, consisting of 3 most recent acceleration samples (4 bytes each) which are being sent for the first time, 2) Previous Data Payload, consisting of 3 previous samples that were already sent as the Data Payload in the last frame. In other words, there is a three-sample overlapping redundancy from each sensor over consecutive frames. in the event of a polling packet or data packet loss, a recipient sensor (or access point) can recover data up to a certain extent due to that redundancy. For a given packet loss, a data loss would occur only when two consecutive packets get lost. Therefore, for a packet loss rate p, the effective data loss rate P can be expressed as P = p2.
III. Processing Methods
In this section we present our approach to comparing the performance of EE estimation using the single sensor on the hip and the 3-sensor wearable sensor network. Our approach for EE estimation takes three steps. First we extract features for both activity recognition and EE estimation. Second, we apply activity recognition mechanism and categorize activities into clusters based on their intensities and positions of the body. Third, we apply different regression equations to each activities category using both accelerometric and demographic features.
A. Feature Extraction
In our previous work [3][15], mean and entropy have been proved to be efficient in activity recognition, since they capture both the direction and moving intensity of the limb the sensor is attached to. Using those features, we are able to different fourteen different activities namely, bicep curls, riding a bike briskly and slowly, jogging, jumping jacks, walking briskly and slowly, sweeping, squats, climbing stairs, lying down, sitting reclined, sitting straight and standing. The same features are also used for EE estimation in this paper. Raw accelerometer data of each axis on each sensor is segmented into 4.2 second 50% overlapping windows. Mean and entropy are then calculated for each window.
Demographic features are also used in the regression model to compensate inter-subject variations in energy expenditure. Different people performing the same activity would generate similar acceleration data but very different EE, because of the differences in gender, age, weight, and height. Therefore, we also include these demographic features into the model.
B. Activity Clusters
We applied activity recognition mechanism developed in our previous work [3] for activity detection. It has been shown that the proposed scheme is able to provide 96.95% accuracy in differentiating the 14 activities using SVM (Support Vector Machine). Activities are then grouped into different clusters based on their intensity and position of the body. Specifically, sedentary and light activities would consume less energy than laborious activities. However, EE can be very different even with similar accelerometric measures. For example, walking consumes more energy than riding a bike at the same speed [16], since it requires muscles on the leg to support the mass of the body. Therefore, we divide the activities into four groups as shown in Table 1.
Table 1.
Clustering of activities
| Activities | |
|---|---|
| Group 1 | Lying down, sitting reclined, sitting straight, standing |
| Group 2 | Bicep curls and sweeping |
| Group 3 | Jogging, jumping, walking briskly, walking slowly, squats and climbing stairs |
| Group 4 | Riding a bike briskly and slowly |
According to the effectiveness of the mean and entropy as features in detecting activities, we also extract these two features on each axis of ActiGraph GT3X+. SVM is then trained and tested using leave-one-out scheme. It is shown that this mechanism has 80.71% accuracy in detecting the 14 activities. In order to compare the EE estimation performance of ActiGraph GT3X+ to wearable multi-sensor network, we adopt the same clustering of activities as shown in Table 1.
C. Activity Cluster Modeling
According to Crouter [11], different models should be used for activities with different intensities. Therefore, we build EE estimation models for each of the above mentioned activity cluster, and we also experiment with linear regression and ANN (Artificial Neural Network) for each cluster. For generalizability purpose, both accelerometric and demographic features are used in the models [12].
IV. Experiment and Evaluation
A. Experimental Methods
The experiments were carried out on 25 subjects, 17 female and 8 male. The details of the subjects are shown in Table 2.
Before each 60-minute experiment session, a subject is asked to lie down for 10 minutes. During the experiment, each subject wore all the equipment as illustrated in Fig. 1. All the devices are time synchronized so that the data from them can be correlated and compared. The subject is then engaged in 14 different activities, i.e., bicep curls, riding a bike briskly and slowly, jogging, jumping jacks, walking briskly and slowly, sweeping, squats, climbing stairs, lying down, sitting reclined, sitting straight and standing. The activities represent a combination of exercise and lifestyle activities and consist of a wide range of activities from sedentary to vigorous.
Subjects were instructed to perform each of the 14 activities at least for 1 minute, but they were free to choose the sequence and the length (1–10 minutes) of each activity. In order to improve the generalizability of the results, data during the transitions are kept in the data set, and the models are built and evaluated in such a way that data from 2/3 of the subjects is used for training and that from the other 1/3 is used for testing.
B. Results
In our previous work [3][15], it was shown that the wearable sensor network is able to detect the 14 activities with up to 96.95% accuracy, and it was proved that more sensors can deliver higher detection accuracy. When similar mechanism is applied on ActiGraph GT3X+ sensor, the accuracy drops to 80.71%, and it showed some difficulties in differentiating between jumping jacks and walking fast, climbing stairs and riding a bike briskly, and sitting straight and standing. However, inferior accuracy in activity recognition does not necessarily indicate lower performance in EE estimation, because the activities that are mistakenly labeled may have similar EE with the detected activities. Table 3 demonstrates the average and standard deviation of EE of each activity. It can be seen that sitting straight and standing, climbing stairs and riding a bike briskly have similar EE. Jumping jacks and walking fast also have their EE values partially overlapped.
Table 3.
Mean and standard deviation of per-activity EE
| Activity | EE (Mean±std) (METs) |
Activity | EE (Mean±std) (METs) |
|---|---|---|---|
| Bicep curls | 2.46±1.07 | Sweeping | 3.69±1.37 |
| Riding a bike briskly | 6.82±1.22 | Squats | 5.03±1.55 |
| Riding a bike slowly | 5.18±1.04 | Climbing stairs | 7.42±1.91 |
| Jogging | 9.25±1.70 | Lying down | 2.25±1.38 |
| Jumping | 8.61±2.07 | Sitting reclined | 2.56±1.55 |
| Walking briskly | 5.74±1.19 | Sitting straight | 2.59±1.58 |
| Walking slowly | 3.84±1.29 | standing | 2.45±1.47 |
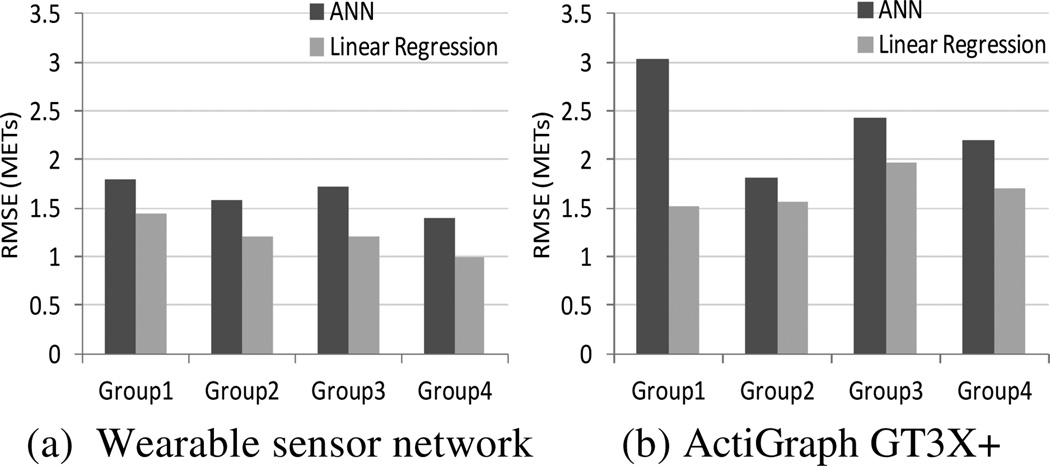
Fig. 3 illustrates the performance of Artificial Neural Network and linear regression using the extracted features. Fig. 3:a corresponds to the wearable multi-sensor network, and Fig. 3:b corresponds to the ActiGraph GT3X+ accelerometer on the hip. Observe that the model using wearable sensor network outperforms that using ActiGraph GT3X+ in all the activity clusters. Moreover, linear regression method works better than ANN in both cases, which is partially because of the generalizability problem of ANN [17]. Therefore, we use linear regression for our following analysis.
Fig. 3.
Performance of models using ActiGraph GT3X+ and wearable multi-sensor network
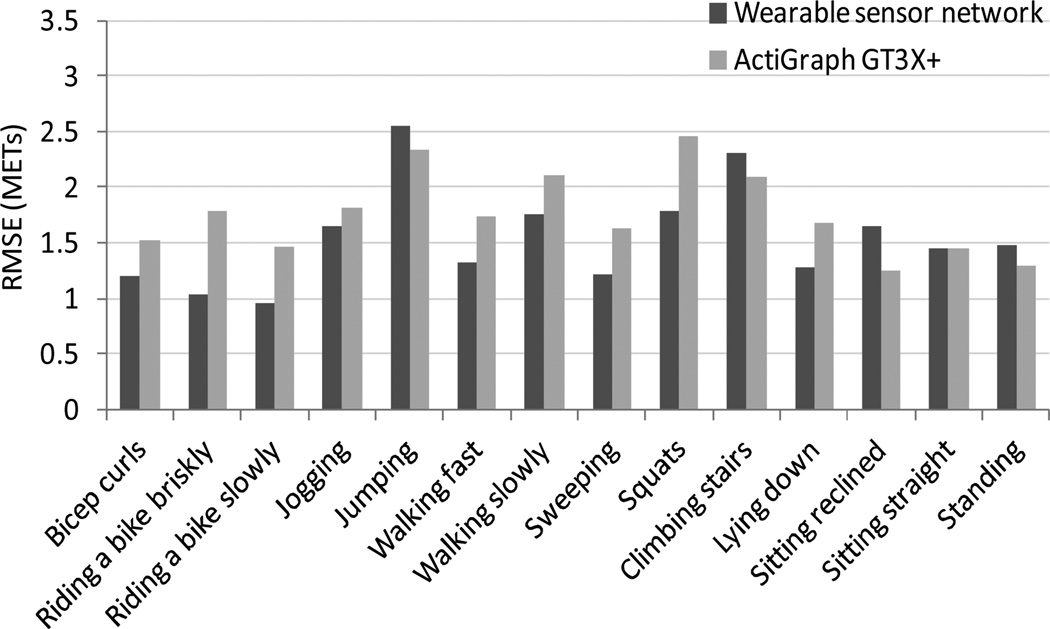
Fig. 4 shows the EE estimation errors using linear regression method with wearable sensor network and ActiGraph GT3X+. It can be seen that the wearable multi-sensor network performs better than ActiGraph GT3X+ on the hip in most cases. EE estimation errors are higher for jumping jacks, and climbing stairs, which also have larger standard deviation as shown in Table 3.
Fig. 4.
EE estimation using linear regression with wearable multi-sensor network and ActiGraph GT3X+
V. Conclusion and Future Work
In this paper, we introduced a wearable multi-sensor sensor network for activity recognition and EE estimation, and we compared the performance of the proposed wearable multi-sensor network with a popular single sensor solution. The proposed model can be divided into the following three steps. First, we extract features based on accelerometer readings including mean and entropy, and we also include demographic features, such as gender, age, weight and height, into our models. Second, based on the intensity and position of the activities, we group the 14 activities into 4 groups. Third, we build linear regression model and ANN model using both the accelerometric and demographic features extracted.
Our experiments show that the proposed wearable multi-sensor network consistently outperforms the single sensor solution based on ActiGraph GT3X+, and linear regression model also performs better than ANN model.
Our ongoing work includes: 1) including other physiological facts as features in building the models, such as body temperature and skin conductivity, 2) developing better models for higher EE estimation accuracy, and 3) integrating the wearable system as a part of overall energy management infrastructure that includes an automatic on-body diet monitoring system.
Table 2.
Statistics of the subjects
| Mean ± std | Range | |
|---|---|---|
| Age (Year) | 21.24±2.03 | 19~28 |
| Weight (Kg) | 65.62±10.36 | 46.75~88.7 |
| Height (cm) | 168.74±8.36 | 150~186.1 |
| BMI (Kg/m2) | 21.24±2.03 | 17.32~27.05 |
Acknowledgments
This project is supported by NIH grant R21 HL093395
Contributor Information
Bo Dong, Email: dongbo@egr.msu.edu, Department of Electrical and Computer Engineering, Michigan State University.
Subir Biswas, Email: sbiswas@egr.msu.edu, Department of Electrical and Computer Engineering, Michigan State University.
Alexander Montoye, Email: montoyea@msu.edu, Department of Kinesiology, Michigan State University.
Karin Pfeiffer, Email: kap@msu.edu, Department of Kinesiology, Michigan State University.
References
- 1.WHO. WHO | Obesity and overweight. [Accessed 26-Jan-2013];WHO. [Online]. Available: http://www.who.int/mediacentre/factsheets/fs311/en/.
- 2.Clinical Guidelines on the Identification, Evaluation, and Treatment of Overweight and Obesity in Adults - NCBI Bookshelf. [Accessed 26-Jan-2013]; [Online]. Available: http://www.ncbi.nlm.nih.gov/books/NBK2003/.
- 3.Dong B, Biswas S. Wearable networked sensing for human mobility and activity analytics: A systems study; 2012 Fourth International Conference on Communication Systems and Networks (COMSNETS); 2012. pp. 1–6. [DOI] [PMC free article] [PubMed] [Google Scholar]
- 4.Wu WH, Bui AAT, Batalin MA, Liu D, Kaiser WJ. Incremental diagnosis method for intelligent wearable sensor systems. IEEE Trans Inf Technol Biomed. 2007 Sep.11(5):553–562. doi: 10.1109/titb.2007.897579. [DOI] [PubMed] [Google Scholar]
- 5.Wu WH, Bui AAT, Batalin MA, Au LK, Binney JD, Kaiser WJ. MEDIC: medical embedded device for individualized care. Artif Intell Med. 2008 Feb.42(2):137–152. doi: 10.1016/j.artmed.2007.11.006. [DOI] [PubMed] [Google Scholar]
- 6.DSpace@MIT : Using machine learning for real-time activity recognition and estimation of energy expenditure. [Accessed: 01-Feb-2013]; [Online]. Available: http://dspace.mit.edu/handle/1721.1/44913?show=full. [Google Scholar]
- 7.Energy Expenditure Estimation Using Wearable Sensors: A New Methodology for Activity-Specific Models. [Accessed: 31-Jan-2013]; prezi.com. [Online]. Available: http://prezi.com/zqgnildaonsw/energy-expenditure-estimation-using-wearable-sensors-a-new-methodology-for-activity-specific-models/. [Google Scholar]
- 8.Bonomi AG, Plasqui G, Goris AHC, Westerterp KR. Improving assessment of daily energy expenditure by identifying types of physical activity with a single accelerometer. J. Appl. Physiol. 2009 Sep.107(3):655–661. doi: 10.1152/japplphysiol.00150.2009. [DOI] [PubMed] [Google Scholar]
- 9.Brage S, Brage N, Franks PW, Ekelund U, Wong M-Y, Andersen LB, Froberg K, Wareham NJ. Branched equation modeling of simultaneous accelerometry and heart rate monitoring improves estimate of directly measured physical activity energy expenditure. J. Appl. Physiol. 2004 Jan.96(1):343–351. doi: 10.1152/japplphysiol.00703.2003. [DOI] [PubMed] [Google Scholar]
- 10.Zhang K, Pi-Sunyer FX, Boozer CN. Improving energy expenditure estimation for physical activity. Med Sci Sports Exerc. 2004 May;36(5):883–889. doi: 10.1249/01.mss.0000126585.40962.22. [DOI] [PubMed] [Google Scholar]
- 11.Crouter SE, Clowers KG, Bassett DR., Jr A novel method for using accelerometer data to predict energy expenditure. J. Appl. Physiol. 2006 Apr.100(4):1324–1331. doi: 10.1152/japplphysiol.00818.2005. [DOI] [PubMed] [Google Scholar]
- 12.Rothney MP, Neumann M, Béziat A, Chen KY. An artificial neural network model of energy expenditure using nonintegrated acceleration signals. J. Appl. Physiol. 2007 Oct.103(4):1419–1427. doi: 10.1152/japplphysiol.00429.2007. [DOI] [PubMed] [Google Scholar]
- 13.Oxycon Mobile - CareFusion. [Accessed: 02-Feb-2013]; [Online]. Available: http://www.carefusion.com.au/medical-products/respiratory/cardio-pulmonary-diagnostics/metabolic-carts-cpet-nutrition/metabolic-carts/oxycon-mobile.aspx. [Google Scholar]
- 14.GT3X+ | ActiGraph. [Accessed: 02-Feb-2013]; [Online]. Available: http://www.actigraphcorp.com/support/devices/gt3xplus/. [Google Scholar]
- 15.Dong Bo, Biswas Subir. A machine learning approach for energy-aware activity classification using wearable sensor networks. presented at the SPIE Defense, Security, and Sensing, Baltimore, Maryland, United States; 2013. [DOI] [PMC free article] [PubMed] [Google Scholar]
- 16.Dill DB, Seed JC, Marzulli FN. Energy Expenditure in Bicycle Riding. J Appl Physiol. 1954 Nov.7(3):320–324. doi: 10.1152/jappl.1954.7.3.320. [DOI] [PubMed] [Google Scholar]
- 17.Sexton RS, Sriram RS, Etheridge H. Improving Decision Effectiveness of Artificial Neural Networks: A Modified Genetic Algorithm Approach. Decision Sciences. 2003;34(3):421–442. [Google Scholar]


