Abstract
This paper discusses the development of a cross-platform, web accessible, vendor-independent database system capable of storing and comparing longitudinal tumor measurements for multiple tumors. This innovative system can create a comprehensive cumulative report that summarizes clinical findings and links to the original image studies, which will clinically enhance the workflow of oncologists. A case study on a pancreatic tumor data set with 524 tumor measurements and 134 patients is demonstrated.
I. Introduction
In recent decades, diagnostic medical images and radiotherapy play a larger role in the monitoring and assessment of tumor growth. Thus, referring clinicians often rely on radiology reports to summarize and communicate the findings of image studies [1]. Radiology reports were traditionally written in free-text and consisted of three steps: dictation by the interpreting radiologist, transcription of the findings, and verification of the report [2]. Transcription error, discrepancies between reported and actual abnormalities, insufficient documentation, poor organization, and long reporting process are some of the common problems and limitations associated with these reports [1, 2, 4–6]. Additionally, only 26% of radiology reports provide value for tumor burden assessment [7].
The Digital Imaging and Communications in Medicine (DICOM) standard introduced the specifications for Structured Report (SR) to facilitate unambiguous, precise, searchable, and valuable reporting [2]. DICOM SR is based on a hierarchical relationship and utilizes the DICOM standard to define, store, query, retrieve, and transfer data [3]. A key feature of the SR is its ability to link text to specific images [3]. These characteristics create concise and clear report, faster turnaround, and more accurate coding of diagnosis, which was found to improve the workflow and efficiency of radiologists [6]. These benefits can be extended to delivering and exchanging results of clinical trials [8].
The advantages of the DICOM SR are clear but the implementation of the standard proves to be challenging [9–11]. The different customization of SR presentation and third party DICOM SR created compatibility issue between different picture archiving and communication systems (PACS). Furthermore, the use of different communication standard for PACS and for radiology information system (RIS), DICOM and health level seven (HL7) protocol, respectively, complicates the exchange of image and text data, which hinder effective integration of data in the hospital information systems (HIS). To overcome these issues, we have developed a cross-platform, web accessible and vendor-independent database that can facilitate the integration of information from both PACS and RIS.
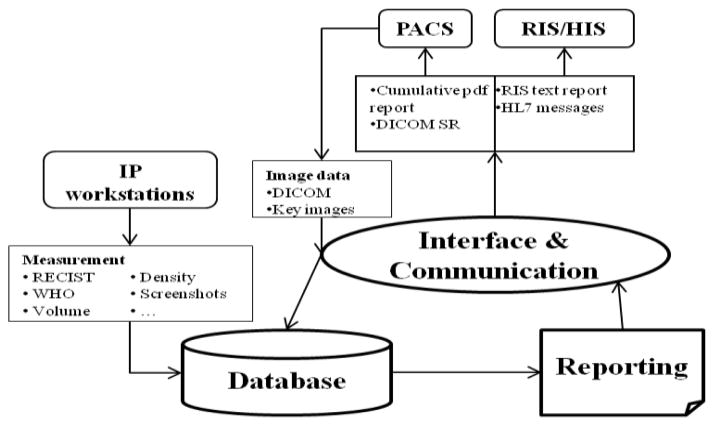
The Clinical Image Processing Services (CIPS) group at the National Institutes of Health (NIH) provides image processing and tumor measurement services to various clinical trials at NIH. There is no standard reporting system among the trials. Furthermore, the current reporting systems do not allow for comparison of multiple tumors at multiple time points and separate the clinical findings from the images. Additionally, measurements are currently being recorded in Excel spreadsheets, which have several limitations. The spreadsheet cannot be shared simultaneously and cannot be queried for specific information. Therefore, there is a growing need to develop a database system capable of creating comprehensive cumulative report for tumor measurements. The development of this database is part of a larger project to integrate the cumulative report with HIS. An overview of the data flow of the integration process is presented in Fig. 1. The new cumulative tumor reporting system consists of three components: database, interface and communication, and reporting. Image studies are exported from PACS and enter the interface and communication component to have the study and patient information extracted. These data and the tumor measurement values are entered into the database. Reports are created and stored in the database before being sent to the interface and communication component again to be transformed into the appropriate forms for integration with PACS and RIS/HIS. Database is the essential part of the reporting system.
Figure 1.
Overview of the data flow between the database, interface and communication, and reporting system
The new system should be capable of storing tumor measurements (i.e. Response evaluation criteria in solid tumor (RECIST), World Health Organization (WHO) criteria, volume, density, and standard deviation), analyzing tumor changes (i.e. tumor burden, percent changes, and doubling time), and creating specific reports to meet the diverse interests and needs of the groups at NIH. The data flow, work flow, and specifications of the new database system for cumulative tumor measurement at the NIH Radiology and Imaging Services Department are discussed in this paper.
II. Methodology
Image studies from PACS are exported and stored as DICOM files on the server. The patient and study information are extracted from the DICOM headers via a practical extraction and report language (Perl) script and automatically imported into the database. Tumor measurements can be made on any of the image processing (IP) workstations available in the Clinical Image Processing Services laboratory (e.g., Carestream PACS, Siemens Syngo, Toshiba Vitrea Server, General Electric AWServer). The database will create a cumulative summary report for each patient, which will be described in detail in the next section.
A. The Database
The database component was developed with FileMaker Pro because of the software’s ability to create a cross-platform database, share data simultaneously, access data online, import data in multiple forms (.csv, .tab, XML, ODBC, Excel), and connect to other data sources (i.e. SQL server, Oracle, MySQL) [11]. The database is hosted on a 2.13 GHz, 3.25GB ram computer. The database contains seven related tables: protocol, patient, study, tumor, measurement value, image, and report; the entity relationship diagram of the database is presented in Fig 2. The relationship between the different tables is identified and maintained by the unique serial number stored in the primary key fields. The protocol outlines the research goals, procedure, and data collection for each oncology team at the NIH. Each research protocol (clinical trial) can have multiple patients and each patient can have multiple studies, tumors, and reports. Each measurement corresponds to one of the patient’s studies and includes linear (RECIST, WHO, density, standard deviation), and volumetric measurement values. Measurements may also contain additional images (screenshots or DICOM key images with markups) created by technicians showing how the measurements are made.
Figure 2.

Entity relationship diagram of the database
Each table also contains other fields that store pertinent information (e.g., patient’s information, study date, study description, tumor number, and tumor location). These fields are searchable, which will be useful for querying information and future data mining, a limitation discussed in the introduction. Advanced and custom queries (e.g., how many patients have more than 1 lesion larger than 1mm?) can better assist the work of the oncology teams at NIH.
Two types of accounts are created for: (1) operator accounts to enter measurement values and create summary reports, (2) view-only accounts to view measurements and access reports. All reports and database designs are created by the administrator. The accounts are associated with clinical trials so that user’s access to the database will be restricted to the data relating to specific protocols.
The workflow of the database begins with the user log in. The database will automatically filter the data to match the user’s data privilege. User with multiple protocol privileges will be prompted to select the intended protocol. The patient and study information is automatically imported through a Perl script and technicians manually input the tumor measurements obtained from image processing workstations. Based on the need and interests of the physicians, the database stores RECIST, WHO, volume, density, and standard deviation measurements. Additionally, the database automatically calculates tumor burden, doubling time, changes in tumor size, and the tumor response as defined by the RECIST 1.1 guidelines [13].
B. Reporting
As described in the introduction, the reporting system in most clinical environment is limited because of the inability to compare multiple tumors at multiple time points and to combine texts and images. These restrictions are addressed by the cumulative report created by our system. The report is broken into four categories: patient information, image study information, findings summary, and figures and screenshots.
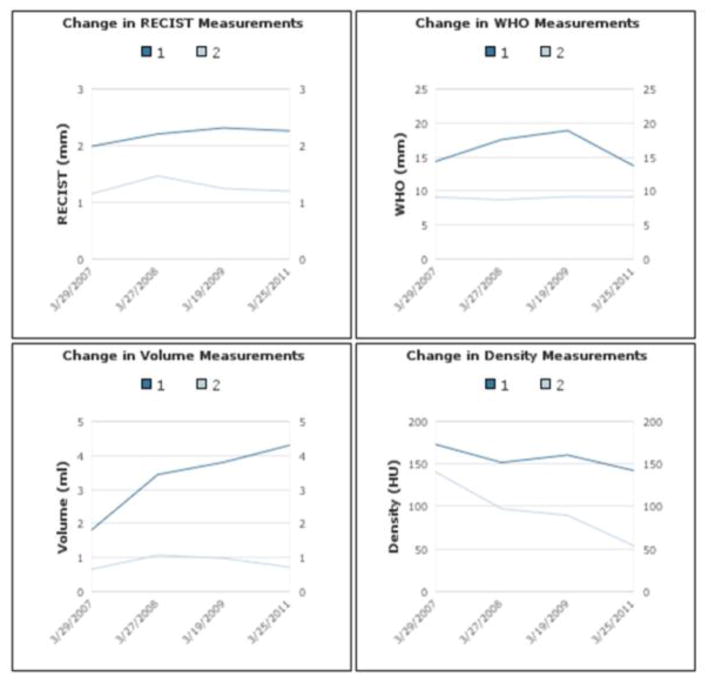
The patient’s medical record number, name, birth date, age, and gender are provided in the beginning of the report. The next section contains a list of the patient’s related image studies with the most recent study presented at the top. These studies indicate the time points when the tumors are imaged and measured. In the report, the study date is linked to a hyperlink of the original image study and can be opened using PACS reading software. The findings summary section summarizes the patient’s tumor measurements (Fig. 2). The values are grouped by the tumor number and sorted in descending chronological order. The doubling time and change in RECIST, WHO, volume, and density measurements are automatically calculated between each time point. The overall tumor growth % is also provided. The tumor burden for the patient is presented at the end of this section. In the last section, four figures chart the trend of the patient’s tumors. Each figure corresponds to the change in RECIST, WHO, volume, and density measurements. Any screenshots or additional images created by the technicians are stored in the database will be presented beneath the four figures.
The cumulative summary report will be saved as a pdf file and stored in the database. The report can also be accessed online, printed, or emailed.
C. Case Study Design
To test the performance of the new reporting system, we imported the tumor measurement data of pancreatic lesions that were previously made by a technician in CIPS. A Perl script parsed the spreadsheet into four types of data: patient, study, tumor, and measurement values. Serial numbers were generated for each data to create and maintain its relationship with the other data. The parsed data is then imported into the database. We tested the system’s security, web accessibility, and reporting. In this fashion, we can import any existing data sheet or database into the new database system.
III. RESULT
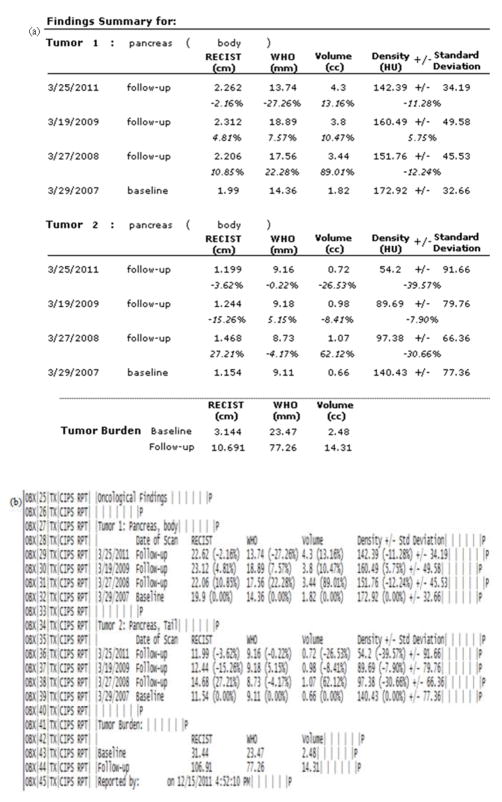
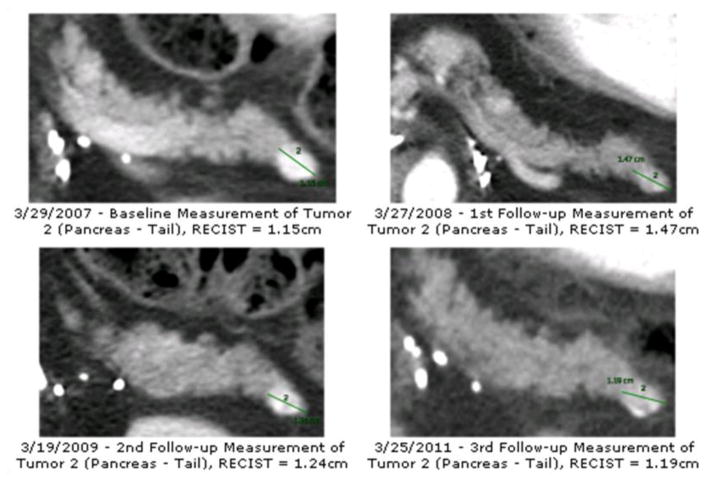
A total of 134 patients, 183 tumors, 356 time points, and 524 tumor measurements were imported into the database from the pancreatic lesion data set. A cumulative summary report was created for each patient and stored in a container field. Fig. 3(a) presents an example of the findings summary section and Fig. 3(b) presents the corresponding HL7 messages. We were successful in sending the HL7 messages via the open source sender and listener [14] between the database server and another computer. Fig. 4 presents an example of the longitudinal changes in RECIST measurements for two tumors at 4 time points. Fig. 5 shows the DICOM key images with markups made by technicians, which are also included in the report to provide visual information.
Figure 3.
Example of the (a) findings summary section of the summary report and (b) the corresponding HL7 messages
Figure 4.
Longitudinal changes for 2 lesions at 4 time points
Figure 5.
2D DICOM key images with markup made in Carestream PACS.
IV. Discussion
There are many advantages to the new database system. The cross-platform and web accessible database allows a broad range of user access to the database but maintains the security of the data by limiting the privilege settings in each user’s account. Additionally, since the database can accept measurements made by any IP workstations, it provides a vendor-independent standard tool that can be used to analyze and monitor the changes in tumor size. The comprehensive cumulative reporting provides a comparison of multiple tumors at multiple time points, a combination of clinical findings and images, and links to original image studies. These features address the shortcomings of the current reports described in the introduction. Additionally, the tumor burden assessment automatically provided in the reports will enhance the value of radiologist reports for the oncology team.
Another advantage of the system is its ability to import measurements stored on Excel spreadsheet, as demonstrated by the examples provided in Fig. 3 and Fig. 4. This feature allows us to continue its current work with the various groups while merging the current and new reporting system.
We were able to view the imported data in the database in the web application but additional scripts and variations in the workflow were created to overcome some of the inherent limitations of the instant web publishing features of FileMaker Pro [12]. For example, the cumulative report will lose its format and style when viewed in an internet browser and therefore, must be created by a client and stored in container fields in order to be accessed online. Additionally, the script to automate the import of patient and study information cannot be performed under the web accessible application. Therefore, if a technician user chooses to input the measurement values on the web, he or she will have to manually enter the patient and study information. These modifications allow the continual use of the database and reporting system on the web.
Further work will expand the capabilities of the system to assist the workflow of other groups at the NIH, and eventually in other national and global facilities. For example, we recognized the use of the standard RECIST criteria form at the NCI and other cancer institutions and recently added the ability of the database to automatically make RECIST calculation for each image study. We will begin testing the use of the new reporting system within the CIPS laboratory to assess the feasibility of implementing the system in community hospitals. The goal is to provide all clinicians a more efficient system to monitor tumor growth and the ability to communicate this information between different facilities. Thus, the next phase of the project is to integrate the new database system with the HIS.
Currently, the database is capable of accepting information from PACS and RIS to create a comprehensive cumulative report on tumor measurements. We are developing the database’s capabilities so that it can also send information from the report back to the two systems. Storing the report on these HIS will increase its accessibility to other healthcare providers and facilities. As described in the introduction, there are compatibility issues between PACS and RIS due to the use of different communication standards. We plan to overcome this challenge with the Interface and Communication system outlined in Fig. 1. This component will act as the interface to transform the report into acceptable forms for each system.
In total, the cumulative summary report will be transformed into four different forms: DICOM SR, DICOM encapsulated PDF, RIS text report, and HL7 messages. Although the additional reports are in different formats, they will all have the same contents. The DICOM SR and DICOM encapsulated PDF will be sent to PACS. The text report and HL7 messages will be sent to RIS but since RIS cannot accept graphics, the images and figures section is excluded from these two reports. Additional programs need to be developed to interpret and write both DICOM SR and HL7 messages.
Successful integration with the hospital information system will allow for increase collaboration between multiple health institutions, which will improve the health management of patients receiving care in multiple facilities, as well as increase multicenter research opportunities.
Acknowledgments
Research supported by the Intramural Research Program of the National Institutes of Health Clinical Center.
Contributor Information
Jiaxin Huang, Email: jessica.huang@nih.gov, National Institutes of Health Clinical Center, Bethesda, MD. 20892 USA.
David A. Bluemke, Email: bluemked@nih.gov, National Institutes of Health Clinical Center, Bethesda, MD. 20892 USA
Xiao Zhang, Email: zhangxn@cc.nih.gov, National Institutes of Health Clinical Center, Bethesda, MD. 20892 USA.
Ronald M. Summers, Email: RSummers@cc.nih.gov, National Institutes of Health Clinical Center, Bethesda, MD. 20892 USA
Les R. Folio, Email: les.folio@nih.gov, National Institutes of Health Clinical Center, Bethesda, MD. 20892 USA
Jianhua Yao, National Institute of Health Clinical Center, Bethesda, MD 20892 USA.
References
- 1.Naih SS, Hanbridge A, Wilson SR. Radiology reports: examining radiologist and clinicians preferences regarding style and content. AM J Roentgenol. 2001 Mar;176(3):591–598. doi: 10.2214/ajr.176.3.1760591. [DOI] [PubMed] [Google Scholar]
- 2.Berman GD, Gray RN, Liu D, Tyhurst JJ. Structured radiology reporting: a 4-year case study of 160,000 reports (Presented Conference Paper style). presented at the IHE Symposium of the 2001 Ann. RSNA Meeting; Chicago, IL. November 25–30, 2001. [Google Scholar]
- 3.National Electrical Manufacturers Association. Digital Imaging and Communications in Medicine (DICOM) suppl 23: structured reporting storage SOP classes. 1999 Oct 29; [Google Scholar]
- 4.Clunie DA. DICOM Structured Reporting. PixelMed Publishing, PA: Bangor; 2000. pp. 29–38. [Google Scholar]
- 5.Noumeir R. Benefits of the DICOM Structured Report. J Digit Imaging. 2006 Dec;19(4):295–306. doi: 10.1007/s10278-006-0631-7. [DOI] [PMC free article] [PubMed] [Google Scholar]
- 6.Bidgood WD., Jr Clinical importance of the DICOM structured reporting standard. 1998 May;9(40):307–315. doi: 10.1023/a:1006073709957. [DOI] [PubMed] [Google Scholar]
- 7.Levy MA, Rubin DL. Tool Support to Enable Evaluation of the Clinical Response to Treatment. AMIA Annu. Symp. Proc; 2008; Washington DC. 2008. pp. 399–403. [PMC free article] [PubMed] [Google Scholar]
- 8.Clunie DA. DICOM Structured Reporting and Cancer Clinical Trials Results. Cancer Inform. 2007;4:33–56. doi: 10.4137/cin.s37032. [DOI] [PMC free article] [PubMed] [Google Scholar]
- 9.Hussein R, Engelmann U, Schroeter A, Meinzer H. DICOM Structured Reporting: Problems and Challenges in Implementation for PACS Workstations. Radiographics. 2004;24:897–909. doi: 10.1148/rg.243035722. [DOI] [PubMed] [Google Scholar]
- 10.Csipo D, Dayhoof RE, Kuzmak PM. Integrating Digital Imaging and Communications in Medicine (DICOM)-Structured Reporting into the Hospital Enviornment. J Digit Imaging. 2001;14(2):12–16. doi: 10.1007/BF03190287. [DOI] [PMC free article] [PubMed] [Google Scholar]
- 11.Blazona B, Koncar M. HL7 and DICOM based integration of radiology departments with healthcare enterprise information system. Int J Med Inform. 2007;(suppl 3):S425–32. doi: 10.1016/j.ijmedinf.2007.05.001. [DOI] [PubMed] [Google Scholar]
- 12.FileMaker, Inc. FileMaker [Online] 2011 Sep 19; Available: http://www.filemaker.com.
- 13.Eisenhauer EA, Therase P, Bogaerts J, Schwartz LH, Sargent D, Ford R, Dancey J, Arbuck S, Gwyther S, Mooney M, Rubinstein L, Shankar L, Dodd L, Kaplan R, Lacombec D, Verweij J. New response evaluation criteria in solid tumours: Revised RECIST guide (version 1.1) Eur J Cancer. 2008 Oct;45(2):228–247. doi: 10.1016/j.ejca.2008.10.026. [DOI] [PubMed] [Google Scholar]
- 14.Michael C. Blogs.czapski.id.au. [Online] 2012 Jan 30; Available: http://blogs.czapski.id.au/2010/12/hl7-sender-hl7-listener-and-hl7-proxy-developer-tools-i-always-wanted.


