Abstract
In this work, we present a novel learning based fiducial driven registration (LeFiR) scheme which utilizes a point matching technique to identify the optimal configuration of landmarks to better recover deformation between a target and a moving image. Moreover, we employ the LeFiR scheme to model the localized nature of deformation introduced by a new treatment modality - laser induced interstitial thermal therapy (LITT) for treating neurological disorders. Magnetic resonance (MR) guided LITT has recently emerged as a minimally invasive alternative to craniotomy for local treatment of brain diseases (such as glioblastoma multiforme (GBM), epilepsy). However, LITT is currently only practised as an investigational procedure world-wide due to lack of data on longer term patient outcome following LITT. There is thus a need to quantitatively evaluate treatment related changes between post- and pre-LITT in terms of MR imaging markers. In order to validate LeFiR, we tested the scheme on a synthetic brain dataset (SBD) and in two real clinical scenarios for treating GBM and epilepsy with LITT. Four experiments under different deformation profiles simulating localized ablation effects of LITT on MRI were conducted on 286 pairs of SBD images. The training landmark configurations were obtained through 2000 iterations of registration where the points with consistently best registration performance were selected. The estimated landmarks greatly improved the quality metrics compared to a uniform grid (UniG) placement scheme, a speeded-up robust features (SURF) based method, and a scale-invariant feature transform (SIFT) based method as well as a generic free-form deformation (FFD) approach. The LeFiR method achieved average 90% improvement in recovering the local deformation compared to 82% for the uniform grid placement, 62% for the SURF based approach, and 16% for the generic FFD approach. On the real GBM and epilepsy data, the quantitative results showed that LeFiR outperformed UniG by 28% improvement in average.
Keywords: Fiducial-driven image registration, brain MRI, laser-induced interstitial thermal therapy, minimally invasive therapy
1. Introduction
Laser-induced interstitial thermal therapy (LITT) has emerged as a new minimally invasive and safe approach to treat brain tumors, such as glioblastoma multiforme (GBM) [1], and more recently, to treat epileptogenic foci for epilepsy [2]. LITT, which is highly compatible with magnetic resonance imaging (MRI) and coupled with MR thermal imaging guidance, allows for precisely localizing heat to a target with minimal damage to normal surrounding tissues. While LITT holds significant potential to be the modality of choice for multiple diseases (e.g., brain [3], liver [4], prostate [5], breast [6]), it is currently only practised as an investigational procedure at a few clinical centers worldwide due to lack of data on longer term patient outcome following LITT. Consequently, there is a need to employ imaging in conjunction with LITT to better understand the precise change in the focus of treatment post-LITT since the changes in imaging markers could serve as a surrogate of treatment response. Therefore, a good image registration algorithm that can spatially and accurately align pre- and post-LITT MMs is necessary and critical to quantitatively capture and evaluate subtle imaging marker changes post-LITT.
Landmark based nonrigid registration schemes represent the most popular class of methods in medical image registration due to their simplicity and high accuracy [7, 8]. Generally, a landmark based registration approach consists of three main steps: (i) placing landmarks in the different images; (ii) establishing the correspondence between these landmarks; and (iii) computing the transformation between the images using the image correspondence obtained from (i) and (ii). Sun et al. [9] revealed that such landmark driven schemes are sensitive to the number and locations of landmarks. Empirical evidence has suggested that optimizing positions of landmarks will result in better registration via a landmark-driven scheme [10]. However, identifying important landmarks to perform an accurate registration remains a challenging task.
There are a number of ways to choose landmarks in the registration process. Manual landmark selection allows for identification and selection of the most important fiducials based on expert knowledge. However, with human interaction, choice of landmark location is subject to intra- and inter-observer variability. An alternative method is to apply a uniform grid to a region of interest in which landmarks are placed on the grid knots. Further, these configurations can be employed with different levels of discretization. A less granular grid may be insufficient to capture subtle deformation changes, while a highly granular grid can result in over-fitting of the data as well as longer computation times in order to drive the registration. In the last few years, automatic feature based landmark selection has become an active area of research. However, these methods mainly focus on optimization of global transformation and may perform poorly on recovering local deformation (e.g., thermally damaged tissues caused by focal ablation). Such methods hence become inappropriate for registering pre- and post-LITT images, where the focus of interest is in evaluating changes within the ablation zone comprising the region of tumor or epileptogenic foci. Recently, learning-based methods have been explored and applied to the medical image processing field, such as segmentation [11], registration [12], and landmark correspondence [13]. The optimal landmark configurations can be identified via learning landmark fiducials to accurately recover the local deformation induced by LITT.
The objective of this work is to develop a new landmark based nonrigid image registration scheme that should not only be able to enhance registration performance, but also be able to precisely capture local deformation, e.g., subtle tissue changes caused by tumor resection. In this work, we introduce a novel learning based fiducial driven registration (LeFiR) method (see Figure 1) to accurately align pre- and post-LITT MR images to facilitate the identification of changes in MRI markers post-therapy. In the method, an important landmark configuration that would be used as a training landmark set was learned for an image pair with a known deformation. This landmark configuration can be considered as a collection of discrete points. A generic transformation matrix between a pair of training landmark sets with different deformation locations was computed via an iterative close point (ICP) alignment technique. A new landmark configuration was determined by simply transforming the training landmarks to the current displacement location while preserving the topological structure of the configuration of landmarks.
Figure 1.
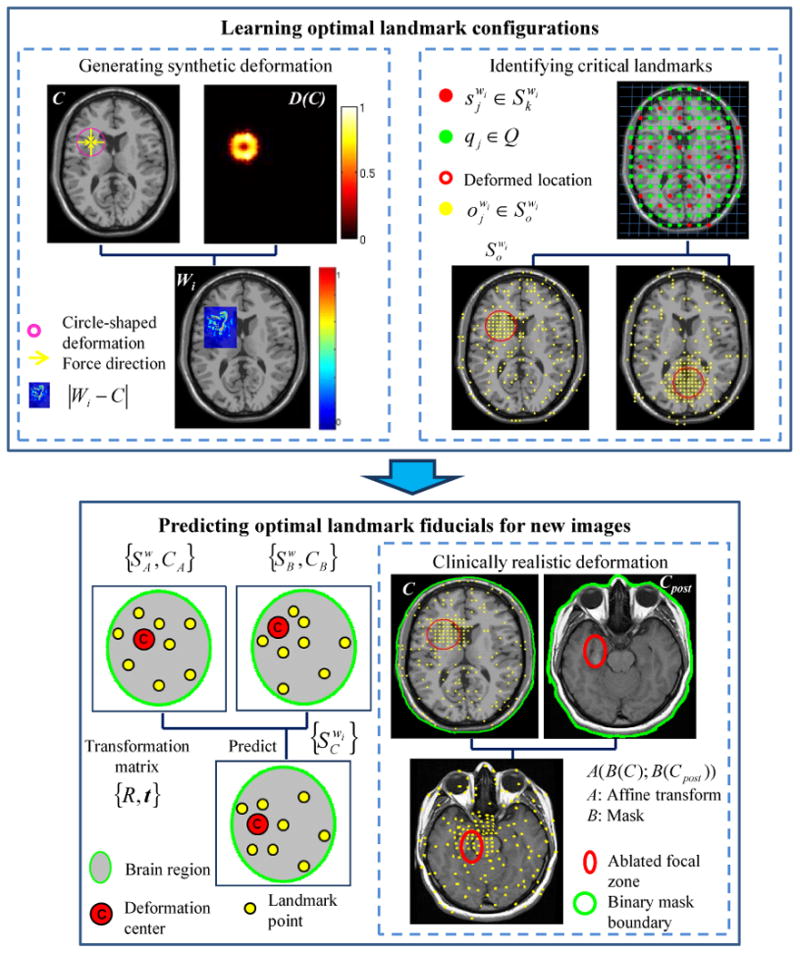
The flowchart of the LeFiR algorithm. The top panel shows the identification of important landmarks using the deformed synthetic images. Two examples of identified landmark sets are shown by using deformation fields
 (fi, la, mm) and
 (fo, lb, mm), respectively. The bottom panel illustrates the prediction of optimal configuration of landmarks for new images. The estimated landmark set can be applied to real clinical deformation to recover the focal deformation.
The remainder of this paper is organized as follows. Section 2 describes previous work and outlines the contributions of the developed work. The problem statement is presented in Section 3. Section 4 provides the detailed description regarding the presented methodology. In section 5, we demonstrate the experimental results with discussion. Section 6 concludes the paper.
2. Prior Related Work and Contributions of New Work
Landmark based nonrigid image registration is among the most well-known methods for medical image registration [10]. Landmarks can be anatomical, i.e., salient and accurately locatable points of the morphology of the visible anatomy, or geometrical, i.e., points at the locus of the optimum of some geometric property, such as local curvatures, corners, etc [14]. The anatomical points are usually identified interactively by the user, while the geometrical points are generally localized in an automatic fashion. However, fully automatic landmark identification has been proven to be a non-trivial task due to various characteristics of medical image data.
Traditional ways to manually extracting landmarks involve manual selection of landmarks corresponding to anatomical structures, a task that usually involves engagement of medical experts. For instance, Lorenz and Krahnstöver [15] presented a semiautomated landmarking method which required manual identification of a few anatomical landmarks to estimate a registration of triangulations based on thin-plate splines (TPS). Lombaert et al. [16] introduced landmarks in a graph cut minimization framework where the point landmarks were placed on blood vessels to perform a non-rigid registration on two arbitrary frames from a coronary cineangiogram. Thus, manual selection mainly select the points easily to locate on anatomical structures so they could introduce large errors [7], especially when there is large inter-observer variability between experts. Levis et al. [17] have reported that inappropriate selection of landmarks on a pair of images could lead to a deteriorated registration performance by causing non-smooth interpolation artifacts between pixel intensities. This procedure is also time-consuming and impractical for routine clinical use which often involves a large cohort of image data.
Alternatively, a uniformly spaced landmark placement can be applied to the target and moving images. The extracted landmarks are considered to contribute equally in the registration process. Each of these configurations can be employed with different levels of discretization. For example, Xie and Farin [18] devised a hierarchical B-spline approximation model for multilevel nonlinear registration, in which a uniform knot spacing is used in a cubic B-splines. Tustison et al. [19] also adopted a equally spaced grid in their free-form deformation (FFD) image registration framework. The drawback of uniformly spaced placement is that these evenly distributed landmarks may not represent informative landmarks (e.g., landmark position on curvature) due to the uniformity and insufficient density of grid. Further, a desirable grid spacing has to be learned before performing the registration since different grid sizes result in different numbers of landmark points.
Moreover, there are a number of automatic landmark selection methods published in literature [20]. Remarkable features or their combinations, such as intensities [21], anatomical structures (e.g., bones, organs or tissues) [22], curvature [10], and shapes [7, 21], have typically been used to guide landmark determination. For example, Betke et al. [23] utilized an attenuation based template matching approach to automatically detect anatomical landmarks for registering lung computed tomography images. Rechberg et al. [24] presented an automatic approach for identifying landmark candidates by computing and choosing high distinctiveness values for the voxels within a region of interest. Gu and Qin [25] designed a global-to-local nonrigid brain image registration scheme in which the keypoints (i.e. landmarks) are selected based on a computed joint salient map. Neu and Toga [26] introduced an empirical training procedure to locate and refine anatomical landmarks within pre-defined precisions using brain images with different resolutions and MRI weightings. The performance of such a scheme is subject to a particular criterion used, and therefore is limited to a certain type of application. In addition, these methods mainly focus on optimization of global transformation and may perform poorly on local deformation.
The LeFiR registration algorithm was specifically designed to solve the above problems and to enhance the global-to-local registration performance. We introduced a local constrained deformation, similar to the deformation caused by LITT in the targeted ablation zone, on synthetic brain MRIs. The important landmark fiducials were automatically identified via an iterative training process. The learned configurations of landmarks were evaluated through both global registration performance and their capability in recovering these predefined localized deformation. The adopted ICP point matching approach allows a simply transformation of the training landmark configurations to a pair of new pre- and post-LITT images meanwhile preserves spatial information contained in these landmark sets.
In summary, the paper presents two major contributions: (1) A novel learning based method is presented to drive global and local image registration. Unlike existing landmark detection schemes that either use (1) user interaction, (2) computing certain features on image intensities [27] or (3) relying on anatomical fiducials [22] to optimize global registration, in our approach critical landmarks are determined based on prior knowledge. Landmark configurations learnt from a prior training set of known deformations allow for accurate capture of both global and local deformation; (2) The LeFiR method provides an effective way to precisely register pre- and post-LITT MRI, particularly in the focal ablation zone. This therefore enables an accurate evaluation of imaging changes prior to and after LITT in terms of size of laser ablation zone, thermal damage to tissue, etc. This newly presented approach will help inform the thermal dose to be delivered to the target and help modulate delivery of the laser treatment to prevent damage to critical structures during MRI-guided LITT.
3. Problem Statement
This section gives a brief description regarding the mathematical formulations for identifying important landmarks and predicting optimal configurations of landmarks based on learning process. Notation and symbols commonly used in this paper are shown in Table 1.
Table 1.
Description of commonly employed notation and symbols in this paper.
| Symbol | Description | Symbol | Description | |
|---|---|---|---|---|

|
2D image scene |

|
TPS cost function | |
| C | 2D grid of pixels, c ∈ C | τ | Spatial transformation | |
| c | Spatial location of a pixel in C, where c = (x, y) |
|
Randomly chosen point sets for {
 , ,
 i} at iteration k i} at iteration k
|
|
| f | Intensity value associated with a pixel c |
|
Learned optimal landmark sets for {
 , ,
 i} i} |
|
| R | A small circle-shaped region R ∈ C | θ | Matching operator in ICP | |

|
Deformation field |

|
Affine transformation | |
| ϕ | Deformation generation function | φ | Landmark selection criterion | |
| ψ | Kernel function for u | u | Displacement field | |
 i i
|
ith Synthetic deformed image |
 (R; t) (R; t) |
ICP transformation rotation matrix R and translation vector t | |
| ℱ | Factors to generate

|
ξ | Hausdorff distance | |
| ℒ | Landmark distribution | {SA, SB, SC} | Optimal landmark configurations | |
| {P, Q} | Point bases for {
 , ,
 i} i} |
{CA, CB, CC} | Deformation center | |
| ζ | Interpolation operator | η | Objective function |
3.1. Important Landmark Identification
We denote
 = (C, f) as an image, where
 is a scene, C is a grid of spatial locations c ∈ C, and f is an intensity function associated with every spatial location c ∈ C. Landmark based image registration involves determining a spatial transformation τ : CT ↦ CM that aligns a moving image (image to be deformed) CM = (CM, f) with a target image (reference image)
 T = (CT, f) by matching corresponding landmarks identified in both images. Given N pairs of points
for the target and moving images as inputs, where i ∈ {1, …, N}, we define a landmark-based image registration problem as finding a displacement u that minimizes the following cost function
 [28, 29]:
| (1) |
subject to the constrains that . The operator ζ denotes a symmetric linear differential operator and is used to interpolate the displacement field u between the corresponding landmarks.
The goal is to identify a pair of landmark sets for the target and moving images, respectively, which achieves the best registration performance measured by , where η is an objective function defined as a quality metric to measure the accuracy of registration in terms of both local and global performance. These two optimal landmark configuration would be used to predicate the critical localizations of landmarks for a new pair of images.
3.2. Optimal Landmark Configuration Predication
Assume two pairs of optimal point sets
and
are obtained from the identification process (see Section 3.1), which have the corresponding deformation centers CA and CB, respectively. The deformation center denotes the centroid of the deformation site induced by the LITT treatment. A point matching algorithm ς is utilized to minimize the difference between two clouds of points
, which computes a transformation matrix
 :
:
| (2) |
where R is a rotation matrix, and t is a translation vector. The point set
is also aligned to
via the transformation matrix
 .
.
Let denote the two unknown point sets for a pair of images with a deformation center CC. If we assume the new point set is similar to the landmark sets with respect to topological structure, thus can be estimated by:
| (3) |
Therefore, the new optimal landmark configuration can be estimated by transforming the learned landmark set via a point matching method to the current deformation location. Here we make two assumptions: i) in a new pair of images the deformation is approximately the same size and has only been spatially relocated in the image, and that by a simple affine transformation one can identify the optimal configuration on this new pair of images; and ii) the deformation is of similar size and shape on the original pair of images. These are reasonable assumptions in many cases where one seeks to register tumor images at multiple time points following application of therapy and to evaluate imaging related changes.
4. Methodology
In the previous section, we formulate the problems for identifying and estimating landmarks in the context of a point-based image registration scheme. This section gives detailed solutions for these two problems to implement a new supervised learning based fiducial driven registration method.
4.1. Learning Optimal Landmark Configurations
4.1.1. Generating synthetic deformations
We denote
 = (C, f) as an original image. A circle-shaped deformation field
 is applied to a small region R of C to simulate the effect of ablation treatment on a local region, which can be expressed as:
| (4) |
where ϕ is a transformation function that can be computed by considering three factors ℱ: (i) two forces (fi, fo), pushing the points towards the target center or outwards to the target boundary, to simulate tissue changes after treatment; (ii) three locations (la, lm, lb) representing three zones (apex, mid-brain, and base) within the organ of interest which were employed to simulate different locations of the disease; and (iii) three deformation magnitudes (ms, mm, ml) reflecting small, medium, and large deformation, in turn aimed to simulate different size and extent of treatment-related changes. Figure 1 (top-left panel) shows an example of a synthetic deformation using
 (fi, la, ms). A set of H deformed images
 i, i ∈ {1, 2, …, H}, is generated by moving the pre-defined deformation field
 to various locations on the original image. By deforming the original data, we could easily validate the registration results by knowing the ground-truth deformation. Moreover, it allows us to potentially identify the trend of landmark localizations associated with different deformation profiles.
4.1.2. Identifying critical landmarks
The optimal landmark distributions ℒ are learned through four experiments: (1) Experiment 1: ℒ in
 (fi, fo); (2) Experiment 2: ℒ in
 (la, lm, lb); (3) Experiment 3: ℒ in
 (ms, mm, mi); (4) Experiment 4: ℒ in various levels of image noise (n1, n5, n9).
For each experiment, we first compute a landmark point base
, pj ∈ G where G is a Ng × Ng uniform grid of spatial locations on C, and a corresponding point base
on
 i. Two images {
 ,
,
 i} are registered via a TPS [30, 31] transform
, k ∈ {1, 2, …, K}, where
and
are randomly chosen point sets containing N points for
 and
and
 i, respectively, and k denotes the index of simulation. Let υj, j ∈ {1, 2, …, M}, store the frequency of each point pair {pj, qj} that participates in the registration. The TPS is a non-rigid transformation model that is widely used to interpolate the displacement field u between the corresponding landmarks. Hence, in Equation 1, the interpolation operator ζ is solved by the TPS transformation, in which the displacement field
is computed by [31]:
| (5) |
where the kernel function ψ(x) is a 1 × N vector for each point x that is defined as
.
 represents a 2 × 2 affine transformation matrix, and ωj is a 2 × 1 warping coefficient matrix representing the non-affine deformation.
For each iterative simulation, sum of squared intensity difference (SSD) [32] is utilized as a selection criterion to compute measure scores for these selected points. After K simulations, an average measure score is calculated for each point pair {pj, qj}, j ∈ {1, 2, …, M}. Two subsets
for
 , and
for
 i containing No (No < M) landmarks with the best values of
, where φ is a selection function defined as the SSD measure, will be selected to form an optimal configuration. Two examples of identified landmark sets corresponding to the locations of apex and base, respectively, are shown in Figure 1 (top-right panel). The two sets
serve as training point sets to estimate the optimal landmark configuration for a new pair of images.
4.2. Predicting Optimal Landmark Fiducial for New Images
For simplicity, we denote S representing a pair of optimal landmark sets for original and deformed images, which is obtained in Section 4.1. Assume that two representative pairs of training point sets SA and SB are given. Since and are identical, alignment of point sets SA and SB is the problem of aligning the point set with the point set , where the corresponding deformation centers are CA and CB, respectively. In order to align these two pairs of landmark sets with each other, a new point set is generated by transforming to the location CB via:
| (6) |
where
 is an affine transform. The ICP alignment method [33] is employed to align point set
and
to obtain a transformation matrix
 (R; t), where R is a rotation matrix, and t is a translation vector. There are two steps to accomplish this. The closet points can be obtained by minimizing:
| (7) |
where ‖ · ‖ is the Euclidean distance, and represents the point in that is closest to point . The rotation matrix R and translation vector t can be computed using the following mathematical expression:
| (8) |
The obtained transformation matrix
 is used to estimate optimal landmark locations of new pair of images by given the displacement site. Based on the point set similar measure ξ, we assume that a new point set
with deformation center CC is subject to
, where ξ is the Hausdorff distance measure, and θ is a pre-defined threshold.
can be predicted based on
, CA, and CC given by:
| (9) |
The LeFiR algorithm is summarized and presented below to spatially align a moving image
 M to a target image
 T, where the center of deformation site CM is known.
| The LeFiR Algorithm |
Inputs:
 T (target image), T (target image),
 M (moving image), M (moving image), (training image), (training image),
 M (deformation center) M (deformation center)Output:  R (registered image) R (registered image)begin 0. define  i, Ck,
,
. i, Ck,
,
.1. For i = 1 to H 2.  i(R) = i(R) =
 (C; ℱ), R ⊂ C; (C; ℱ), R ⊂ C;3. For k = 1 to K 4. randomly select and ; ; 5. endfor; 6. endfor; 7. For i = 1 to H ; endfor; 8. 9. 10. 11. 12. if ; end |
5. Experimental Results and Discussion
5.1. Dataset Description
5.1.1. Simulated brain database
A simulated brain database (SBD) [34], which is publicly available, was utilized for learning optimal landmark configurations. The SBD is a set of realistic simulated brain MR image volumes that allows quantitative brain image analysis to be conducted in a controlled and systematic way. The T1-weighted MR brain images with noise levels of 0%, 1%, 5%, 9% were used in the experiments. For the noisy data, the standard deviation of the Gaussian noise that was added to the real and imaginary channels was given by the noise percent multiplied by the reference tissue intensity. The brightest tissue was used as a reference for the percent noise calculation.
5.1.2. GBM and epilepsy data
A newly Food and Drug Administration cleared surgical laser ablation system (Visualase, Inc., Houston, TX) was employed for treating two GBM patients and two epilepsy patients. Destruction of targeted tissue was guided by real-time MR temperature imaging to precisely control thermal ablation. The patients were monitored post-LITT via MRI guidance after initial 3-Tesla MRI, and were re
 after 24 hours following LITT. All the patients were identified as successfully treated (a reduction of 99% for GBM and seizure free for epilepsy).
5.2. Experimental Design
A cohort of H = 286 pairs of synthetic MRI brain images were generated by varying the deformation factors ℱ defined in Section 4.1.1 across different regions of chosen brain images from SBD. The original image data were pre-processed via a simple thresholding method. The background of the brain image was removed by assigning the pixels belonging to background to zero values. Half of the image pairs (H/2 = 143) were used in the task of learning the optimal landmark configurations and the remaining pairs were used for testing the predicted landmark configurations. To reduce uncertainty associated with random landmark selection, we ran a total of 2000 (K = 2000) simulations for each experiment. This provides us the statistical power for the distribution of landmarks considered. A 5 × 5 (pixels) grid spacing was used to compute the landmark point base P. We tested a number of sizes of grid spacing and experimentally found that a 5 × 5 uniform grid was sufficient for capturing the focal deformation induced by LITT, while also avoiding over-fitting the image data. The threshold θ was determined by computing the Hausdorff distance (ξ) between training sets of landmark points. All the training sets were classified into 8 groups based on the deformation locations. The average Hausdorff distances were calculated between two point sets within a group (ξ1) and between two groups (ξ2), respectively. θ was assigned a value between maximum value of ξ1 and minimum value of ξ2. The TPS transform is estimated using Bookstein's method with default parameter settings reported in [30].
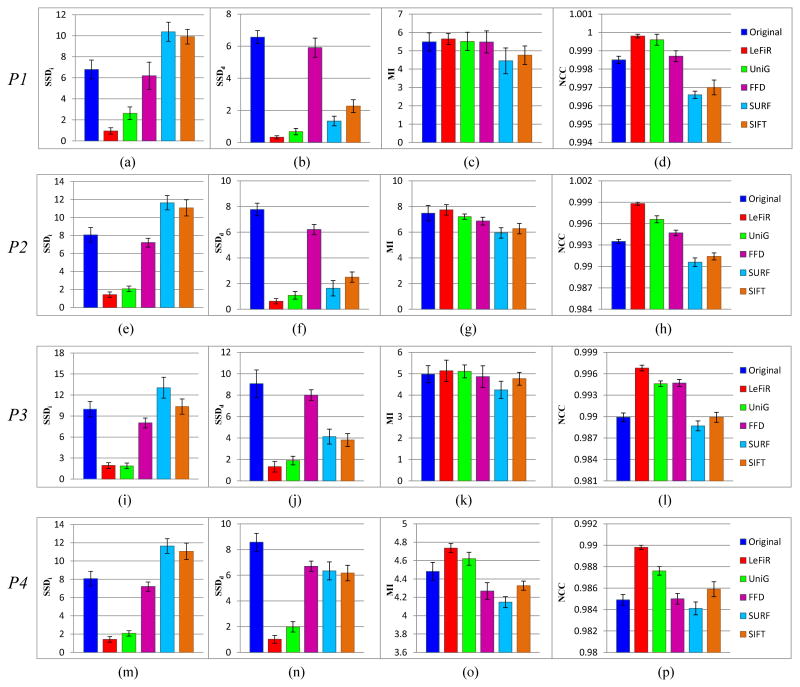
Three popular quality metrics, including mutual information (MI), normalized cross-correlation (NCC), and sum of squared difference [32], were utilized to quantitatively evaluate the registration performance. Two versions of SSD were computed based on different regions of interest. The SSDi was computed between the original and registered images on entire brain region, and SSDd was computed between the deformed regions within the brain on these two images. The SSDd allows to measure the local registration performance inside the deformation region of brain MRI.
5.3. Description of Comparison Methods
There are four methods were used for comparison. A uniform grid (UniG) placement method was applied to brain images where the landmarks are equally displaced within the brain region. A speeded up robust features (SURF)-based landmark detection method [35] employed the SURF features, which are robust local descriptors, to identify informative landmarks. These landmarks were used as control points to drive a TPS registration. A scale-invariant feature transform (SIFT) [36] is a popular descriptor to extract local features in images. A SIFT-based method was employed to automatically identify critical landmarks to perform an image registration. A classic free-form deformation (FFD) approach [19] was also developed to minimize a SSD similarity metric by using B-spline control points to approximate the shape of the intended deformation. The registration results were analyzed in both visual and quantitative evaluations. In addition to evaluating LeFiR in real clinical practice, a traditional Mi-based registration method [37] was implemented for comparison. A linear interpolator was adopted as the scheme for performing intensity based interpolation, and MI was utilized as a similarity measure to drive transformation optimization.
5.4. Evaluation of LeFiR Using SBD
5.4.1. Qualitative results using SBD
The important landmark distributions were studied under various deformation settings and noise levels. Figures 2(a)-(d) show the landmark configurations generated by the LeFiR method using different deformation profiles. For a fair comparison, 200 points were selected for all the methods. Compared to the UniG, FFD, SURF, and SIFT methods, the identified landmarks exhibited high density inside and near the deformed region. This trend was consistently seen across different deformation scenarios. This unique pattern suggested that landmark points within or close to the local constrained de- formed regions can better drive landmark-based registration in comparison to points far away from the deformed region.
Figure 2.
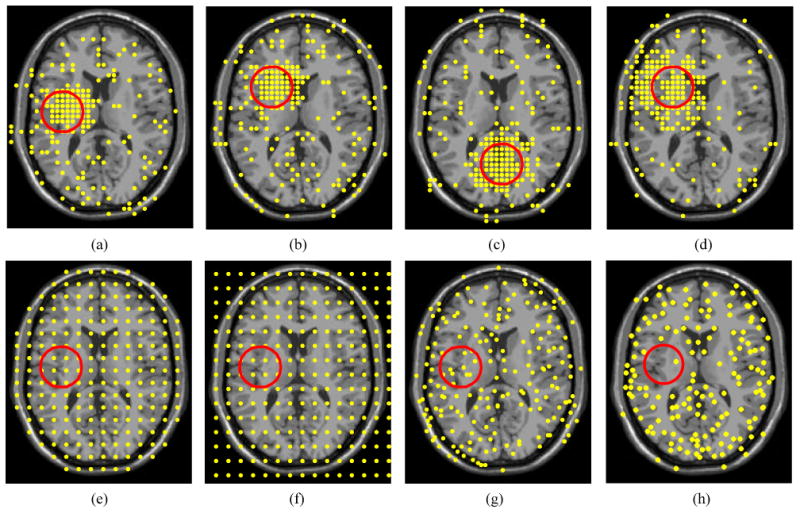
The landmarks are selected by: The LeFiR method under the deformation profiles (a)
 (fi, lm, mm), (b)
 (fo, la, mm), (c)
 (fi, lb, mm), and (d)
 (fi, la, mi); (e) UniG; (f) FFD; (g) SURF; (h) SIFT. The yellow points represent landmarks, and the red circle indicates the deformed region. The landmark configurations generated by the LeFiR method exhibited a unique pattern where the points located within and near the deformed region were selected. Identifying the landmarks in the presence of the deformation could help more accurately drive the registration compared to the UniG, FFD, SURF, and SIFT methods.
The optimal configuration of landmarks was utilized within a TPS registration scheme to register original and deformed brain MRIs. Figure 3 illustrates the difference maps between the original and registered images overlaid on the original brain image. The colorbar on the right side of each figure shows the range of intensity difference values between the original and registered images. Large difference values were encoded in red and small values were encoded in blue. Figures 3(b)-(f) are generated via the five configurations of landmarks shown in Figures 2(a) and (e)-(h), respectively. These five sets of landmarks were obtained using the same deformed MM brain image. By examining the figures, we found that the FFD performed poorly because of insufficient control points selected within the region of deformation to fit the B-spline function. The SIFT-based method also showed poor performance within the deformed region. The SURF-based method was seen to work well within the deformed region but introduced large errors on the brain boundary due to the selection of ambiguous points in this area, then resulting in an incorrect TPS transformation. The UniG method provided a comparable result but showed larger errors (difference range between 0 ∼ 0.23) in the deformed region compared to the LeFiR method (difference range between 0 ∼ 0.12).
Figure 3.
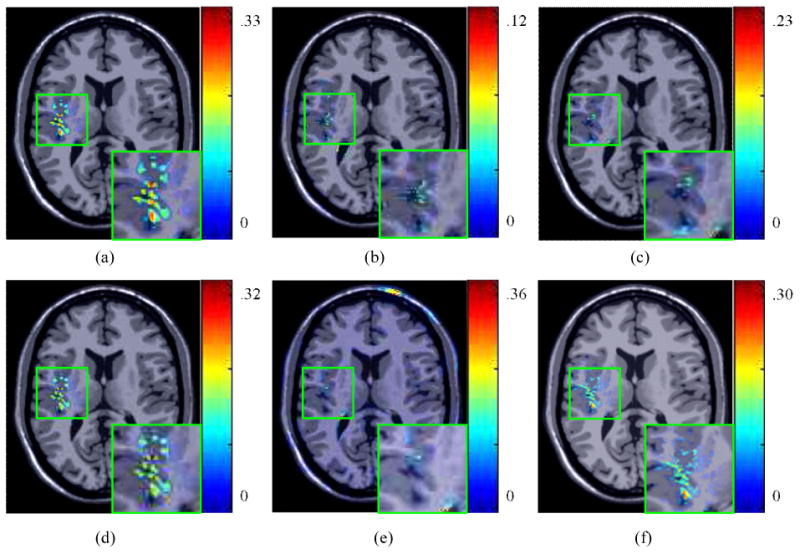
(a) The difference map between the original and deformed images. The difference map between the original and registered images for: (b) LeFiR; (c) UniG; (d) FFD; (e) SURF; (f) SIFT. The difference map is overlaid on the original brain image. The colorbar shows the difference range. The LeFiR method gained the best registration result with the smallest difference range compared to the other three methods.
5.4.2. Quantitative results using SBD
Optimal landmark configurations were learned from different forms of deformation by considering force directions (fi, fo), deformation locations (la, lm, lb), magnitudes of displacement (ms, mm, mi), and different noise levels (1%, 5%, 9%). By varying the deformation factor ℱ and noise level, four types of deformation profiles listed in Table 2 were used to quantitatively evaluate the LeFiR method. Registration performance was measured in terms of 4 distinct quality metrics (SSDi, SSDd, MI, NCC). The average measure scores and associated standard deviations were computed for four methods and compared to the average scores between original and deformed brain images. The higher MI and NCC scores indicate better registration performance, while the lower SSDi and SSDd scores show better results.
Table 2.
Four types of deformation profiles defined to evaluate LeFiR.
| Profile | Force direction | Location | Magnitude | Noise level |
|---|---|---|---|---|
| P1 | fi, fo | lm | mm | 0% |
| P2 | fi | la, lm, lb | mm | 0% |
| P3 | fi | lm | ms, mm, ml | 0% |
| P4 | fi | lm | mm | 1%, 5%, 9% |
Figure 4 shows the quantitative results for the LeFiR method compared to the other three methods under the deformation profiles defined in Table 2. By inspecting the figures, we found that the LeFiR method significantly improved the SSD measure on both global nonrigid registration and local deformation with average 82% and 90% improvement over the original deformation across four deformation profiles, respectively. The UniG method also demonstrated good registration performance with improvement of 73% and 82% on average SSDi and SSDd, respectively. However, the SURF-based method was able to recover the local deformation, while introduced large distortion beyond the deformation site, which can be visually inspected on Figure 3(e). The SIFT-based method outperformed SURF in global registration while had poor performance in local deformation. The FFD method had the worst performance measured by SSDd in all the experiments. The MI and NCC metrics indicate that the LeFiR method yielded better results compared to the other methods although the difference was less distinguishable than the SSD metric shown in Figure 4. Again, the SURF-based method yielded the worst MI and NCC scores due to the registration distortion caused by TPS interpolation.
Figure 4.
The comparison results under four designed experiments (P1-P4) using four methods measured by: (a),(e),(i),(m) SSDi; (b),(f),(j),(n) SSDd; (c),(g),(k),(o) MI; (d),(h),(l),(p) NCC. In each figure, the first bar is the measure score computed between the original and deformed images. The LeFiR method outperformed the other four methods using these four metrics, especially in SSDd that measures the accuracy of recovering the local deformation. LeFiR yielded average 90% improvement on the original deformation, and 84% for the FFD, 63% for the SURF, 59% for the SIFT, and 10% for the UniG.
Figures 4(m)-(p) demonstrate the registration results using these five methods in the context of noisy brain images. It is worth noting that the LeFiR method consistently works well in both global and local registration on noisy images. The stable performance is due to the fact that LeFiR only takes into account spatial information during the registration performance, therefore, the effect of noise reflected on the variance of image intensities cannot affect the registration results of LeFiR. We also notice that the SURF-based method yielded worse results compared to its performance in the experiments P1-P3, especially in the measure of SSDd. The registration methods, such as SURF-based method, which utilize image-dependent features to detect landmark locations, could lead to poor performance in the presence of heavy noise.
5.5. Performance and Computation Analysis of LeFiR Using SBD
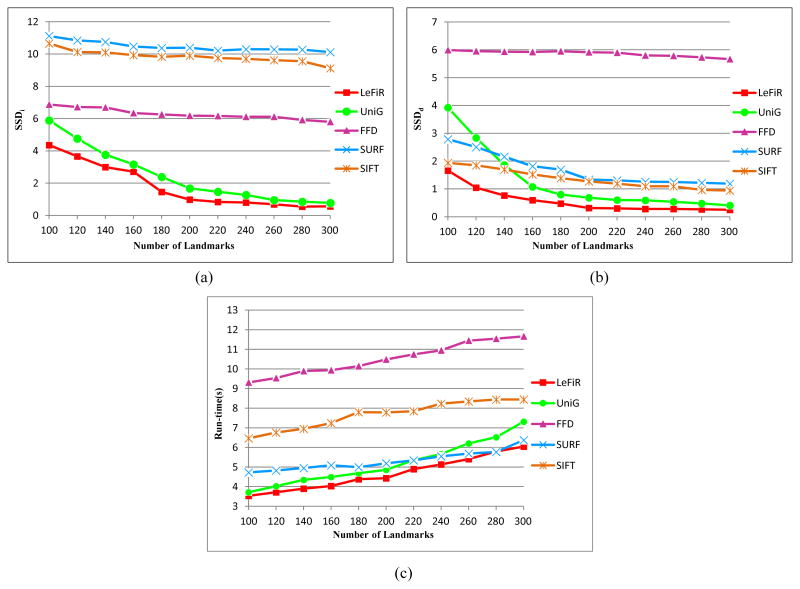
To verify the effect of different numbers of landmarks on the registration performance and computational complexity using LeFiR, Figure 5 shows the comparison results using the LeFiR, UniG, SURF, SIFT, and FFD methods by increasing the number of selected landmarks each time to be used in the registration process. The trend of curves in Figures 5(a), (b) illustrates improved registration performance (decreased SSD measure values) for the LeFiR, UniG, SURF, SIFT, and FFD methods as the number of selected landmarks was increased.
Figure 5.
Registration results for LeFiR, UniG, SURF, SIFT, and FFD using different numbers of landmarks measured by: (a) SSDi; (b) SSDd; (c) shows the corresponding computational times for these five methods. The comparison results suggested that the UniG, SURF, SIFT, and FFD methods required higher dense sampling of the grid and longer computational times to obtain the same level of registration performance as LeFiR.
Further, the computational complexity of these five methods was measured using the Matlab code on an Intel Core2 2.67GHz machines with a 4GB RAM. The corresponding running times are shown in Figure 5(c). All methods exhibit longer computational time when more landmarks were used in registration. However, the figure shows that running times for UniG increase more sharply compared to LeFiR, because a more complicated interpolation is needed for UniG in the TPS registration. The figures suggested that the UniG, SURF, SIFT, and FFD methods required higher dense grid sampling and longer computational time to yield the same level of registration performance as the LeFiR. The quantitative results confirm that the LeFiR method is capable of accurately recovering the local deformation as well as providing a superior global registration. This makes LeFiR uniquely desirable to register pre- and post-treatment brain images where the deformation site is known and the deformation region is localized.
5.6. Co-registering Pre- and Post-LITT Brain MRI in GBM
The LeFiR method was validated on two patient studies (named “GBM-1” and “GBM-2”) who were diagnosed with GBM and who have undergone LITT and had a pre- and post-LITT multi-parametric MRI exam done. In this study we looked at only registering the T1-weighted MRI for the multi-parametric MRI exam pre- and post-LITT for the two GBM patients. Tumor was localized to one side (as shown in Figure 6(a)) and the bottom (as shown in Figure 6(e)) of the brain. For a pair of pre- and post-LITT brain images {
 pre,
pre,
 post}, a simple thresholding method was employed to produce a binary mask
 for each of {
 ,
,
 ,
,
 pre,
pre,
 post}. The pre- and post-LITT brain MRI were then aligned to the synthetic brain image pair {
 ,
,
 }, respectively, by matching the binary masks of two images. Hence, the identified training landmark fiducials can be applied to a unseen dataset via an affine transform. The location of the tumor site and tumor size ware then used to predict the optimal landmark configuration. Finally, the predicted landmark sets were utilized to register the pre- and post-LITT MRIs.
Figure 6.
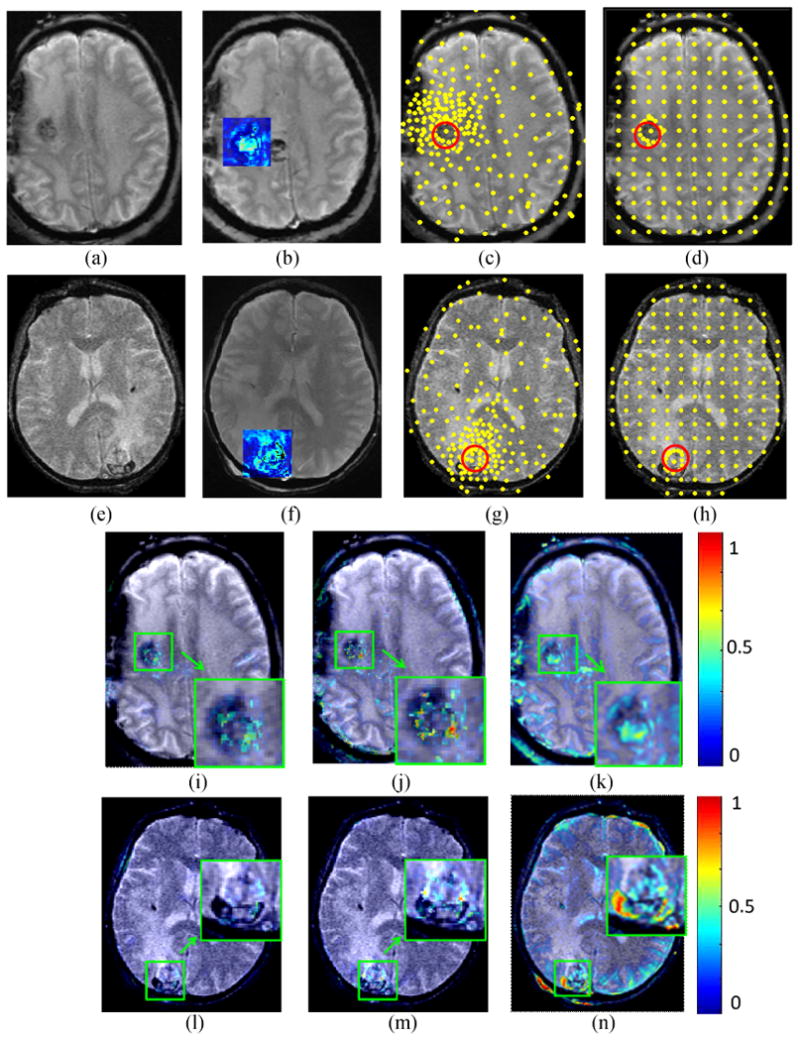
The first and second rows show two different registration experiments performed on “GBM-1” and “GBM-2”, respectively. Figures 6 (a),(b) and (e),(f) show pre- and post-LITT brain MR images. The blue square shows the difference between the pre- and post image encoded by color values. Figures 6 (c),(d) and (g),(h) demonstrate the landmarks (yellow points) generated by the LeFiR and UniG methods, respectively. The red circle indicates the deformation site. Figure 6 (i),(j),(k) and (l),(m),(n) show the difference maps between the registered and pre-LITT images using LeFiR, UniG, and Mi-based method, respectively. Note that LeFiR yielded a better registration quality compared to UniG and MI-based method.
Figures 6(i)-(n) show the difference maps between the registered and pre-LITT MRIs which were encoded via a color bar and overlaid on the original pre-LITT MRI. The large differences of image intensity were represented in red and small differences were represented in blue. Table 3 shows the measure scores for these two patient studies using four different quality matric. The LeFiR method yielded superior registration results with {SSDi, SSDd} of {8.94, 5.33} for “GBM-1”, and {12.75, 7.89} for “GBM-2”, respectively, compared to {16.78, 9.46} and {17.55, 12.32} obtained from the UniG method, and {25.27, 16.38} and {32.46, 23.26} from the MI-based method. The performance scores were consistent with the visual examination of the difference maps displayed in Figures 6(i)-(n). The experimental results illustrated that the real localized deformation induced by LITT was better recovered by the LeFiR method than simply uniformly picking landmarks or using image intensities.
Table 3.
Measure scores using the LeFiR and UniG methods for evaluating registration between pre- and post-LITT brain MRI on GBM and Epilepsy patient data.
| Methods | SSDi | SSDd | MI | NCC |
|---|---|---|---|---|
| GBM-1 | ||||
| LeFiR | 8.94 | 5.33 | 5.34 | 0.89 |
| UniG | 16.78 | 9.46 | 5.01 | 0.88 |
| MI-based | 25.27 | 16.38 | 3.67 | 0.82 |
| GBM-2 | ||||
| LeFiR | 12.75 | 7.89 | 4.89 | 0.85 |
| UniG | 17.55 | 12.32 | 4.43 | 0.83 |
| MI-based | 32.46 | 23.26 | 4.03 | 0.79 |
| Epilepsy-1 | ||||
| LeFiR | 9.75 | 6.38 | 5.23 | 0.87 |
| UniG | 12.08 | 8.55 | 4.80 | 0.85 |
| MI-based | 20.57 | 9.16 | 4.32 | 0.81 |
| Epilepsy-2 | ||||
| LeFiR | 8.21 | 4.96 | 5.78 | 0.90 |
| UniG | 10.17 | 5.54 | 5.48 | 0.89 |
| MI-based | 23.69 | 7.89 | 4.56 | 0.83 |
5.7. Co-registering Pre- and Post-LITT MRI in Epilepsy
Unlike the GBM examples shown in Figures 6, the post-LITT brain MRI acquired from the epilepsy patients clearly exhibited an ablation (deformation) zone contour within the corresponding location of epileptogenic foci shown in the post-LITT MRIs (Figures 7(b),(f)). Similar to the GBM images, an affine transformation was applied to the pre- and post-LITT epilepsy MRIs in order to register the original and deformed synthetic brain images via a mask matching method. The landmark configurations obtained from the learning process on SBD were applied to the epilepsy images by transforming the landmark set to the location of epileptogenic foci.
Figure 7.
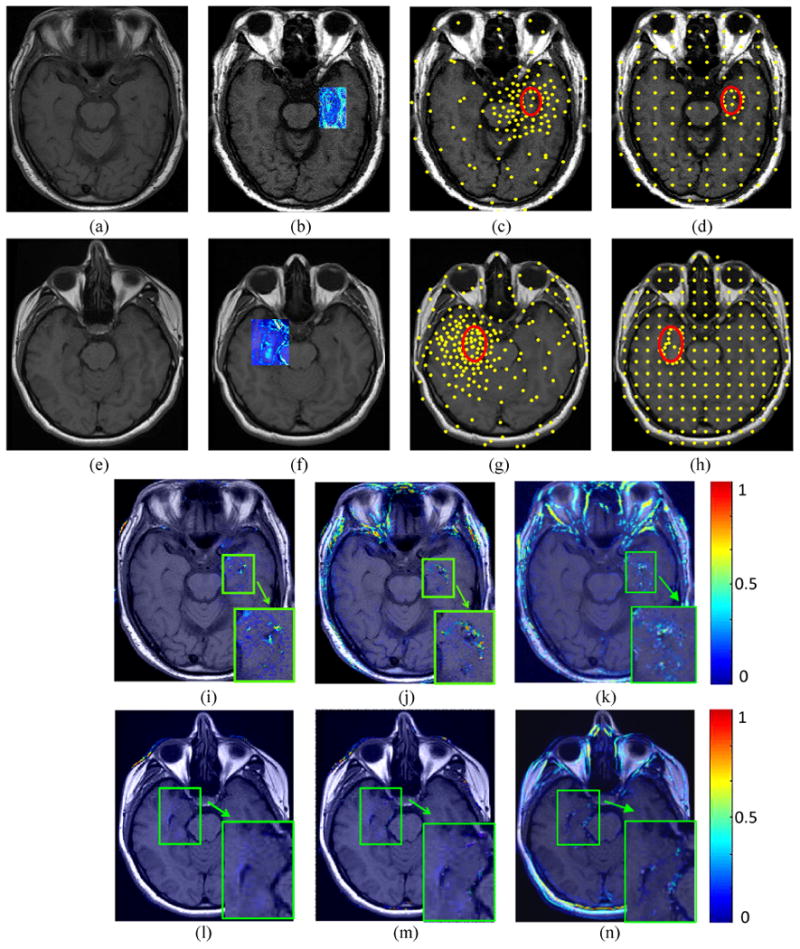
The first and second rows show two different registration experiments performed on “Epilepsy-1” and “Epilepsy-2”, respectively. Figures 7 (a),(b) and (e),(f) show pre- and post-LITT brain MR images. The blue square shows the difference between the pre- and post image encoded by color values. Figures 7 (c), (d) and (g), (h) demonstrate the landmarks (yellow points) generated by the LeFiR and UniG methods, respectively. The red circle indicates the ablation zone. Figures 7 (i),(j),(k) and (l),(m),(n) show the difference images between the registered and pre-LITT images using LeFiR, UniG, and Mi-based method, respectively. Note that LeFiR yielded a better registration quality compared to UniG and Mi-based method.
The Figure 7 shows the results of registering two pairs of pre- and post-LITT MR images by using the LeFiR (Figures 7(i), (l)), UniG (Figures 7(j), (m)), and Mi-based (Figures 7(k), (n)) for two patients with epilepsy. Here these two patient studies are given the names of “Epilepsy-1” and “Epilepsy-2”. The LeFiR (Figures 7(c), (g)), UniG (Figures 7(d), (h)), and MI-based method yielded SSDi values of 9.75, 12.08, and 20.57, and SSDd values of 6.38, 8.55, and 9.16 for “Epilepsy-1”, and SSDi values of 8.21, 10.17, and 23.69, and SSDd values of 4.96, 5.54, and 7.89 for “Epilepsy-2”, respectively. The MI and NCC measure scores are also displayed in Table 3. Again, the LeFiR method achieves the best registration performance in terms of SSDi, SSDd, MI, and NCC. These quantitative values were consistent with the visual examination of the difference images between the registered and pre-LITT images shown in Figures 7(i), (l) compared to the UniG (Figures 7(j), (m)), and the MI-based method (Figures 7(k), (n)).
6. Concluding Remarks and Future Work
In this paper, we introduced a novel landmark based image registration scheme using the prior knowledge of the learned landmark configurations to automatically determine informative landmarks for driving a non-rigid image registration. We also investigated a key problem concerning the nature of landmark choices in relation to different aspects of the deformation, such as force direction, magnitude of displacement, deformation location, and native imaging artifacts of noise. An optimal landmark set was identified through iterative simulations and used as a training configuration to predict critical landmark locations for images with different deformation sites. The new landmarks are determined by simply transforming the training landmark set to the current deformation location while preserving the topological structure of the configuration of landmarks. The qualitative results confirmed that those configurations where the landmarks were either within or in close proximity of the deformed region in the image were more important to ensure an optimal registration result, compared to the points far away from the site of deformation. The quantitative results demonstrated that the LeFiR method achieved superior performance in global-to-local nonrigid brain MR image registration with average 82% improvement on the global registration and 90% improvement on the local deformation, respectively.
The primary application of this work will be in the registration of pre- and post-radiation treatment brain MR images acquired from patients suffering from aggressive brain diseases, such as GBM, epilepsy. For such patients, the site of deformation (i.e., location of GBM, epileptogenic foci) is known. MRI-guided LITT provides a minimally invasive therapy for precise removal of focal abnormality. It has become a promising option of treatment for neurological disorders (e.g., brain tumors, epilepsy). Registration of pre- and post-LITT MM is essential to capture and evaluate the subtle changes on the MM following LITT. The LeFiR algorithm was tested under these two clinically realistic deformations induced by the LITT treatment. The experimental results showed LeFiR was able to enhance registration performance, but also able to precisely capture the localized nature of deformation.
The work presented here was only evaluated on two limited sets of clinical data in the neurological diseases of GBM and epilepsy under LITT treatment. For a specific disease, due to lack of ground truth of tissue deformation caused by LITT, the characteristics of post-LITT changes (reflected on MRI) within the ablation zone, such as intensity variation, textural changes, were not considered and studied in the LeFiR algorithm. In addition, establishment of corresponding landmarks between pre- and post-LITT MRIs was only determined by aligning to the landmark fiducials obtained from the training synthetic original and deformed brain images. Although this simple landmark matching method has showed good registration performance in registering pre- and post-LITT images for GBM and epilepsy, the larger magnitude of deformation possibly induced by laser ablation might lead to incorrect correspondence between landmarks, which could affect the accuracy of TPS interpolation between the corresponding landmarks.
One immediate future study that we are envisioning is to more realistically model the treatment deformations induced based on what is typically observable following radiation or laser therapy for treatment of brain tumors. This will allow for a precise model of the imaging changes prior to and after kinds of treatment (e.g. radiation, focal therapy, chemotherapy). With a large enough cohort we could also control for disease status (stage, grade) and molecular status (e.g. IDH1, MGMT). Moreover, localized intensity-related features can be integrated into the registration process to improve the accuracy of landmark correspondence. We believe that the nature of local deformation can be more precisely learned and modeled via an intelligent landmark location detection method based on both spatial and intensity features.
Acknowledgments
This work was made possible via grants from the National Cancer Institute under award numbers R01CA13653501, R01CA14077201, and R21CA16 7811; the National Institute of Biomedical Imaging and Bioengineering of the National Institutes of Health under award number R43EB015199-01; the National Science Foundation under award number IIP-1248316; the QED award from the University City Science Center and Rutgers University.
Biography

Dr. Tao Wan is an Assistant Professor at Beihang University, Beijing. Dr. Wan was a research associate at the Case Western Reserve University and a postdoctoral associate at the Boston University School of Medicine. She received her Master degree in Global Computing and Multimedia from the Bristol University, UK in 2004 and her Ph.D. in Computer Science from the same university in 2009. She spent one year working as a senior researcher in the Samsung Advanced Institute of Technology (SAIT), China before becoming a visiting scholar in the Visualization and Image Analysis Lab in the Robotics Institute, Carnegie Mellon University. Her research interests are statistical models for image segmentation, fusion, and denoising, machine learning, medical image analysis, computer-aided diagnosis and prognosis system.
Dr. B.Nicolas Bloch is an Assistant Professor of Radiology at the Boston University School of Medicine. Dr. Bloch is also a director of MRI and a radiologist in Breast Imaging Section at Boston Medical Center. He was a radiology clinician researcher at the Beth Israel Deaconess Medical Center and an instructor in Radiology at the Harvard Medical School. His research interests are prostate and breast imaging, biomarkers and MRI imaging, image guided interventions, cancer genotype-imaging phenotype studies.

Dr. Shabbar Danish is an Assistant Professor at the Division of Neurosurgery, and the Director of Stereotactic and Functional Neurosurgery at the Robert Wood Johnson Medical School, New Jersey. Dr. Danish received his Bachelors Degree from Rutgers University in 1997 and his M.D. from the UMDNJ-Robert Wood Johnson Medical School in 2001. Dr. Danish obtained his neurosurgical training at the University of Pennsylvania, along with fellowship training in Stereotactic and Functional Neurosurgery and GammaKnife Radiosurgery. His research interests are gliomas, metastatic brain tumors, and radiosurgery.

Dr. Anant Madabhushi is the Director of the Center for Computational Imaging and Personalized Diagnostics (CCIPD) and an Associate Professor in the Department of Biomedical Engineering, Case Western Reserve University. Dr. Madabhushi received his Bachelors Degree in Biomedical Engineering from Mumbai University, India in 1998 and his Masters in Biomedical Engineering from the University of Texas, Austin in 2000. In 2004 he obtained his PhD in Bioengineering from the University of Pennsylvania. He joined the Department of Biomedical Engineering, Rutgers University as an Assistant Professor in 2005. He was promoted to Associate Professor with Tenure in 2010. In 2012 he accepted the position of Associate Professor at Case Western Reserve University, Department of Biomedical Engineering and will be directing a center on computational imaging and personalized diagnostics. Dr. Madabhushi has authored over 175 peer-reviewed publications in leading international journals and conferences. He has 4 issued patents with 15 patents pending in the areas of medical image analysis, computer-aided diagnosis, and computer vision.
Footnotes
Publisher's Disclaimer: This is a PDF file of an unedited manuscript that has been accepted for publication. As a service to our customers we are providing this early version of the manuscript. The manuscript will undergo copyediting, typesetting, and review of the resulting proof before it is published in its final citable form. Please note that during the production process errors may be discovered which could affect the content, and all legal disclaimers that apply to the journal pertain.
References
- 1.Carpentier A, Chauvet D, Reina V, Beccaria K, Leclerq D, McNichols RJ, Gowda A, Cornu P, Delattre JV. MR-guided laser-induced thermal therapy (LITT) for recurrent glioblastomas. Lasers in Surgery and Medicine. 2012;44:361–368. doi: 10.1002/lsm.22025. [DOI] [PubMed] [Google Scholar]
- 2.Tellez-Zenteno JF, Ronquillo LH, Moien-Afshari F, Wiebe S. Surgical outcomes in lesional and non-lesional epilepsy: A systematic review and meta-analysis. Epilepsy Research. 2010;89:310–318. doi: 10.1016/j.eplepsyres.2010.02.007. [DOI] [PubMed] [Google Scholar]
- 3.Schwarzmaier HJ, Eickmeyer F, Fiedler VU, Ulrich F. Basic principles of laser induced interstitial thermotherapy in brain tumors. Medical Laser Application. 2002;17:147–158. [Google Scholar]
- 4.Gannon CJ, Curley SA. The role of focal liver ablation in the treatment of unresectable primary and secondary malignant liver tumors. Seminars in Radiation Oncology. 2005;15:265–272. doi: 10.1016/j.semradonc.2005.04.004. [DOI] [PubMed] [Google Scholar]
- 5.Stafford RJ, Shetty A, Elliott AM, Klumpp SA, McNichols RJ, Gowda A, Hazle JD, Ward JF. Magnetic resonance guilded, focal laser induced interstitial thermal therapy in a canine prostate model. The Journal of Urology. 2010;184:1514–1520. doi: 10.1016/j.juro.2010.05.091. [DOI] [PMC free article] [PubMed] [Google Scholar]
- 6.Haraldsdottir KH, Ivarsson K, Gotberg S, Ingvar C, Stenram U, Tranberg KG. Interstitial laser thermotherapy (ILT) of breast cancer. European Journal of Surgical Oncology. 2008;34:739–745. doi: 10.1016/j.ejso.2008.01.008. [DOI] [PubMed] [Google Scholar]
- 7.Xu H, Jiang M, Yang M. A new landmark selection method for non-rigid registration of medical brain images. Proc of Int Conf on Signal Processing. 2010:920–923. [Google Scholar]
- 8.Rohr K, Stiehl HS, Sprengel R, Buzug TM, Weese J, Kuhn MH. Landmark-Based elastic registration using approximating thin-Plate splines. IEEE Trans Med Imaging. 2001;20:526–534. doi: 10.1109/42.929618. [DOI] [PubMed] [Google Scholar]
- 9.Sun W, Zhou W, Yang M. Medical image registration using thin-Plate spline for automatically detecting and matching of point sets. Proc of Int Conf on Bioinformatics and Biomedical Engineering. 2011:1–4. [Google Scholar]
- 10.Liu Y, Sajja BR, Uberti MG, Gendelman HE, Kielian T, Boska MD. Landmark optimization using local curvature for point-based nonlinear rodent brain image registration. Int J Biomed Imaging. 2012;1:1–8. doi: 10.1155/2012/635207. [DOI] [PMC free article] [PubMed] [Google Scholar]
- 11.Guo Y, Zhan Y, Gao Y, Jiang J, Shen D. MR prostate segmentation via distributed discriminative dictionary (DDD) learning. Proc of IEEE Int Symposium on Biomedical Imaging. 2013:856–859. doi: 10.1109/ISBI.2013.6556613. [DOI] [PMC free article] [PubMed] [Google Scholar]
- 12.Kim M, Wu G, Yap PT, Shen D. A general fast registration framework by learning deformation-appearance correlation. IEEE Trans Image Processing. 2012;21:1823–1833. doi: 10.1109/TIP.2011.2170698. [DOI] [PMC free article] [PubMed] [Google Scholar]
- 13.Guo Y, Wu G, Jiang J, Shen D. Robust anatomical correspondence detection by hierarchical sparse graph matching. IEEE Trans Med Imaging. 2013;32:268–277. doi: 10.1109/TMI.2012.2223710. [DOI] [PMC free article] [PubMed] [Google Scholar]
- 14.Maintz JBA, Viergever MA. A survey of medical image registration. Medical Image Analysis. 1998;2:1–36. doi: 10.1016/s1361-8415(01)80026-8. [DOI] [PubMed] [Google Scholar]
- 15.Lorenz C, Krahnstover N. Generation of point-based 3-d statistical shape models for anatomical objects. Computer Vision and Image Understanding. 2000;77:175–191. [Google Scholar]
- 16.Lombaert H, Sun Y, Cheriet F. Landmark-based non-rigid registration via graph cuts. Proc of the Int Conf on Image Analysis and Recognition. 2007;4633:166–175. [Google Scholar]
- 17.Levis J, Hwang HJ, Neumann U, Enciso R. Smart point landmark distribution for thin-plate splines, in: Medical Imaging Image Processing. Proc of SPIE. 2004;5370:1236–1243. [Google Scholar]
- 18.Xie Z, Farin GE. Image registration using hierarchical B-splines. IEEE Trans Visualization and Computer Graphics. 2004;10:1–10. doi: 10.1109/TVCG.2004.1260760. [DOI] [PubMed] [Google Scholar]
- 19.Tustison NJ, Avants BB, Gee JC. Directly manipulated free-form deformation image registration. IEEE Trans Image Processing. 2009;18:624–635. doi: 10.1109/TIP.2008.2010072. [DOI] [PubMed] [Google Scholar]
- 20.Zitova B, Flusser J. Image registration methods: A survey. Image and Vision Computing. 2003;21:977–1000. [Google Scholar]
- 21.Kurkure U, Le YH, Paragios N, Carson JP, Ju T, Kakadiaris IA. Landmarkimage-based deformable registration of gene expression data. Proc of IEEE Int Conf on Computer Vision and Pattern Recognition. 2011:1089–1096. doi: 10.1109/CVPR.2011.5995708. [DOI] [PMC free article] [PubMed] [Google Scholar]
- 22.Frantz S, Rohr K, Stiehl HS. Localization of 3D anatomical point landmarks in 3d tomographic images using deformable models. Proc of MICCAI. 2000;1935:492–501. [Google Scholar]
- 23.Betke M, Hong H, Thomas D, Prince C, Ko JP. Landmark detection in the chest and registration of lung surfaces with an application to nodule registration. Medical Image Analysis. 2003;7:265–281. doi: 10.1016/s1361-8415(03)00007-0. [DOI] [PubMed] [Google Scholar]
- 24.Richberg AS, Werner R, Ehrhardt J, Wolf JC, Handels H. Landmark-driven parameter optimization for non-linear image registration. Proc of SPIE. 2011;7962:1–8. [Google Scholar]
- 25.Gu Z, Qin B. Nonrigid registration of brain tumor resection mr images based on joint saliency map and keypoint clustering. Sensors. 2009;9:10270–10290. doi: 10.3390/s91210270. [DOI] [PMC free article] [PubMed] [Google Scholar]
- 26.Neu SC, Toga AW. Automatic localization of anatomical point landmarks for brain image processing algorithms. Neuroinformatics. 2008;6:135–148. doi: 10.1007/s12021-008-9018-x. [DOI] [PMC free article] [PubMed] [Google Scholar]
- 27.Milan JS. Handbook of Medical Imaging Medical Image Processing and Analysis. SPIE. 2009 [Google Scholar]
- 28.Johnson HJ, Christensen GE. Consistent landmark and intensity-Based image registration. IEEE Trans Med Imaging. 2002;21:450–451. doi: 10.1109/TMI.2002.1009381. [DOI] [PubMed] [Google Scholar]
- 29.Joshi SC, Miller MI, Christensen GE, Banerjee A, Coogan T, Grenander U. Hierarchical brain mapping via a generalized Dirichlet soluction for mapping brain manifolds. Proc of SPIE. 1995:278–289. [Google Scholar]
- 30.Bookstein FL. Principal warps Thin-plate splines and the decomposition of deformations. IEEE Trans Pattern Analysis and Machine Intelligence. 1989;11:567–85. [Google Scholar]
- 31.Bartoli A, Zisserman A. Direct estimation of non-rigid registrations. Proc of BMVC. 2004;2:899–908. [Google Scholar]
- 32.Milan S, Fitzpatick JM. Handbook of medical imaging: Medical image processing and analysis, SPIE. Washington, USA: 2009. [Google Scholar]
- 33.Myronenko A, Song X. Point set registration: Coherent point drift. IEEE Trans Pattern Analysis and Machine Intelligence. 2010;32:2262–2275. doi: 10.1109/TPAMI.2010.46. [DOI] [PubMed] [Google Scholar]
- 34.Cocosco CA, Kollokian V, Kwan RKS, Pike GB, Evans AC. Brain-web: Online interface to a 3D MRI simulated brain database. Neurolmage. 1997;5:425. [Google Scholar]
- 35.Bay H, Ess A, Tuytelaars T, Gool LV. Surf: Speeded up robust features. Computer Vision and Image Understanding. 2008;110:346–359. [Google Scholar]
- 36.Lowe DG. Distinctive image features from scale-invariant keypoints. International Journal of Computer Vision. 2004;60:91–110. [Google Scholar]
- 37.Pluim JPW, Maintz JBA, Viergever MA. Mutual-information-based registration of medical images: A survey. IEEE Trans Med Imaging. 2003;22:986–1004. doi: 10.1109/TMI.2003.815867. [DOI] [PubMed] [Google Scholar]


