

Abstract
Hereditary mutations in the transforming growth factor beta induced (TGFBI) gene cause phenotypically distinct corneal dystrophies characterized by protein deposition in cornea. We show here that the Arg555Trp mutant of the fourth fasciclin 1 (FAS1-4) domain of the protein (TGFBIp/keratoepithelin/βig-h3), associated with granular corneal dystrophy type 1, is significantly less susceptible to proteolysis by thermolysin and trypsin than the WT domain. High-resolution liquid-state NMR of the WT and Arg555Trp mutant FAS1-4 domains revealed very similar structures except for the region around position 555. The Arg555Trp substitution causes Trp555 to be buried in an otherwise empty hydrophobic cavity of the FAS1-4 domain. The first thermolysin cleavage in the core of the FAS1-4 domain occurs on the N-terminal side of Leu558 adjacent to the Arg555 mutation. MD simulations indicated that the C-terminal end of helix α3′ containing this cleavage site is less flexible in the mutant domain, explaining the observed proteolytic resistance. This structural change also alters the electrostatic properties, which may explain increased propensity of the mutant to aggregate in vitro with 2,2,2-trifluoroethanol. Based on our results we propose that the Arg555Trp mutation disrupts the normal degradation/turnover of corneal TGFBIp, leading to accumulation and increased propensity to aggregate through electrostatic interactions.
Keywords: Transforming growth factor beta induced protein (TGFBIp), corneal dystrophy, protein aggregation, protein misfolding diseases, proteolytic degradation, NMR structure
1. Introduction
Transforming growth factor beta induced protein (TGFBIp; also called keratoepithelin or βig-h3), is found in the extracellular matrix of several tissues in the human body, but is especially abundant in the cornea [1–4]. TGFBIp is a 68 kDa protein consisting of an N-terminal cysteine-rich EMILIN-1 (EMI) domain [5] and four homologous fasciclin 1 (FAS1) domains of approximately 140 residues [6]. Mutations in the transforming growth factor beta induced (TGFBI) gene, encoding TGFBIp, are associated with protein aggregation in the cornea [7, 8]. To date, at least 30 mutations in TGFBI are known to cause corneal dystrophies. A unique property of TGFBIp compared to other proteins linked to hereditary protein misfolding diseases is that specific single-point mutations in TGFBI consistently cause phenotypically different corneal dystrophies related to the nature of the protein aggregates. The different phenotypes include lattice corneal dystrophy (LCD) type 1 and its variants, which are characterized by formation of TGFBIp amyloid, different types of granular corneal dystrophy (GCD) typified by accumulation and deposition of TGFBIp in non-amyloid granular opacities in the cornea [9], and Thiel-Behnke corneal dystrophy (TBCD) characterized by deposition of curly fibres in the superficial cornea [7].
The structural basis for the different types of TGFBIp depositions remains unknown. However, recent studies of normal and mutant TGFBIp variants from human corneas suggest that proteolytic degradation of TGFBIp plays a significant role in the pathobiology of the TGFBI-linked cornea dystrophies. In the normal human cornea, TGFBIp is proteolytically processed in a highly orchestrated manner and the observed fragments strongly suggest that proteolysis of the FAS1-4 domain (residues Val505–Leu632) plays a key role in the turnover of TGFBIp in the cornea [10]. However, in TGFBI-linked corneal dystrophies the processing of TGFBIp is altered and different mutations are associated with specific changes in the degradation pattern [11] and proteolytic cleavage sites [12]. In a previous in vitro study, we showed that the FAS1-4 domain is the most proteolytic susceptible of the four FAS1 domains in full-length WT TGFBIp and phenotypically distinct mutations in the FAS1-4 domain alter the thermodynamic stability of the domain [13].
In the present study, we have investigated the altered proteolytic susceptibility of the FAS1-4 domain with reference to the structural changes caused by mutation Arg555Trp in TGFBIp. This mutation causes GCD type 1, which is one of the most common TGFBI-linked cornea dystrophies [14–16]. We show by limited proteolysis that the most susceptible thermolysin as well as tryptic cleavage site in the WT fourth FAS1 domain is between residues Arg557 and Leu558 positioned right next to the mutation site Arg555 while the Arg555Trp mutant FAS1-4 domain is resistant to proteolysis. To explore these observations in detail, we have determined the high-resolution structures of the isolated WT and Arg555Trp mutant FAS1-4 domains by liquid-state NMR spectroscopy. Our data reveal very similar overall structures of the WT and the Arg555Trp mutant domains. However, while residue Arg555 is solvent exposed in the WT structure, Trp555 of the mutant domain is buried in the hydrophobic cavity formed by helices α1, α3, α3′, and α4 thereby stabilizing the overall structure.
The dynamical behaviours of the WT and Arg555Trp variants of the FAS1-4 domain were further addressed through long time-scale molecular dynamics (MD) simulations and NMR relaxation studies. The MD simulations support the finding from the NMR structure that the hydrophobic Trp555 side chain of the Arg555Trp mutant stabilizes the structure. Significantly, the C-terminal end of helix α3′ containing the protease-accessible residues Arg557 and Leu558, and the subsequent loop are more rigid in the Arg555Trp mutant domain compared to the WT FAS1-4 domain, which explains the increased proteolytic resistance of the mutant domain. Furthermore, calculations of the electrostatic potential of the two NMR structures reveal differences in the electrostatic surface potential, which are consistent with the increased propensity of the Arg555Trp mutant domain to aggregate through electrostatic interactions in vitro.
Based on our results, we propose that the Arg555Trp mutation in TGFBIp both disrupts the degradation/turnover and increases the aggregation propensity of TGFBIp, which concomitantly lead to its accumulation and deposition in the GCD type 1 corneas.
2. Material and methods
See the Supplementary Experimental Procedures for additional details.
2.1. Expression and Purification
The FAS1-4 constructs were generated as previously described [13] with the WT and Arg555Trp constructs consisting of residues 502–634. An additional full-length WT FAS1-4 domain, residues 502–657, was also made. For all constructs, an Ala-Gly dipeptide was included at the N-terminus to facilitate cleavage by the SUMO protease (see details in Supplementary Experimental Procedures). 13C,15N-labeled proteins were prepared by transferring one colony of transformed cells to a 50 mL solution of Lysogeny broth (LB) media with antibiotic. The solution was incubated overnight at 37 °C with shaking. Thereafter, the LB medium was stepwise diluted into 4 L M9 minimal medium containing 13C-glucose and 15NH4Cl to obtain uniformly 13C,15N-labeled protein. When the optical density at 600 nm (OD600) reached approximately 0.7, the protein expression was induced by adding 200 mg isopropyl β-D-1-thiogalactopyranoside (IPTG) pr. litre medium. When OD600 had reached a stable value the cells were harvested by spinning at 6000 rpm for 15 minutes.
The proteins were purified as previously described [13]. Following purification, the WT and Arg555Trp mutant proteins were dialyzed against a 50 mM phosphate buffer containing 100 mM NaCl, 50 mM arginine, and 50 mM glutamate in order to prevent protein aggregation [17]. The protein solutions were concentrated with Centricons (Amicon, Inc., Beverly, MA, USA) with a molecular weight cut-off of 10 kDa to yield protein concentrations of approximately 4 mg/mL. 2,2-Dimethyl-2-silapentane-5-sulfonate (DSS) was added for chemical shift reference, NaN3 to avoid bacterial growth, and D2O to provide field lock. The final concentrations were 0.5 mM, 0.5%, and 10% for DSS, NaN3, and D2O, respectively. The samples were transferred to a Wilmad 541-pp NMR tube. The sample volumes were 550 μL.
2.2. Limited Proteolysis, Polyacrylamide Gel analyses, and Edman Degradation
Proteolytic fragments were separated by sodium dodecyl-polyacrylamide gel electrophoresis (SDS-PAGE) in 10–15% polyacrylamide gels [18]. Samples were reduced using 30 mM dithiothreitol (DTT) and boiled in 1% SDS prior to electrophoresis. The proteolytic susceptibilities of the domains were investigated using thermolysin proteolysis (preference for cleavage at the N-termini of residues L, I, F, V, A, M). The FAS1-4 domain variants were incubated for one hour with increasing amounts of thermolysin, ranging from thermolysin:FAS1-4 domain ratio 1:1000 to 1:1 (w/w). Subsequently, proteolysis was quenched by inhibiting thermolysin with 5 mM EDTA for 15 minutes at room temperature. For N-terminal sequencing the proteolytic fragments of the FAS1-4 domains were separated by SDS-PAGE as described above. For these analyses, the stacking gel was allowed to polymerize overnight prior to electrophoresis and samples were heated for 3 min at 80 °C only. Following electrophoresis proteins were transferred to a polyvinylidene diflouride membrane (Immobilon-P, Millipore) in 10 mM CAPS, 10% (v/v) methanol, pH 11 as described previously [19]. Samples were then analysed by automated Edman degradation using an Applied Biosystems PROCISETM 494 HT sequencer with online phenylthiohydantoin analysis by HPLC (Applied Biosystems Model 120A).
2.3. NMR Spectroscopy
All the NMR experiments for assignment and structure determination were performed on a Bruker Avance-II 700 MHz wide-bore NMR spectrometer (Bruker BioSpin, Rheinstetten, Germany) using a standard 5 mm triple resonance TXI probe equipped with a z-gradient. The experiments were performed at 300 K. Relaxation data were recorded on a Bruker Avance-III 800 MHz NMR spectrometer equipped with a standard cryoprobe. Data collection was done with TopSpin 1.3 (Bruker BioSpin, Rheinstetten, Germany), while the processing was performed with NMRPipe [20, 21].
HNCA, HNCO, HN(CA)CO, HN(CO)CA, CBCANH, and CBCA(CO)NH triple-resonance experiments were acquired to assign the backbone of the protein [22]. The side-chain assignment was based on 3D HCCH-TOCSY and N-TOCSY-HSQC. The distance restraints were extracted from 3D 13C- and 15N-NOESY-HSQC spectra in addition to a 2D NOESY. The 1H, 13C, and 15N chemical shifts were referenced to DSS according to the IUPAC recommendation [23].
To provide additional structural constraints for the WT FAS1-4 domain, a set of backbone HN residual dipolar couplings (RDCs) was measured using IPAP-HSQC [24]. The protein was aligned using a 7% polyacrylamide stretched polyacrylamide gel as described by Chou et al. [25]. Transverse 15N relaxation times at 800 MHz were measured to get an indication of the dynamics of the proteins. Chemical shifts were deposited in the BioMagnetic Resonance data Bank (BMRB, accession code 18466 and 18467).
2.4. Structure Determination
The distance restraints for the structure calculations were extracted from the NOESY spectra by manually integrating the peaks with Sparky [21]. In addition to the distance restraints, a set of backbone torsion angle restraints from TALOS+ [26] were included with a tolerance of two times the uncertainty given by TALOS+. To validate the WT FAS1-4 domain structure, an additional set of structures was calculated with 88 backbone HN RDCs. The structure calculation was performed with ARIA 1.3 [27] using torsion angle dynamics. In the final iteration 100 structures were calculated, and of these the 40 best structures were refined using the water refinement protocol in ARIA [27]. The 10 lowest-energy structures from the water refinement were analysed using procheck-NMR [28] and WHAT_CHECK [29]. The NMR structures have been deposited in the RCSB Protein Data Bank (PDB ID code 2LTB and 2LTC).
2.5. Molecular Dynamics
All-atom MD simulations were performed of the WT and the Arg555Trp mutant FAS1-4 domains. The lowest energy structures from the NMR ensemble of WT and Arg555Trp mutant domains were used as the starting point for the calculations. Based on pKa predictions by PROPKA 2.0 [30], the protonation states of the amino acid residues were examined at neutral pH. All histidines were predicted to be neutral, while the choice of tautomer was decided based on visual inspection, resulting in His572 being protonated at Nδ and His626 at Nε. The structures were solvated by the TIP3P water model [31] and neutralized with NaCl to an ion concentration of 0.1 M to resemble the experimental conditions. The calculations were run in NAMD2.6 [32] utilizing the CHARMM22 force field [33] with CMAP corrections [34, 35]. Initially the entire system was minimized with a conjugated gradient method for 15,000 steps, followed by MD simulations in the NPT ensemble at 310 K. Constant temperature was maintained by the Langevin dynamics with a damping coefficient of 0.5 ps−1, while the pressure was kept constant at 1 atm by the Langevin piston method [36, 37] with a piston period of 100 fs. Van der Waals interactions were truncated at a cut-off distance of 12 Å using a switching function, while electrostatic interactions were treated in full by PME [38]. Simulations on each system were repeated three times and were run for 100 ns each utilizing a 1 fs time step. These calculations accordingly yielded a total 600 ns of simulation, which was used in the analysis. Pictures and analysis in Figs. 3 and 4 were performed utilizing VMD1.8.7 [39]. Electrostatic potential isocontours were generated by APBS [40] and the electrostatic potential pictures were generated in PyMOL [41]
FIGURE 3. Structures of helices α1, α3, α3′, and α4 forming the hydrophobic cavity in the WT and Arg555Trp mutant FAS1-4 domains.
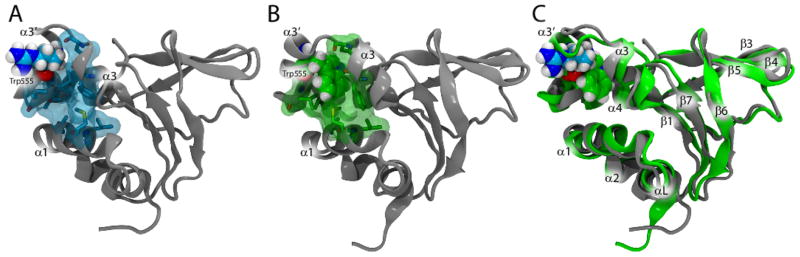
(A) The WT FAS1-4 domain is shown in grey cartoons. Arg555 is shown in cyan spheres and is pointing away from the hydrophobic cavity consisting of residues Met517, Leu518, Ala521, Phe547, Leu550, Leu558, Leu559, and Leu565 (cyan transparent surface and sticks). (B) The Arg555Trp mutant FAS1-4 domain is shown in grey cartoons. Residue Trp555 is shown in green spheres and is located within the hydrophobic cavity consisting of Met517, Leu518, Ala521, Phe547, Leu550, Leu558, Leu559, and Leu565 (green transparent surface and sticks). (C) Overlay of the WT and the Arg555Trp mutant FAS1-4 domain structures. The WT domain is shown in grey and Arg555 is indicated by cyan spheres. The Arg555Trp mutant domain is illustrated in green with the Trp555 residue shown in green spheres. The structures are overall very similar, however, Arg555 of the WT is pointing towards the solvent while the Trp555 residue in the Arg555Trp mutant domain is packed towards the protein.
FIGURE 4. Local structural changes in the Arg555Trp mutant FAS1-4 domain caused by insertion of the tryptophan side chain into the hydrophobic cavity.

(A) The differences in side chain rotation within the cavity lined by helices α1, α3, α3′, and α4. The WT FAS1-4 domain is shown in light grey, while the Arg555Trp mutant domain is shown in dark grey. The cavity consists of the hydrophobic residues: Met517, Leu518, Ala521, Phe547, Leu550, Leu558, Leu559, and Leu565, which are here shown in cyan in the WT structure and in green in the Arg555Trp mutant structure. Arg555 (cyan) in the WT FAS1-4 domain and Trp555 (green) of the Arg555Trp mutant domain are shown in fat sticks. (B) Cartoon representation of the Arg555Trp mutant FAS1-4 domain structure showing the heavy atoms of Trp555 with green sticks, the remainder of the protein structure is coloured from blue through white to green indicating observed 1HN chemical changes. Residues Ala500, Gly501, Ala521, and Ile522 and all proline residues are coloured white to indicate missing chemical shift data and the two C-terminal residues are coloured white to avoid focus on chemical shift changes due to the C-terminal Pro634Ala mutation. (C) Observed and predicted (using shAIC [44]) chemical shift change indexes for the FAS1-4 domain showing ρobs, ρW, and 0.1* ρstruct (see definitions in the Experimental Procedures section) in red, black, and green, respectively, as a function of the residue number. Due to proline residues, some values are missing. The mutation site, residue 555 is highlighted with a grey line. The secondary structures are shown at the top of the chart for reference.
2.6. MD Trajectory Cluster Analysis
The structural snapshots from the MD simulations were clustered utilizing the average linkage method [42] available in the ptraj analysis package in AmberTools 11 [43]. The clustering cut-off was set to a fixed value of 2.1 Å.
2.7. Chemical Shift Analysis
To validate the structure ensemble derived by NMR and the trajectory of structures produced by MD, the chemical shifts were back-calculated based on the MD ensemble using the program shAIC [44] and compared to the observed shifts. The differences between these values were converted to a pseudo energy, as described previously by Nielsen et al. [44] (see Supplementary Material).
To analyse correlations in the changes in the chemical shift and structures, the chemical shifts for each residue were grouped and transformed into combined root-mean-square deviations (RMSD) for both observed and predicted chemical shifts in three different ways. First, ρobs reports a residue-based weighted sum of differences between the chemical shift for the WT and the chemical shift for the Arg555Trp mutant. An RMSD chemical shift value, ρW, was derived to quantify the predicted effect caused exclusively by the Trp555 residue compared to Arg555 residue in the FAS1-4 domain structure. Another RMSD, ρstruct, was calculated describing the predicted effect of rearrangements in the tertiary structure caused by the mutation (see Supplementary Material for definitions).
2.8. In Vitro Aggregation
In triplicate experiments, WT and Arg555Trp mutant FAS1-4 domain variants were incubated at 0.6 mg/mL in PBS with 0.02% sodium azide, 1×protease inhibitor cocktail (Complete, Roche), and 5% or 10% (v/v) 2,2,2-trifluoroethanol (TFE). Aliquots for protein concentration determination were taken out immediately after mixing (reference concentration). Samples were subsequently incubated for 10 days at 37 °C and centrifuged for 15 min at 17,000 g. Aliquots were then taken out of the supernatant for protein concentration determination using Quick Start Bradford protein Assay (Bio-Rad, Hercules, CA).
3. Results
3.1. Proteolytic Susceptibility
To determine if the Arg555Trp mutation in the FAS1-4 domain has an effect on protease susceptibility, which may be relevant in protein turnover, the WT and mutant domains were probed using thermolysin as a model protease. The limited proteolysis of the WT and Arg555Trp mutant FAS1-4 domains revealed a significant difference in their proteolytic susceptibility (Figure 1). At the thermolysin:FAS1-4 ratios 1:10 and 1:1 a 15 kDa band appears much more intense for the mutant protein than for the WT protein, suggesting retarded proteolysis. N-terminal sequencing of the proteolytic fragments migrating above the 14 kDa marker show that these have the native N-terminus of the protein construct (AGMGTV), suggesting that the initial trimming occurs at the C-terminus. Significantly, two degradation products migrating just above and below the 6.5 kDa marker are observed for the WT protein (at the 1:1 ratio) but are absent from the Arg555Trp mutant protein degradation (Figure 1A). N-terminal sequencing of these bands show that they result from a cleavage of the 15 kDa fragment between residues Arg557 and Leu558, with the lower band having the native N-terminus of the protein (AGMGTV, marked with a diamond) and the upper band having the N-terminal sequence 558-LLGDA (marked with an asterisk). The observed proteolytic cleavage site is indicated in the FAS1-4 domain sequence in Figure 1B. A similar significant result was obtained using trypsin for the limited proteolysis. Thus, the tryptic cleavage site at the C-terminus of Arg557 is much more susceptible in the WT FAS1-4 domain than in the mutant domain and about ten times more trypsin is required to cleave between residues Arg557 and Leu558 in the Arg555Trp mutant domain compared to the WT domain (data not shown). The structural and dynamical basis for these observations was explored in more detail through the NMR analysis and MD simulations of the WT and Arg555Trp mutant FAS1-4 domains.
FIGURE 1. Limited proteolysis of the WT and Arg555Trp mutant FAS1-4 domains.
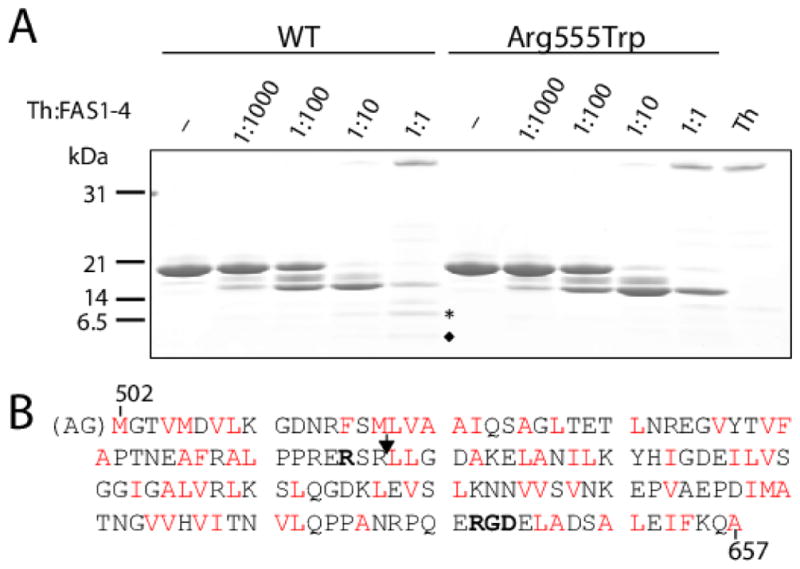
(A) SDS-PAGE analyses of the degradation products of the WT and the Arg555Trp mutant FAS1-4 domains following limited proteolysis using increasing ratios of thermolysin (Th):FAS1-4 domain ranging from 1:1000 to 1:1 (w/w). After separation of the degradation products by SDS-PAGE the fragments were characterized by N-terminal sequencing to identify the cleavage sites. Protein bands unique to the WT FAS1-4 domain digestion are marked by an asterisk and a diamond. (B) Sequence of the human WT FAS1-4 domain (Met502–Ala657) used in the study. The extra N-terminal AG residues present in the heterologous domains are shown within brackets. Residue Arg555 substituted in the Arg555Trp mutant FAS1-4 domain is indicated (bold). The P1′ amino acid residues for the potential cleavage sites for thermolysin (L, I, F, V, A, M) are highlighted in red letters and the N-terminus of the band marked with an asterisk in (A) is indicated with an arrowhead. Overall, it can be observed that the degradation of the Arg555Trp mutant FAS1-4 domain is retarded compared to the WT domain (compare bands at the 1:10 and 1:1 ratios for the two domain variants) suggesting less accessibility of the protease to the mutant domain. Edman degradation of all the protein bands in the gel revealed that all except the band marked with an asterisk in (A) had the N-terminus AGMGTV, which corresponds to the native N-terminal of the heterologous domain. The band marked with an asterisk has the N-terminus LLGDA. This corresponds to a proteolytic cleavage between residues Arg557 and Leu558 as highlighted in (B). The C-terminal RGD-sequence (Arg642–Asp644) is shown in bold face.
3.2. Assignment of NMR Spectra
The NMR spectra of the truncated WT and Arg555Trp mutant FAS1-4 domains were generally of good quality (Figure S1 in Supplementary Material). All backbone amide resonances except five could be assigned both in the WT and the Arg555Trp mutant domains. The missing backbone amide resonances included the two N-terminal amide resonances, which are absent due to proton exchange. Of all the proton resonances, 88% could be assigned for the WT domain and 87% for the Arg555Trp mutant domain. The unassigned resonances were mostly attributed to hydrophilic solvent-exposed side chains. Virtually all resonances of the hydrophobic side chains could be assigned. The spectra for the WT and the Arg555Trp mutant FAS1-4 domains appear to match very well, as illustrated by the 1H-15N HSQC spectra in Figure S1A and the modest chemical shift differences (Figure 2A) indicate very similar structures for the two FAS1-4 domain variants. Analyses of the chemical shifts with TALOS+ reveal identical secondary structures for the two domain species (Figure 2A). The amide resonances of the truncated WT FAS1-4 domain could also be assigned in the full-length WT domain. In the C-terminal tail, only residues 643–657 could be assigned, the other resonances were probably broadened beyond detection by slow exchange. Because of high background in the NOESY and TOCSY spectra from the C-terminal tail, a structure could not be calculated for this construct.
FIGURE 2. Structures of the WT and Arg555Trp mutant FAS1-4 domains.

(A) 1HN, backbone 15N, 13Cα, and backbone 13C′ chemical shift variations (defined as δArg555Trp – δWT). The mutation site, residue 555 is highlighted with a grey line. The numbered secondary structures (α-helices and β-strands) are shown at the top of the chart for reference according to the consensus of the FAS1-4 domain NMR structures determined in this study. The structural elements in the WT FAS1-4 domain structure include helix αL (Val505–Lys510), helix α1 (Phe515–Ala525), helix α2 (Thr528–Leu531), strand β1 (Thr538–Pro542), helix α3 (Asn544–Ala549), helix α3′ (Pro552–Leu558), helix α4 (Ala562–His572), strand β2 (Ile573–Gly574), helix α5 (Ser580–Gly582), strand β3 (Leu586–Lys590), strand β4 (Lys596–Lys602), strand β5 (Val605–Val608), strand β6 (Glu611–Met619), and strand β7 (Val624–Ile628). Only minor differences in the residues constituting the secondary structural elements were observed between the WT and the Arg555Trp mutant FAS1-4 domains. The bottom two panels shows the secondary structures (SS) predicted by TALOS+ for the WT and Arg555Trp. −1 indicate α-helix, while +1 indicate β-sheet. (B) The 10 best NMR structures of the WT FAS1-4 domain (blue) and the Arg555Trp mutant FAS1-4 domain (red) overlaid. Except for small differences in some loops, which may be ascribed to lack of data, the only significant difference is the orientation and position of the α3′-helix. The side-chains of Arg555 and Trp555 are drawn with sticks. (C) Protein topology diagram of the TGFBIp FAS1-4 domain showing the secondary structures using the nomenclature by Clout et al. [45].
3.3. NMR Structures
The structures of the WT FAS1-4 domain (Figure 2B, blue) were calculated using a total of 3211 peaks from 2D NOESY, 3D 13C-NOESY-HSQC, and 3D 15N-NOESY HSQC spectra. From these peaks, 1802 distance restraints could be extracted of which 501 were long-ranging (see statistics in Table 1). A set of structures was also calculated with an additional set of 88 backbone HN residual dipolar couplings (RDCs) (D = 11.5, R = 0.18). The structures of the Arg555Trp mutant FAS1-4 domain (Figure 2B, red) were calculated using a total of 3583 peaks from the same three types of NOESY spectra. From these, 1943 distance restraints could be extracted of which 568 were long-ranging (Table 1). No RDC-based constraints were used for the Arg555Trp structure. All structures were calculated with 2×117 dihedral angle constraints from TALOS+ (see Figure S3 in the supplementary materials).
TABLE 1.
NMR restraints and refinement statistics for structures of the WT and Arg555Trp mutant FAS1-4 domains. The values for the structure calculation with RDC’s are indicated in parenthesis.
| WT | Arg555Trp | |
|---|---|---|
| Distance restraints | ||
| Total | 1802 | 1943 |
| Intraresidue | 764 | 787 |
| Sequential | 376 | 403 |
| Medium range | 161 | 185 |
| Long range | 501 | 568 |
| Restraints per residue | 13 | 14 |
| Long-range restraints per residue | 3.7 | 4.2 |
| Dihedral angle constraints | ||
| φ,ψ | 2×117 | 2×117 |
| Average restraint violations per structure | ||
| Distance restraints (> 0.3 Å) | 2 (4) | 9 |
| Maximum violation (Å) | 1.0 (1.5) | 1.6 |
| Dihedral restraints (> 5°) | 0 (0.2) | 0.5 |
| Maximum violation (°) | − (12.4) | 7.6 |
| RDC restraints (> 1 Hz) | (3.8) | |
| Maximum violation (Hz) | (2.4) | |
| Average pairwise RMSD (Å)a | ||
| Residues 503–634 | ||
| Backbone atoms (N, C, C′) | 0.8 (0.7) | 0.7 |
| All heavy atoms | 1.5 (1.5) | 1.4 |
| All residues | ||
| Backbone atoms (N, C, C′) | 1.2 (1.2) | 1.0 |
| All heavy atoms | 1.7 (1.6) | 1.6 |
| RMS-deviations from idealized covalent geometry | ||
| Bond lengths (Å) | 0.005 | 0.006 |
| Bond angles (°) | 0.709 | 0.760 |
| Ramachandran analysis | ||
| Most favoured region (%) | 90.1 (89.7) | 86.4 |
| Additionally allowed region (%) | 8.3 (9.3) | 12.7 |
| Generously allowed region (%) | 1.3 (0.7) | 0.7 |
| Disallowed region (%) | 0.3 (0.3) | 0.3 |
Pairwise RMSD was calculated among 10 structures.
The three disordered N-terminal residues (Ala500–Met502) were excluded from the RMSD calculation of both FAS1-4 domain variants. The slightly higher calculated RMSDs (Table 1) for the WT domain relative to the Arg555Trp mutant domain can mainly be attributed to the α3′-helix (Figures 2B and 2C), since only few long-range NOEs restrain this helix in the WT domain. In addition, the lack of NOEs can be explained by a large cavity in the centre of a “helix triangle module” formed by helices α3, α3′, and α4. Introducing the RDCs to the structure calculations lowered the RMSD slightly, but did not improve the precision of the α3′-helix. Additional structural statistics from PROCHECK-NMR and WHAT_CHECK can also be found in Table 1.
The tertiary structures of the WT and the Arg555Trp mutant FAS1-4 domains are virtually identical (Figure 2B). This interpretation is supported by the similarities in 1HN, 15N, 13Cα, and 13C′ chemical shifts reported by the bar plots in Figure 2A. We note that the NMR structure of the WT FAS1-4 domain exhibits great similarity to the crystal structure of the fourth domain of Drosophila FAS1 reported by Clout et al. in 2003 (PDB code 1O70) [45], and it is virtually indistinguishable from the non-analysed human WT TGFBIp FAS1-4 domain structures deposited in the Protein Data Bank (NMR structure: PDB code 1X3B, and the X-ray structure: PDB code 2VXP).
The TGFBIp FAS1-4 domain structure consists of a mixture of α-helices and β-sheets, with segregated α and β regions (so-called α+β structure) as illustrated in Figures 2B and 2C. Starting at the N-terminus, using the same nomenclature as Clout et al. [45], the first part of the domain consists of a triangle module of α-helices (αL, α1, α2). A β-strand (β1) connects these helices to a second helix triangle module composed of helices α3, α3′, and α4. The Arg555Trp mutation in TGFBIp associated with GCD type 1 is located within the central helix α3′ of this triangle fold. After helix α4 is a short β-strand (β2) and a short α-helix (α5) followed by five β-strands (β3–β7) which are organized into two orthogonal β-sheets. Strand β6 is shared by the two β-sheets. Finally, based on the relaxation experiment described below, we have determined the C-terminal part (residues A636-Ala657) of the full-length WT FAS1-4 domain (Met502–Ala657) to be unstructured (data not shown).
3.4. Mutant-Induced Rearrangement in the α3, α3′, α4 Helix Module
Closer examination of the determined domain structures (Figure 2B) reveals a small change in the mutual arrangement of the helices α3, α3′, and α4 in the Arg555Trp mutant FAS1-4 domain relative to the WT structure. In the domain structures, this helix triangle module forms a hydrophobic cavity together with helix α1 (Figures 2B and 3). In the ten lowest-energy structures of the WT FAS1-4 domain residue Arg555, which is located in the centre of helix α3′, has its side chain pointing away from the cavity, exposed to the solvent, where it on average forms one labile hydrogen bond to the carbonyl Phe547, Arg548, and Leu550 (Figures 2B and 3A). However, in the structure of the Arg555Trp mutant domain, the tryptophan side chain partly fills this cavity (Figures 2B and 3B) oriented with the aromatic face of tryptophan towards the α3 and α4 helices (Figure 3C). The placement of the Trp555 side chain in the cavity formed by α1, α3, α3′, and α4 is supported by both NOEs and distinct variations in the chemical shifts in this region (Figures 4B and 4C). We note that there is still flexibility within the hydrophobic cavity enabling the side chain to rotate, which is evident from the limited number of NOEs restraining the side chain and from the MD simulations, as will be discussed later.
The insertion of the tryptophan side chain into the hydrophobic cavity triggers a displacement of the helix α3′ in the Arg555Trp mutant domain structure of approximately one third of a helix turn along the helix axis towards the C-terminus, relative to the WT domain structure (Figure 2B). This rearrangement changes the orientation of side chains lining the cavity. The side chain of Phe547 is rotated by ~30° (Figure 4A), which affects the chemical shifts of nearby atoms and, likewise, the leucine residues Leu550, Leu559, and Leu565 lining the cavity are also rotated, causing rather large changes in their side chain 13C chemical shifts.
3.5. Chemical Shift Analysis Validate α3′-Helix Movement and Trp555 Arrangement
To validate NMR structures and MD trajectories (vide infra), the chemical shifts were back-calculated on basis of the structures. The calculated pseudo energies are close to unity indicating a reasonable agreement between observed and predicted structures, hence, validating the structures. For the WT FAS1-4 domain, the energy is 1.0±0.1 and 1.05 for MD and NMR, respectively. For the Arg555Trp mutant domain, the energy is 1.05±0.03 and 1.13 for MD and NMR, respectively. Thus, the MD trajectory, although the experimental data was only used as a starting point, provided an equally or more adequate (Arg555Trp mutant) description of the conformations sampled by the protein and indicates that the enhanced dynamical picture offered by the MD trajectories compared to the NMR ensemble is important.
To provide more insight, we analysed the correlations between differences in the chemical shifts and the calculated structures for the WT and the Arg555Trp mutant domains in terms of the RMSD quantities ρobs, ρW, and ρstruct. The effect of changes in chemical shifts caused directly by the Arg555Trp mutation and changes due to rearrangements in the tertiary structure can be separated by analysing ρW and ρstruct, respectively. Firstly, Leu559 and Phe547 have the most pronounced changes in chemical shifts caused directly by the proximity of Trp555 in the mutant as predicted by ρW and indeed these residues display significant changes in observed chemical shifts (large values of ρobs) (Figure 4C). Secondly, the chemical shift changes caused exclusively by local structural rearrangement in the mutant structure, as predicted by ρstruct compared to the WT structure are largest for the residues having also the largest observed chemical shift changes (ρobs) i.e. residues Phe547, Leu559, and Ile568 (Figure 4C). However, for residues Phe547 and Leu559, this observation indicates that introduction of Trp555 affects the chemical shifts but also leads to local structural rearrangement near these residues. An overlay of the two structures (Figure 4A) reveals that the side chain of Phe547 has different conformations in the two structures. While it partly fills the hydrophobic cavity in the WT structure, it moves to a different location in the cavity of the mutant domain as Trp555 occupies a more central position in the cavity (Figure 4A). It can be seen from the overlaid structures in Figures 2B, 3C, and 4A, that the α3′ helix moves in a way to fill up the cavity around the side chain of Trp555 in the mutant FAS1-4 domain compared to the WT domain. In particular, Leu559 is displaced by around 3 Å into the pocket (Figure 4A).
3.6. Local Dynamics at the Mutation Site
To explore the dynamics of the mutation site in more detail, we analysed the behaviour of the native Arg555 in the WT FAS1-4 domain and Trp555 in the Arg555Trp mutant structure from extended MD simulations of 100 ns and using three repeats for each system (see Movie S1 in Supplementary Material), as multiple repeats this has been shown to improve sampling [46, 47]. The local dynamics at the mutation site is analysed from atom-based root-mean-square-fluctuations (RMSF) of the residue heavy atoms (Figure 5A). In the WT structure, the Arg555 residue is solvent exposed and remains so during the entire simulation. The arginine side chain rotates during the simulation (Figure S2 in Supplementary Material) primarily through dynamics of the χ1 angle. We also here observe labile hydrogen bonds to the carbonyl Phe547, Arg548, and Leu550, but on average there are 2.5 bonds relative to one for the NMR structures. In contrast, the χ1 dihedral angle of Trp555 in the Arg555Trp mutant domain remains relatively stable during the trajectories, whereas the χ2 dihedral angle varies the most, changing between a gauche+ conformation and the anti conformation (Figure S2 in Supplementary Material). The observed rotation of Trp555 in the simulations of the Arg555Trp mutant structure is in accordance with the measured 15N transverse relaxation time (T2). The observed 15N relaxation time in the indole ring of Trp555 is considerably longer than the ones found for the surrounding backbone nitrogen atoms (Figure 6C), suggesting that the side chain is significantly more dynamic than the backbone nitrogen atoms (Figure 5A and Figure S2 in Supplementary Material).
FIGURE 5. Local dynamics of residue at position 555 in the WT and Arg555Trp mutant FAS1-4 domains.
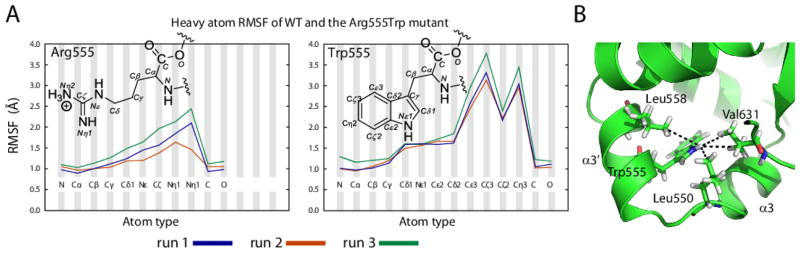
(A) MD atom-wise root-mean-square-fluctuation (RMSF) of Arg555 in the WT system and Trp555 in the Arg555Trp mutant system illustrates that the Trp555 residue of the mutant system rotates during the simulation. From the RMSF heavy atoms of Arg555 of the WT system, it is evident that the two NH nitrogens of the guanidinium group fluctuate the most. For the Trp555 residue of the Arg555Trp mutant FAS1-4 domain the fluctuations are much more extensive. Especially the atoms lining one part of the aromatic ring, namely Cε3, Cζ3, Cζ2, and Cη2 fluctuate substantially. This indicates rotation of the aromatic tryptophan ring within the hydrophobic cavity in the Arg555Trp mutant system during the simulation. Rotation of the aromatic ring of tryptophan allows the indole NH to interact favourable with the solvent while the hydrophobic part of the side chain is closely packed within the hydrophobic cavity formed by helices α1, α3, α3′, and α4. (B) All NOEs between Trp555-Hε1 and methyl groups should be easily identified. However, rotation of the tryptophan side chain will change the interaction pattern of residue Trp555 during simulation and may explain why only two of the four possible NOE (within 4.5 Å) between methyl groups and the Trp555-Hε1 could be identified. This observation is ascribed to local dynamics.
FIGURE 6. Global flexibility of the WT and Arg555Trp mutant FAS1-4 domains.
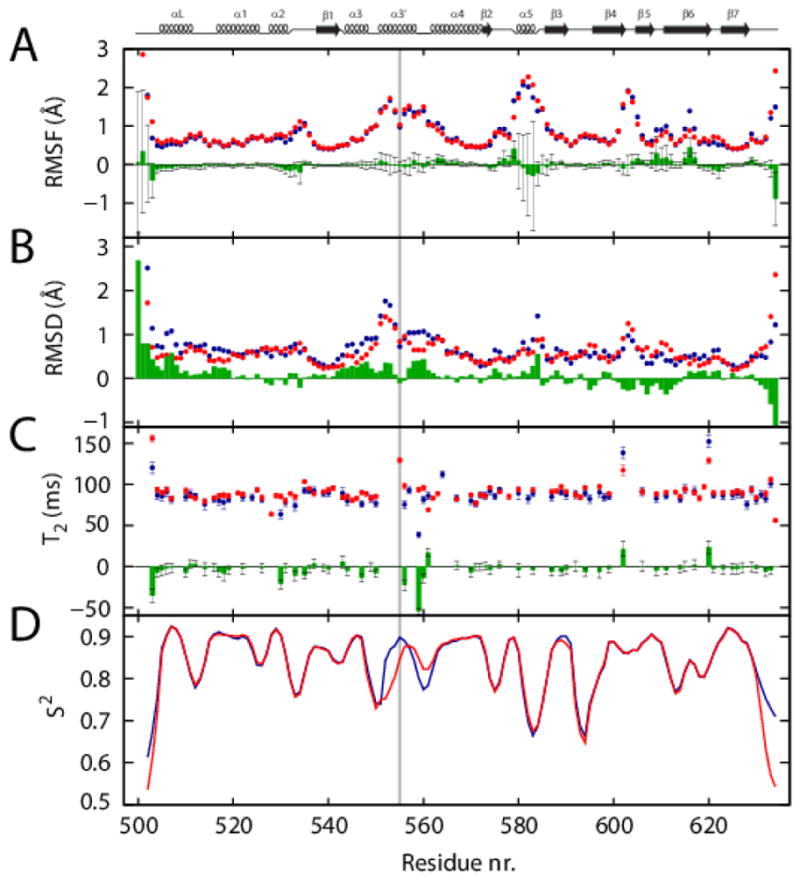
(A) Average Cα RMSF from the three MD simulations of the WT and the Arg555Trp mutant domains are shown by points in blue and red, respectively. The differences (WT minus Arg555Trp) between the averages are shown in green histograms with the standard deviation indicated by grey error bars. (B) The RMSD’s derived from the NMR structures; differences (WT minus Arg555Trp) are shown in green bars. The WT domain (blue) is less structured as compared to the Arg555Trp mutant domain (red), specifically this applies to the α3′ helix. The exception is for the residues 600–610, where the RMSD is higher for the Arg555Trp mutant domain. (C) The transverse relaxation (T2) difference in green histograms (WT minus Arg555Trp) of the two FAS1-4 domain variants indicates a more compact structure for the Arg555Trp mutant domain (red) compared to the WT domain (blue). In addition, around the mutation site the WT structure have residues with short T2, indicative of chemical exchange. (D) Predicted S2 order parameters obtained by the RCI method. The WT and the Arg555Trp mutant domains are shown as blue and red curves, respectively. The N-terminal part (residues Pro552–Trp555) of helix α3′ is more flexible in the Arg555Trp mutant while the C-terminal region of the helix and the loop between helices α3′ and α4 (residues Leu558–Lys563) are more rigid in the Arg555Trp mutant FAS1-4 domain compared to the WT domain. The mutation site, residue 555 is highlighted with a grey line. The secondary structures are shown at the top of the chart for reference.
3.7. Global Dynamics and Structural Variability
MD simulations were utilized to further explore the global (backbone) dynamics of the WT and the Arg555Trp mutant FAS1-4 domain structures. The difference in Cα RMSF between the WT and the Arg555Trp mutant domains was determined by the differences in the average RMSF over the three MD simulations of each of the systems (Figure 6A). In general the WT and the Arg555Trp systems behave similarly with respect to residue fluctuations, with the largest variation found for residues 575–595. The same pattern is observed from the residue-wise root-mean square deviations (RMSD) as observed from the NMR experiments (Figure 6B).
The T2 experiments also provide some indications of the overall flexibility of the two FAS1-4 domain variants (Figure 6C). In this case, we observe a general trend with longer relaxation times for the Arg555Trp mutant domain relative to the WT structure, which indicates a shorter rotational correlation time and more compact structure for the mutant FAS1-4 domain. We note that the relaxation experiments do not reveal as clear residue specific trends in the dynamics as the MD simulation-based RMSF (Figure 6A).
The generalized order parameter, S2, was also predicted for the WT and the Arg555Trp mutant structures based on the assigned chemical shifts using the program RCI (Figure 6D) [48]. Due to the similarities in the chemical shifts, the predicted order parameters are also similar along most of the sequence. However, according to the calculated S2 values, helix α3′ (residues Pro552–Leu558) in the mutant FAS1-4 domain is more flexible at the N-terminal part (residues Pro552–Trp555) including the mutation site, Trp555, but is more rigid in the C-terminal region and the loop between α3′ and α4 (residues Leu558–Lys563) compared to the WT structure.
3.8. Mutation Arg555Trp Induces Changes in the Electrostatic Potential Surface
To obtain structural information about the aggregation propensities of the WT and the Arg555Trp mutant FAS1-4 domains, we calculated their electrostatic potentials presented as isocontours from the minimized lowest energy NMR structures. From the resulting plots it is evident that the two NMR structures differ in surface characteristics. Specifically, the translation of the α3′-helix in the more compact Arg555Trp mutant structure induces a larger connected surface of positive charge (Figure 7) which might lead to larger propensity for charged molecular interactions. To investigate this we compared the propensities of the WT and the Arg555Trp mutant FAS1-4 domains to aggregate through electrostatic interactions using organic solvent.
FIGURE 7. Electrostatic potential isocontours for the WT and Arg555Trp mutant FAS1-4 domains.
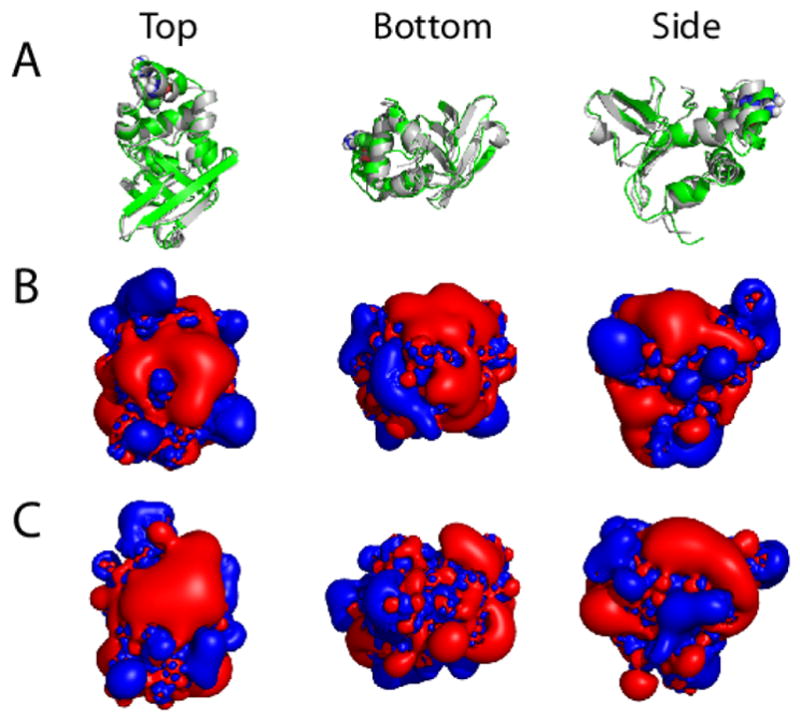
The lowest energy NMR structure minimized in a water box and ionized with NaCl was used as input for the APBS calculations of the electrostatic potential isocontours. (A) Overlaid ribbon plots for the WT structure (grey) and the Arg555Trp mutant structure (green), (B) electrostatic potential isocontours for the WT FAS1-4 domain, and (C) electrostatic potential isocontours for the Arg555Trp mutant FAS1-4 domain shown in three different molecular orientations: top (left), bottom (middle), and side (right) views. Red and blue colours in (B, C) represent electrostatic potentials of +1 and −1 kT/e, respectively. From the top view it is clear that translation of the α3′-helix in the more compact Arg555Trp mutant structure (left, panel C) induces a larger connected positively charged surface in the mutant FAS1-4 domain compared to the WT structure (left, panel B).
3.9. The Arg555Trp Mutation Increases Aggregation Propensity
Utilizing a titration with TFE we probed the aggregation propensities of the WT and mutant FAS1-4 domain variants (Figure 8). Addition of TFE reduces the polarity of the solvent, and thereby favours electrostatic interactions of the protein [49]. Our results show that addition of 10% TFE significantly reduced the solubility of the WT and Arg555Trp mutant FAS1-4 domains (Figure 8). Noteworthy, in the presence of 10% TFE a significantly higher aggregation propensity is observed for the Arg555Trp mutant domain compared to the WT FAS1-4 domain.
FIGURE 8. Aggregation of the WT and Arg555Trp mutant FAS1-4 domains.
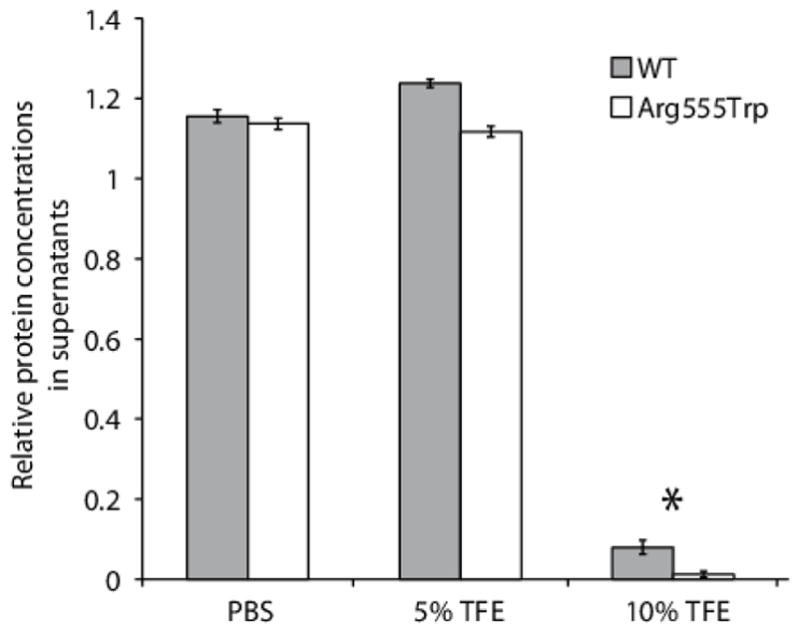
In triplicate experiments the WT and Arg555Trp mutant FAS1-4 domains were incubated for 10 days at 37 °C in 1×PBS containing sodium azide, protease inhibitors, and TFE as indicated. Protein concentrations of the supernatants before and after incubation were measured. The diagram shows the relative amounts of soluble protein. In the presence of 10% TFE significantly more (p<0.05) of the Arg555Trp mutant had precipitated compared to the WT domain (marked with an asterisk). Error bars represent the standard error of mean (SEM).
4. Discussion
Mutations in the extracellular protein TGFBIp give rise to several phenotypically distinct corneal dystrophies, which are characterized by progressive deposition of proteinaceous material in the cornea. The Arg555Trp mutation in TGFBIp causing GCD type 1 is of particular interest due to its high prevalence [14, 15] and aggressive phenotype, which in homozygotes manifests as early as the age of 3 years [50]. Furthermore, the Arg555Trp mutation is the only reported substitution in the FAS1-4 domain leading to non-amyloid granular deposits without any concomitant formation of amyloid. Thus, the pathology suggests that the Arg555Trp mutation in the TGFBIp FAS1-4 domain is favourable to study to unravel the molecular pathogenesis of TGFBI-linked GCDs.
In the present study, we pursued the hypothesis that the previously observed increase in thermodynamic stability of the TGFBIp FAS1-4 domain due to the Arg555Trp mutation [13] may result in decreased protease accessibility of the domain. Reduced proteolytic degradation of mutant TGFBIp in the cornea would be expected to result in protein accumulation and subsequent aggregation as observed for GCD phenotypes [9].
Limited proteolysis showed that the region containing residue Arg555 is very susceptible to proteolysis in the WT FAS1-4 core domain suggesting that this region plays an important role in the degradation of TGFBIp in vivo. Furthermore, the proteolytic experiments of the FAS1-4 domain variants showed that the degradation of the Arg555Trp mutant FAS1-4 domain is retarded compared to the WT domain. Specifically, the Arg555Trp mutation reduces the proteolytic susceptibility of the adjacent peptide bond between residues Arg557 and Leu558 indicating that the arginine to tryptophan substitution predominantly induces local structural changes in the domain.
To establish a structural basis for proteolytic resistance of the Arg555Trp mutant domain, we determined the three-dimensional solution structures of both the WT and the Arg555Trp mutant FAS1-4 domains by liquid-state NMR spectroscopy. The two structures were very similar in the overall fold and have the α+β structure as reported for other FAS1 domains [45]. When comparing the WT and Arg555Trp mutant structures, we only found significant deviations near the surface-exposed α3′ helix containing the mutated amino acid residue 555. Residue Arg555 in the WT FAS1-4 domain is situated with the guanidinium group pointing towards the solvent. In this conformation, a cavity is found between helices α1, α3, α3′, and α4. This cavity is lined with the amino acid residues Met, Leu, Ala, Pro, Phe, Ile, and Val making it a very hydrophobic environment. The side chain of Trp555 in the Arg555Trp mutant FAS1-4 domain structure was conversely found to be buried in a position equivalent to where the hydrophobic cavity was found in the WT FAS1-4 domain thereby enhancing the hydrophobic packing. The hydrophobic indole ring of the tryptophan side chain can thus form multiple van der Waals interactions with the surrounding amino acid residues. The observed translation of the α3′ helix and rearrangement of the hydrophobic residues close to the cavity is a result of maximizing the van der Waals interactions while minimizing the repulsive forces. These observations may provide a structural explanation of the recently reported increased thermodynamic stability of the Arg555Trp mutant FAS1-4 domain as well as intact mutant TGFBIp compared to the WT proteins [13]. However, increased thermodynamic stability of TGFBIp caused by the Arg555Trp mutation does not explain the accumulation and deposition of TGFBIp observed in GCD type 1 corneas. Therefore, we explored the dynamics of the FAS1-4 domain structures to identify changes in flexibility. The T2 (and S2) relaxation measurements predicted that the C-terminal region of helix α3′ containing the residues most susceptible for proteolysis in the core FAS1-4 domain is more rigid in the mutant domain which likely explains the lack of proteolytic cleavage activity in this region of the Arg555Trp mutant FAS1-4 domain.
The order parameter was predicted for the WT and the Arg555Trp mutant domains based on the assigned chemical shifts using the program RCI (Figure 6). Not surprisingly, the two termini and loops are the most flexible parts whereas the secondary structure elements are rather rigid, S2 ~0.9 on average, and the loops between the elements are more flexible, S2 ~ 0.75 on average. In addition, it is noteworthy that the β6–strand is predicted to be quite flexible (S2 as low as 0.76). Due to the similarities in the chemical shifts the predicted order parameters are similar along most of the sequence. The important difference is in the part having the largest differences in chemical shifts, namely near the mutation site in the α3′ helix and in the loop following that helix. According to RCI the helix is more flexible at the mutation site, Trp555, and at the N-terminal site of the helix but more rigid at the C-terminal part and in the loop subsequent to helix α3′. This increased flexibility could indicate that Trp555 is sampling more conformations as also suggested by MD based on side chain flexibility (Figure 5, Figure S2, and supplementary Movie S1) and distribution of conformational clusters as mentioned below.
To validate the structure ensemble derived by NMR in the absence of NMR experimental constraints, the chemical shifts were calculated based on these structures using the program, shAIC, and compared to the observed. A similar comparison was made for the MD structure ensemble. The pseudo energy calculated from the chemical shift differences showed that the MD trajectory, even though the experimental data was not used explicitly during production, provided a more adequate description of the conformations sampled by the protein and indicates that the enhanced dynamical picture offered by the trajectory compared to the derived NMR ensemble is important.
The relaxation data and the predicted order parameters indicate a more flexible α3′ helix for the Arg555Trp mutant domain than for the WT. Based on average linkage cluster analysis of the WT and the Arg555Trp mutant domains from the MD simulations, it is also evident that the Arg555Trp mutant domain sample more low occupied conformations during MD simulation. The clustering based on a 2.1 Å RMSD cut-off within the cluster resulted in 8 clusters from the WT MD simulations and 10 clusters from the Arg555Trp mutant domain MD simulations. The cluster population with the WT structure simulations were 69.9, 21.7, 3.5, 2.1, 2.1, 0.6, 0.2, 0.1 %, respectively, thereby revealing that 90 % of the population along the trajectory can be explained by only two clusters. On the contrary the population distribution within the 10 Arg555Trp clusters were; 31.9, 27.0, 16.6 14.8, 3.5, 3.5, 2.6, 0.3, 0.1, 0.1 %, respectively. This population distribution clearly illustrate that the Arg555Trp mutant domain occupies more low probability states during simulation and in general is more flexible.
There are fewer NOEs between the side chain of Trp555 and the surrounding amino acids than expected. This indicates that the Trp555 side chain is able to rotate relatively freely within the hydrophobic pocket (see Movie S1), consistent with the long transverse relaxation of the indole 15N and with the MD simulations of the WT and the Arg555Trp mutant structures. The tight packing of Trp555 into the hydrophobic core in the Arg555Trp may explain the observed differences in thermodynamic stability simply based on the increased hydrophobic stabilization of the Arg555Trp mutant protein structure.
In addition to the proteolytic susceptibility change, we noted that the Arg555Trp amino acid substitution resulted in altered surface electrostatics. Thus, in the mutant domain the α3′ helix slides half a turn compared to the WT structure and in this altered conformation, the charged residues Arg553 and Arg557 are oriented differently, leading to a different surface charge distribution with a higher concentration of positive charge in the regions around the α3′ helix. To investigate if the substitution of arginine with tryptophan at position 555 has an effect on the aggregation propensity of the FAS1-4 domain, we decreased the polarity of the solvent by adding TFE, leading to significantly greater aggregation of the Arg555Trp mutant. Lowering solvent polarity will increase the strength of electrostatic interactions, indicating that the mutation significantly increases the propensity of the FAS1-4 domain to aggregate through electrostatic interactions. Our data suggest that both proteolytic resistance and altered local electrostatic properties contribute to the pathogenesis of the Arg555Trp mutant TGFBIp in GCD type 1. Thus, based on the present data, we propose that in vivo the Arg555Trp mutation gives rise to decreased proteolytic turnover and thereby accumulation of mutant TGFBIp which in combination with its increased propensity to aggregate will ultimately result in the corneal deposition of TGFBIp as observed in GCD type 1.
Combining the present data with previous studies may provide important indications of the biological significance in corneal dystrophy; Karring et al. [10] showed that the C-terminal part of TGFBIp (including the FAS1-4 domain) is the last to be turned over in the normal human cornea. Whether this is due to a very specific turnover of TGFBIp, or that the C-terminal region is relatively more resistant to proteolysis in vivo compared to the other TGFBIp domains remains to be elucidated. However, based on the present structural information, it could be hypothesized that stabilizing mutations in the FAS1-4 domain might render this region even less degradable. Thus, increased accumulation of C-terminal mutant TGFBIp isoforms might be the direct cause of the TGFBIp aggregation in GCD corneas.
Since there, to the best of the our knowledge, exists no evidence that mutant TGFBIp is denatured in GCD type 1 deposits, one might imagine a scenario where an increased protein stability and reduced proteolytic degradation, in combination with altered surface electrostatics, could result in TGFBIp accumulation and crystallization in accordance to the observations made by Klintworth et al. [9] where full-length TGFBIp was observed to be accumulated as crystalloid deposits in the corneal stroma of a patient with GCD.
5. Conclusion
In conclusion, this study has shown that the peptide bond between residues Arg557 and Leu558 adjacent to mutation site 555 is less susceptible to proteolysis in the Arg555Trp mutant FAS1-4 domain compared to the WT domain variant. Furthermore, NMR experiments and MD simulations suggest that the previously reported increase in thermodynamic stability of the Arg555Trp mutant of TGFBIp may be a result of stabilizing van der Waals interactions of Trp555 in the FAS1-4 domain obtained through a more favourable hydrophobic packing. We suggest that the disrupted proteolytic degradation of the Arg555Trp mutant domain is caused by a more rigid structure of the C-terminal part of the helix α3′ in the Arg555Trp mutant domain which is supported by MD simulation. The increased propensity of TGFBIp to aggregate in GCD type 1 cornea may in addition be caused by differences in surface characteristics of the FAS1-4 domain variants as analysed here by calculated electrostatic potential surfaces and TFE-induced aggregation experiments.
Supplementary Material
Highlights.
Arg555Trp mutation disrupts the normal degradation/turnover of corneal TGFBI
The mutant is less susceptible to proteolysis by thermolysin and trypsin than WT
Arg555Trp mutant FAS1-4 domains structures display minor differences
Trp555 is buried in an otherwise empty hydrophobic cavity
Structural changes alter electrostatic properties, increasing aggregation propensity
Acknowledgments
Funding
This work was supported by a grant from the Danish National Research Foundation. The use of the instrumentation related to the Danish Biological Solid-State NMR Center within the Danish Biotechnological Instrument Centre (DABIC) as well as the Center for NMR of Biological Macromolecules at the Carlsberg Laboratory is acknowledged. In addition, this study was supported by research grant [R01 EY012712] from the National Eye Institute. Computations were made possible by grants from the Danish Center for Scientific Computing.
The abbreviations used are
- TGFBIp
transforming growth factor beta induced protein
- TGFBI
transforming growth factor beta induced gene
- EMI
EMILIN-1 domain
- LCD
lattice corneal dystrophy
- GCD
granular corneal dystrophy
- TBCD
Thiel-Behnke corneal dystrophy
- WT
wild-type
- FAS1
fasciclin 1 domain
- FAS1-4
fourth FAS1 domain of TGFBIp
- NMR
nuclear magnetic resonance
- MD
molecular dynamics
- SUMO
small ubiquitin-like modifier
- LB
Lysogeny broth
- OD
optical density
- IPTG
isopropyl β-D-1-thiogalactopyranoside
- DSS
2,2-Dimethyl-2-silapentane-5-sulfonate
- RDC
residual dipolar couplings
- PDB
Protein Data Bank
- RMSD
root-mean-square deviation
- RMSF
root-mean-square fluctuation
References
- 1.Kitahama S, Gibson MA, Hatzinikolas G, Hay S, Kuliwaba JL, Evdokiou A, Atkins GJ, Findlay DM. Expression of fibrillins and other microfibril-associated proteins in human bone and osteoblast-like cells. Bone. 2000;27:61–67. doi: 10.1016/s8756-3282(00)00292-1. [DOI] [PubMed] [Google Scholar]
- 2.LeBaron RG, Bezverkov KI, Zimber MP, Pavelec R, Skonier J, Purchio AF. Beta IG-H3, a novel secretory protein inducible by transforming growth factor-beta, is present in normal skin and promotes the adhesion and spreading of dermal fibroblasts in vitro. J Invest Dermatol. 1995;104:844–849. doi: 10.1111/1523-1747.ep12607024. [DOI] [PubMed] [Google Scholar]
- 3.Escribano J, Hernando N, Ghosh S, Crabb J, Coca-Prados M. cDNA from human ocular ciliary epithelium homologous to beta ig-h3 is preferentially expressed as an extracellular protein in the corneal epithelium. J Cell Physiol. 1994;160:511–521. doi: 10.1002/jcp.1041600314. [DOI] [PubMed] [Google Scholar]
- 4.Ferguson JW, Thoma BS, Mikesh MF, Kramer RH, Bennett KL, Purchio A, Bellard BJ, LeBaron RG. The extracellular matrix protein betaIG-H3 is expressed at myotendinous junctions and supports muscle cell adhesion. Cell Tissue Res. 2003;313:93–105. doi: 10.1007/s00441-003-0743-z. [DOI] [PubMed] [Google Scholar]
- 5.Doliana R, Bot S, Bonaldo P, Colombatti A. EMI, a novel cysteine-rich domain of EMILINs and other extracellular proteins, interacts with the gC1q domains and participates in multimerization. FEBS Letters. 2000;484:164–168. doi: 10.1016/s0014-5793(00)02140-2. [DOI] [PubMed] [Google Scholar]
- 6.Skonier J, Bennett K, Rothwell V, Kosowski S, Plowman G, Wallace P, Edelhoff S, Disteche C, Neubauer M, Marquardt H. beta ig-h3: a transforming growth factor-beta-responsive gene encoding a secreted protein that inhibits cell attachment in vitro and suppresses the growth of CHO cells in nude mice. DNA Cell Biol. 1994;13:571–584. doi: 10.1089/dna.1994.13.571. [DOI] [PubMed] [Google Scholar]
- 7.Kannabiran C, Klintworth GK. TGFBI gene mutations in corneal dystrophies. Human Mutation. 2006;27:615–625. doi: 10.1002/humu.20334. [DOI] [PubMed] [Google Scholar]
- 8.Munier FL, Korvatska E, Djemaï A, Paslier DL, Zografos L, Pescia G, Schorderet DF. Kerato-epithelin mutations in four 5q31-linked corneal dystrophies. Nat Genet. 1997;15:247–251. doi: 10.1038/ng0397-247. [DOI] [PubMed] [Google Scholar]
- 9.Klintworth GK, Valnickova Z, Enghild JJ. Accumulation of beta ig-h3 gene product in corneas with granular dystrophy. Am J Pathol. 1998;152:743–748. [PMC free article] [PubMed] [Google Scholar]
- 10.Karring H, Runager K, Valnickova Z, Thøgersen IB, Møller-Pedersen T, Klintworth GK, Enghild JJ. Differential expression and processing of transforming growth factor beta induced protein (TGFBIp) in the normal human cornea during postnatal development and aging. Experimental eye research. 2010;90:57–62. doi: 10.1016/j.exer.2009.09.011. [DOI] [PMC free article] [PubMed] [Google Scholar]
- 11.Korvatska E, Henry H, Mashima Y, Yamada M, Bachmann C, Munier FL, Schorderet DF. Amyloid and non-amyloid forms of 5q31-linked corneal dystrophy resulting from kerato-epithelin mutations at Arg-124 are associated with abnormal turnover of the protein. The Journal of biological chemistry. 2000;275:11465–11469. doi: 10.1074/jbc.275.15.11465. [DOI] [PubMed] [Google Scholar]
- 12.Karring H, Runager K, Thogersen IB, Klintworth GK, Hojrup P, Enghild JJ. Composition and proteolytic processing of corneal deposits associated with mutations in the TGFBI gene. Experimental eye research. 2012;96:163–170. doi: 10.1016/j.exer.2011.11.014. [DOI] [PMC free article] [PubMed] [Google Scholar]
- 13.Runager K, Basaiawmoit RV, Deva T, Andreasen M, Valnickova Z, Sørensen CS, Karring H, Thøgersen IB, Christiansen G, Underhaug J, Kristensen T, Nielsen NC, Klintworth GK, Otzen DE, Enghild JJ. Human phenotypically distinct TGFBI corneal dystrophies are linked to the stability of the fourth FAS1 domain of TGFBIp. The Journal of biological chemistry. 2011;286:4951–4958. doi: 10.1074/jbc.M110.181099. [DOI] [PMC free article] [PubMed] [Google Scholar]
- 14.Munier FL, Frueh BE, Othenin-Girard P, Uffer S, Cousin P, Wang MX, Héon E, Black GCM, Blasi MA, Balestrazzi E, Lorenz B, Escoto R, Barraquer R, Hoeltzenbein M, Gloor B, Fossarello M, Singh AD, Arsenijevic Y, Zografos L, Schorderet DF. BIGH3 mutation spectrum in corneal dystrophies. Invest Ophthalmol Vis Sci. 2002;43:949–954. [PubMed] [Google Scholar]
- 15.Fujiki K, Nakayasu K, Kanai A. Corneal dystrophies in Japan. J Hum Genet. 2001;46:431–435. doi: 10.1007/s100380170041. [DOI] [PubMed] [Google Scholar]
- 16.Chakravarthi SVVK, Kannabiran C, Sridhar MS, Vemuganti GK. TGFBI gene mutations causing lattice and granular corneal dystrophies in Indian patients. Invest Ophthalmol Vis Sci. 2005;46:121–125. doi: 10.1167/iovs.04-0440. [DOI] [PubMed] [Google Scholar]
- 17.Golovanov AP, Hautbergue GM, Wilson SA, Lian LY. A simple method for improving protein solubility and long-term stability. J Am Chem Soc. 2004;126:8933–8939. doi: 10.1021/ja049297h. [DOI] [PubMed] [Google Scholar]
- 18.Bury AF. Analysis of protein and peptide mixtures: Evaluation of three sodium dodecyl sulphate-polyacrylamide gel electrophoresis buffer systems. Journal of Chromatography A. 1981;213:491–500. [Google Scholar]
- 19.Matsudaira P. Sequence from picomole quantities of proteins electroblotted onto polyvinylidene difluoride membranes. The Journal of biological chemistry. 1987;262:10035–10038. [PubMed] [Google Scholar]
- 20.Delaglio F, Grzesiek S, Vuister GW, Zhu G, Pfeifer J, Bax A. NMRPipe: A multidimensional spectral processing system based on UNIX pipes. J Biomol NMR. 1995;6:277–293. doi: 10.1007/BF00197809. [DOI] [PubMed] [Google Scholar]
- 21.Goddard TD, Kneller DG. SPARKY 3, SPARKY 3. University of California; San Francisco: 2002. [Google Scholar]
- 22.Sattler M, Schleucher J, Griesinger C. Heteronuclear multidimensional NMR experiments for the structure determination of proteins in solution employing pulsed field gradients. Prog Nucl Magn Reson Spectrosc. 1999;34:93–158. [Google Scholar]
- 23.Markley JL, Bax A, Arata Y, Hilbers CW, Kaptein R, Sykes BD, Wright PE, Wuthrich K. Recommendations for the presentation of NMR structures of proteins and nucleic acids. J Mol Biol. 1998;280:933–952. doi: 10.1006/jmbi.1998.1852. [DOI] [PubMed] [Google Scholar]
- 24.Ottiger M, Delaglio F, Bax A. Measurement of J and Dipolar Couplings from Simplified Two-Dimensional NMR Spectra. J Magn Reson. 1998;131:373–378. doi: 10.1006/jmre.1998.1361. [DOI] [PubMed] [Google Scholar]
- 25.Chou JJ, Gaemers S, Howder B, Louis JM, Bax A. A simple apparatus for generating stretched polyacrylamide gels, yielding uniform alignment of proteins and detergent micelles. J Biomol NMR. 2001;21:377–382. doi: 10.1023/a:1013336502594. [DOI] [PubMed] [Google Scholar]
- 26.Shen Y, Delaglio F, Cornilescu G, Bax A. TALOS+: a hybrid method for predicting protein backbone torsion angles from NMR chemical shifts. J Biomol NMR. 2009;44:213–223. doi: 10.1007/s10858-009-9333-z. [DOI] [PMC free article] [PubMed] [Google Scholar]
- 27.Linge JP, Habeck M, Rieping W, Nilges M. ARIA: automated NOE assignment and NMR structure calculation. Bioinformatics. 2003;19:315–316. doi: 10.1093/bioinformatics/19.2.315. [DOI] [PubMed] [Google Scholar]
- 28.Laskowski RA, Rullmannn JA, MacArthur MW, Kaptein R, Thornton JM. AQUA and PROCHECK-NMR: programs for checking the quality of protein structures solved by NMR. J Biomol NMR. 1996;8:477–486. doi: 10.1007/BF00228148. [DOI] [PubMed] [Google Scholar]
- 29.Hooft RW, Vriend G, Sander C, Abola EE. Errors in protein structures. Nature. 1996;381:272. doi: 10.1038/381272a0. [DOI] [PubMed] [Google Scholar]
- 30.Li H, Robertson AD, Jensen JH. Very fast empirical prediction and rationalization of protein pKa values. Proteins. 2005;61:704–721. doi: 10.1002/prot.20660. [DOI] [PubMed] [Google Scholar]
- 31.Jorgensen WL, Chandrasekhar J, Madura JD, Impey RW, Klein ML. Comparison of simple potential functions for simulating liquid water. The Journal of Chemical Physics. 1983;79:926–935. [Google Scholar]
- 32.Phillips JC, Braun R, Wang W, Gumbart J, Tajkhorshid E, Villa E, Chipot C, Skeel RD, Kalé L, Schulten K. Scalable molecular dynamics with NAMD. J Comput Chem. 2005;26:1781–1802. doi: 10.1002/jcc.20289. [DOI] [PMC free article] [PubMed] [Google Scholar]
- 33.MacKerell AD, Bashford D, Bellott, Dunbrack RL, Evanseck JD, Field MJ, Fischer S, Gao J, Guo H, Ha S, Joseph-McCarthy D, Kuchnir L, Kuczera K, Lau FTK, Mattos C, Michnick S, Ngo T, Nguyen DT, Prodhom B, Reiher WE, Roux B, Schlenkrich M, Smith JC, Stote R, Straub J, Watanabe M, Wiókiewicz-Kuczera J, Yin D, Karplus M. All-Atom Empirical Potential for Molecular Modeling and Dynamics Studies of Proteins. The Journal of Physical Chemistry B. 1998;102:3586–3616. doi: 10.1021/jp973084f. [DOI] [PubMed] [Google Scholar]
- 34.MacKerell AD, Feig M, Brooks CL. Improved treatment of the protein backbone in empirical force fields. J Am Chem Soc. 2004;126:698–699. doi: 10.1021/ja036959e. [DOI] [PubMed] [Google Scholar]
- 35.MacKerell AD, Feig M, Brooks CL. Extending the treatment of backbone energetics in protein force fields: limitations of gas-phase quantum mechanics in reproducing protein conformational distributions in molecular dynamics simulations. J Comput Chem. 2004;25:1400–1415. doi: 10.1002/jcc.20065. [DOI] [PubMed] [Google Scholar]
- 36.Martyna GJ, Tobias DJ, Klein ML. Constant pressure molecular dynamics algorithms. The Journal of Chemical Physics. 1994;101:4177–4189. [Google Scholar]
- 37.Feller SE, Zhang Y, Pastor RW, Brooks BR. Constant pressure molecular dynamics simulation: The Langevin piston method. The Journal of Chemical Physics. 1995;103:4613–4621. [Google Scholar]
- 38.Darden T, York D, Pedersen L. Particle mesh Ewald: An N [center-dot] log(N) method for Ewald sums in large systems. The Journal of Chemical Physics. 1993;98:10089–10092. [Google Scholar]
- 39.Humphrey W, Dalke A, Schulten K. VMD: visual molecular dynamics. J Mol Graph. 1996;14:33–38. 27–38. doi: 10.1016/0263-7855(96)00018-5. [DOI] [PubMed] [Google Scholar]
- 40.Baker NA, Sept D, Joseph S, Holst MJ, McCammon JA. Electrostatics of nanosystems: application to microtubules and the ribosome. Proc Natl Acad Sci U S A. 2001;98:10037–10041. doi: 10.1073/pnas.181342398. [DOI] [PMC free article] [PubMed] [Google Scholar]
- 41.Delano WL. Thy PyMOL Molecular Graphics System. Schrödinger, LLC; New York: [Google Scholar]
- 42.Shao J, Tanner SW, Thompson N, Cheatham TE. Clustering Molecular Dynamics Trajectories: 1. Characterizing the Performance of Different Clustering Algorithms. J Chem Theory Comput. 2007;3:2312–2334. doi: 10.1021/ct700119m. [DOI] [PubMed] [Google Scholar]
- 43.Case TADDA, Cheatham TE, III, Simmerling CL, Wang J, Duke RE, Luo R, Walker RC, Zhang W, Merz KM, Roberts B, Hayik S, Roitberg A, Seabra G, Swails J, Goetz AW, Kolossvai I, Wong KF, Paesani F, Vanicek J, Wolf RM, Liu J, Wu X, Brozell SR, Steinbrecher T, Gohlke H, Cai Q, Ye X, Wang J, Hsieh M-J, Cui G, Roe DR, Mathews DH, Seetin MG, Salomon-Ferrer R, Sagui C, Babin V, Luchko T, Gusarov S, Kovalenko A, Kollman PA. AMBER 11. University of California; San Franscisco: [Google Scholar]
- 44.Nielsen JT, Eghbalnia HR, Nielsen NC. Chemical shift prediction for protein structure calculation and quality assessment using an optimally parameterized force field. Progress in Nuclear Magnetic Resonance Spectroscopy. 2012;60:1–28. doi: 10.1016/j.pnmrs.2011.05.002. [DOI] [PMC free article] [PubMed] [Google Scholar]
- 45.Clout NJ, Tisi D, Hohenester E. Novel fold revealed by the structure of a FAS1 domain pair from the insect cell adhesion molecule fasciclin I. Structure. 2003;11:197–203. doi: 10.1016/s0969-2126(03)00002-9. [DOI] [PubMed] [Google Scholar]
- 46.Koldsø H, Noer P, Grouleff J, Autzen HE, Sinning S, Schiøtt B. Unbiased Simulations Reveal the Inward-Facing Conformation of the Human Serotonin Transporter and Na+ Ion Release. PLoS Comput Biol. 2011;7:e1002246. doi: 10.1371/journal.pcbi.1002246. [DOI] [PMC free article] [PubMed] [Google Scholar]
- 47.Aittoniemi J, de Wet H, Ashcroft FM, Sansom MSP. Asymmetric Switching in a Homodimeric ABC Transporter: A Simulation Study. PLoS Comput Biol. 2010;6:e1000762. doi: 10.1371/journal.pcbi.1000762. [DOI] [PMC free article] [PubMed] [Google Scholar]
- 48.Berjanskii MV, Wishart DS. A Simple Method To Predict Protein Flexibility Using Secondary Chemical Shifts. Journal of the American Chemical Society. 2005;127:14970–14971. doi: 10.1021/ja054842f. [DOI] [PubMed] [Google Scholar]
- 49.Otzen DE. Amyloid formation in surfactants and alcohols: membrane mimetics or structural switchers? Current protein & peptide science. 2010;11:355–371. doi: 10.2174/138920310791330622. [DOI] [PubMed] [Google Scholar]
- 50.Klintworth GK. Corneal dystrophies. Orphanet J Rare Dis. 2009;4:7. doi: 10.1186/1750-1172-4-7. [DOI] [PMC free article] [PubMed] [Google Scholar]
Associated Data
This section collects any data citations, data availability statements, or supplementary materials included in this article.