

Background: Autocrine purinergic signaling regulates T cell function.
Results: We found that mitochondria are the source of ATP that drives these signaling mechanisms.
Conclusion: Mitochondria are the gate-keepers of T cell function that control purinergic signaling and T cell activation.
Significance: These findings suggest that mitochondria could be therapeutic targets to modulate T cell responses.
Keywords: ATP, Calcium, Cellular Immune Response, Immunosuppression, Infectious Disease, Inflammation, Purinergic Receptor, T Cell, Purinergic Signaling
Abstract
T cells play a central role in host defense. ATP release and autocrine feedback via purinergic receptors has been shown to regulate T cell function. However, the sources of the ATP that drives this process are not known. We found that stimulation of T cells triggers a spike in cellular ATP production that doubles intracellular ATP levels in <30 s and causes prolonged ATP release into the extracellular space. Cell stimulation triggered rapid mitochondrial Ca2+ uptake, increased oxidative phosphorylation, a drop in mitochondrial membrane potential (Δψm), and the accumulation of active mitochondria at the immune synapse of stimulated T cells. Inhibition of mitochondria with CCCP, KCN, or rotenone blocked intracellular ATP production, ATP release, intracellular Ca2+ signaling, induction of the early activation marker CD69, and IL-2 transcription in response to cell stimulation. These findings demonstrate that rapid activation of mitochondrial ATP production fuels the purinergic signaling mechanisms that regulate T cells and define their role in host defense.
Introduction
Critically ill patients often develop profound immunosuppression and nosocomial infections due to impaired T cell function (1). However, the underlying mechanisms leading to T cell dysfunction have remained unclear (2).
The release of cellular ATP via pannexin-1 channels (panx1)2 and autocrine feedback through purinergic receptors are being recognized as essential steps required for proper T cell activation (3, 4). We found that the release of ATP stimulates several purinergic receptors, including P2X1, P2X4, and P2X7 and that these ATP receptors collectively contribute to the influx of extracellular Ca2+ that is required for IL-2 production and effector functions in response to T cell stimulation (5, 6).
Despite the growing recognition of the importance of ATP release and purinergic signaling in T cell activation, the intracellular sources of the ATP that is released from stimulated T cells are not known. ATP is the main energy carrier that drives virtually all cellular processes. Quiescent T cells rely mainly on the metabolism of glucose, amino acids, and fatty acids for ATP production, which depends on the TCA cycle and oxidative phosphorylation (7, 8). T cell stimulation induces a metabolic switch toward aerobic glycolysis, which allows rapidly dividing T cells to meet their extensive energetic and biosynthetic demands. Because of the central role of glycolysis in proliferating T cells, mitochondrial ATP production has been considered to have a secondary, if any role in T cell activation (8–10). However, recent evidence suggests that mitochondria may have a more profound role in T cell activation. For example, mitochondria have been shown to accumulate at the immune synapse (IS) that T cells form with antigen-presenting cells (APC). Mitochondria are thought to be necessary in order to regulate Ca2+ homeostasis and to generate reactive oxygen species that modulate signaling pathways downstream of the TCR/CD28 co-receptor (11–13).
Here we show that mitochondria play another critical role in T cell activation, namely the production of intracellular ATP that is released from stimulated cells in order to fuel the purinergic signaling mechanisms that regulate T cell activation at the IS. Our findings indicate that mitochondria are gate-keepers of T cell activation that coordinate Ca2+ homeostasis with autocrine purinergic signaling processes to orchestrate the complex choreography of T cell activation events required for a successful immune response.
EXPERIMENTAL PROCEDURES
Materials
Dynabeads (Invitrogen Dynal AS, Oslo, Norway) or polystyrene particles (3.0–3.9 μm, Spherotech, Lake Forest, IL) coated with goat anti-mouse IgG antibodies were labeled with mouse anti-human CD3 and anti-human CD28 antibodies (BD Biosciences, San Jose, CA) and used for T cell stimulation. Mouse anti-human CD69-FITC antibodies were purchased from BD Biosciences. MitoTracker Red CM-H2XRos, Fluo-4 AM, Rhod-2 AM, JC-1, and dihydrorhodamine 123 (DHR) were purchased from Molecular Probes (Grand Island, NY). All other reagents were of the highest grade and from Sigma-Aldrich if not stated otherwise.
Cell Culture and Transfection
Jurkat cells (clone E6–1) were obtained from the American Type Culture Collection (ATCC, Manassas, VA) and maintained in RPMI 1640 medium (ATCC) supplemented with 10% heat-inactivated fetal bovine serum, 100 units/ml penicillin and 100 μg/ml streptomycin (Invitrogen) at 37 °C in 5% CO2. Jurkat cells transiently expressing the mitochondrial Ca2+ indicator mito-CAR-GECO1 (14) were generated by electroporation with CMV-mito-CAR-GECO1 (Addgene plasmid number 46022; Addgene, Cambridge, MA) using a Neon transfection system (Invitrogen). Peripheral blood mononuclear cells (PBMC) were isolated from the heparinized venous blood of healthy volunteers using Ficoll-Paque Plus (GE Healthcare, Pittsburgh, PA) and CD4+ T cells were purified from PBMC with anti-CD4 magnetic beads (Miltenyi Biotec, San Diego, CA) according to the manufacturer's instructions.
Mice
The Institutional Animal Care and Use Committee of Beth Israel Deaconess Medical Center (BIDMC) approved the use of animals. C57BL/6J wild-type control mice were from the Jackson Laboratory (Bar Harbor, ME) and panx1 heterozygous knock-out mice were from the Knock-out Mouse Project (KOMP) Repository at the University of California Davis (Davis, CA), backcrossed with C57BL/6J mice, and maintained as homozygous knock-out mouse colony. Animals were euthanized, spleens harvested, red blood cells removed by Ficoll density-gradient centrifugation, and remaining splenocyte preparations cultured in RPMI 1640 medium supplemented with 10% heat-inactivated fetal calf serum. For T cell stimulation, cells (1 × 10⁶/ml) were transferred to 48-well plates precoated with anti-mouse anti-CD3/CD28 antibodies or uncoated wells (control) and incubated for 4 h at 37 °C in a tissue culture incubator. IL-2 mRNA expression was determined by qPCR.
Patients
Eligible patients were patients presenting to the Emergency Department of the Beth Israel Deaconess Medical Center (BIDMC) aged 18 years or older who were clinically diagnosed with severe sepsis or septic shock (classified according to the criteria of the ACCP/SCCM consensus conference, 15). Leukocyte-rich plasma was obtained at the day of diagnosis immediately after blood draw by spontaneous sedimentation (1 × g) over Ficoll-Paque Plus for 30 min at 37 °C. All studies involving human subjects were approved by the Institutional Review Board of BIDMC, and written informed consent was obtained.
ATP Release and Intracellular ATP Production
Jurkat cells or purified CD4+ T cells (5 × 10⁵) were treated with 2-deoxy-d-glucose (2-DG; 20 mm), CCCP (10 μm) or oligomycin (10 μm), or stimulated with anti-CD3/anti-CD28 antibody-coated beads (2 beads/cell) for the indicated periods of time, and intracellular ATP concentrations or ATP in the cell-free supernatant were determined using an ATP Bioluminescence HS II assay kit (Roche, Indianapolis, IN) or high performance liquid chromatography (HPLC) of samples after etheno-derivatization of adenine compounds as previously described (16). For the assessment of intracellular ATP concentrations, cells were snap-frozen in liquid nitrogen, sonicated in the presence of 0.4 m perchloric acid, and analyzed by HPLC.
Assessment of ATP Release at the Cell Surface and of Intracellular ATP Bursts using the ATP Probes 2–2Zn(II) and 1–2Zn(II)
The membrane-bound ATP probe 2–2Zn(II) and the intracellular ATP probe 1–2Zn(II) were a generous gift of Drs. Kurishita and Hamachi (Kyoto University). Binding of ATP and other polyphosphate compounds to these probes causes a shift in their fluorescence properties. 2–2Zn(II) has a lipid anchor residue that binds to the cell membrane and can thus be used to assess ATP release at the cell surface (17). For real-time imaging of ATP release Jurkat cells were seeded on fibronectin-coated glass bottom dishes and stained with 500 nm 2–2Zn(II) in Hank's balanced salt solution (HBSS) for 5 min at 37 °C. Fluorescence live-cell imaging was performed with an inverted Leica DMI6000B microscope (Leica, Wetzlar, Germany) equipped with a temperature controlled stage incubator (Harvard Apparatus, Holliston, MA) and a Spot Boost EMCCD BT 2100 camera (Diagnostic Instruments Inc., Sterling Heights, MI). Fluorescence images were taken through 100× (NA 1.3) or 63× (NA 1.4) oil objectives (Leica) using an YFP-2427A filter set (Semrock, Rochester, NY) and μManager software that was developed in Ron Vale's laboratory at UCSF and with funding from the National Institutes of Health, NIH Grant R01-EB007187. The ATP cell surface concentration was estimated by comparison of fluorescence signals obtained with ATP standards (1–100 μm).
ATP release during synapse formation was also assessed by flow cytometry (BD FACSCalibur, Becton Dickinson, San Jose, CA). Jurkat cells were stained with 2–2Zn(II) as described above and stimulated with anti-CD3/anti-CD28 antibody-coated polystyrene beads, which display negligible autofluorescence. Cell/bead aggregates were identified by their characteristic forward and side scattering properties and the percentage of 2–2Zn(II)+ cells releasing high amounts of ATP was determined where cells were considered 2–2Zn(II)+ whose mean fluorescence intensity was higher than that of 95% of unstimulated control cells.
For imaging of intracellular ATP firing, cells were loaded with 100 μm of the lipid anchor-free ATP probe, 1–2Zn(II), in the presence of 1% DMSO. After incubating for 30 min, cells were washed, stimulated with beads, and studied by fluorescence microscopy.
Imaging of Mitochondria
Translocation of mitochondria to the IS was monitored by bright field and fluorescence time-lapse imaging of Jurkat cells loaded with MitoTracker Red CM-H2XRos (100 nm) for 20 min at 37 °C and stimulated with anti-CD3/CD28 coated beads. To study the association between mitochondrial localization and ATP release, Jurkat cells were loaded with MitoTracker Red CM-H2XRos, washed, and stained with 2–2Zn(II). Three-dimensional imaging was done on a Ultraview Vox Spinning Disk Confocal microscope (PerkinElmer, Boston, MA) equipped with a Hamamatsu-C9100–13 camera (IDDRC Imaging Core, Boston Children's Hospital, Boston, MA) using Volocity Software.
Mitochondrial Membrane Potential (Δψm) and ROS Production
The ratiometric mitochondrial probe JC-1 was used to monitor Δψm after cell stimulation. Cells were incubated with JC-1 (1 μg/ml) for 20 min at 37 °C in RPMI 1640 medium, washed, stimulated with anti-CD3/CD28-coated beads and analyzed by FACS at the indicated times after stimulation. The green (FL1) and red (FL2) fluorescence channels were used to detect the monomer (green) and J-aggregate (red) forms of JC-1.
Dihydrorhodamine 123 (DHR) was used to study mitochondrial ROS production. DHR is cell-permeable and non-fluorescent whereas its oxidation product, rhodamine 123, is positively charged and fluorescent and binds selectively to the inner mitochondrial membrane of living cells (18). Cells were stained with DHR (2 μm, 20 min), stimulated with anti-CD3/CD28 antibody-coated beads and analyzed using live-cell fluorescence microscopy or flow cytometry as described above.
Intracellular Ca2+ Measurement
Jurkat cells were loaded with the Ca2+ indicator Fluo-4 AM (4 μm) to assess Ca2+ signaling before and after treatment (10 min) with CCCP (1 μm), the panx1 inhibitor CBX (20 μm), or the P2 receptor antagonist suramin (200 μm). Cells were stimulated with beads and changes in intracellular Ca2+ levels were measured by flow cytometry. Rhod-2 AM (2 μm) was used to monitor changes in mitochondrial Ca2+ concentrations. Mitochondrial localization of the dye was verified by microscopy. Confocal bright field and fluorescence time-lapse images were captured using a Leica DMI6000B microscope equipped with a spinning disk (CARVII, Becton Dickinson). The mitochondrial Ca2+ influx following bead stimulation after pretreatment (10 min) or not (control) with suramin (200 μm) was measured with a Hitachi F-4500 Fluorescence Spectrophotometer equipped with a stirred cuvette (Hitachi). For some experiments, Jurkat cells expressing the Ca2+ biosensor mito-CAR-GECO1 were used to study changes in mitochondrial Ca2+ concentrations. Time-lapse images were recorded 4–6 h after transfection using an inverted fluorescence microscope.
IL-2 mRNA and CD69 Expression
Cells (5 × 10⁵) were pretreated for 10 min with CCCP (1 μm), potassium cyanide (KCN, 500 μm), rotenone (1 μm), suramin (200 μm), or culture medium (control) followed by stimulation with anti-CD3/CD28 antibody-coated beads for 30 min at 37 °C. Expression of the early T cell activation marker CD69 was analyzed by flow cytometry. IL-2 mRNA expression was determined by quantitative real-time PCR. RNA was extracted using the RNeasy Mini Kit (Qiagen, Valencia, CA) and converted to cDNA (QuantiTect reverse transcription kit, Qiagen) according to the manufacturer's instructions. Real-time PCR was performed on a Mastercycler® ep realplex instrument (Eppendorf, Hamburg, Germany) using iQTM SYBR® Green supermix (Bio-Rad) and QuantiTect primer assays (Qiagen). IL-2 expression was normalized to β-actin, and the comparative Ct method was used for relative quantification of gene expression.
Statistical Analyses
Unless otherwise stated, data are expressed as mean values ± standard deviation (S.D.) of n ≥ 3 independent experiments. Statistical analyses were done using Student's t test and differences were considered statistically significant at p < 0.05.
RESULTS
T Cell Stimulation Triggers Rapid Intracellular ATP Production
We have previously found that stimulated T cells release ATP and that purinergic receptors have an essential role in the early signaling cascade that results in T cell activation. While it is now well established that panx1 channels are one important mechanism by which T cells can release ATP (3, 5, 19, 20), it has remained unclear what triggers the rapid opening of panx1 channels in T cells and how ATP is generated prior to its release. In order to begin addressing these open questions, we examined the timing of ATP release in response to T cell stimulation. Jurkat T cells and primary human CD4+ T cells were stimulated with anti-CD3/CD28 antibody-coated beads and extracellular ATP concentrations were measured with HPLC analysis after different times. We found that both, Jurkat cells and CD4+ T cells very rapidly released ATP with extracellular ATP concentrations reaching half-maximal levels in less than 30 s after cell stimulation (Fig. 1, A and B). Interestingly, Jurkat cells released over 10-times more ATP than CD4+ T cells.
FIGURE 1.
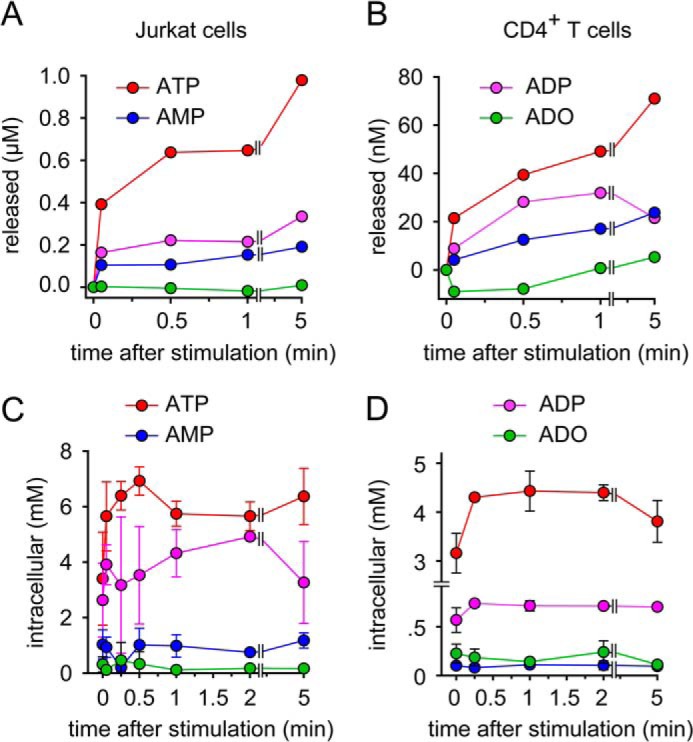
T cell receptor stimulation triggers rapid ATP production and release. A and B, Jurkat cells (A) or primary CD4+ T cells (B) were stimulated with anti-CD3/CD28-coated beads for the indicated times, and concentrations of ATP, ADP, AMP, and adenosine (ADO) in the supernatant were measured with HPLC. C and D, intracellular ATP, ADP, AMP, and adenosine levels were determined in Jurkat cells (C) or CD4+ T cells (D) stimulated with anti-CD3/CD28 beads using HPLC. Data shown are representative of n = 3–6 experiments with similar results.
To search for the cellular sources of the released ATP, we assessed the intracellular concentrations of ATP, ADP, AMP, and adenosine before and after cell stimulation. To our surprise, we found that intracellular ATP levels did not drop in response to ATP release. Instead, we found a rapid increase in intracellular ATP levels that peaked in less than 30 s after cell stimulation. Intracellular ATP levels increased by up to 100% and remained elevated for at least 5 min. Interestingly, this increase in intracellular ATP concentrations was not paralleled by a decrease in intracellular concentrations of ADP, AMP, or adenosine (Fig. 1, C and D). Instead, we found that the concentrations of these ATP precursors barely changed during T cell activation. This suggests that ATP production during T cell activation requires additional mechanisms besides the phosphorylation of low energy adenine precursors that are present in the cells. These additional mechanisms may involve nucleoside scavenging pathways, creatine kinases, and de novo synthesis pathways that form precursors for ATP production (21, 22). Taken together our results indicate that T cell stimulation triggers virtually instantaneous ATP release, which is fueled by equally rapid processes that increase intracellular ATP concentrations.
Mitochondria Produce the ATP That Is Released in Response to T Cell Stimulation
Mammalian cells can generate ATP by phosphorylation of ADP in the glycolysis pathway, which takes place in the cytosol or by the ATP synthase that is driven by the TCA cycle and oxidative phosphorylation in mitochondria. We wondered how these distinct processes contribute to ATP formation in T cells and which of these processes is responsible for the rapid intracellular ATP production that leads to the ATP release we observed during T cell activation. We treated Jurkat cells and primary CD4+ T cells with 2-deoxy-d-glucose (2-DG) in order to block glycolysis or with carbonyl cyanide 3-chlorophenylhydrazone (CCCP) or oligomycin to inhibit mitochondrial ATP production (Fig. 2, A and B). While 2-DG reduced intracellular ATP levels by 25–50% in both cell types, inhibition of mitochondrial ATP production had no effect on intracellular ATP concentrations in Jurkat cells indicating that Jurkat cells, which are leukemia cells, rely mainly on glycolytic metabolism, which is a characteristic feature of cancer cells (Fig. 2A). By contrast, inhibition of mitochondrial ATP production markedly reduced intracellular ATP levels in unstimulated primary CD4+ T cells (Fig. 2B). Interestingly, however, CCCP inhibited the increase in ATP production and the release of ATP in response to the stimulation of Jurkat cells (Fig. 2, C and D). CCCP and rotenone, an inhibitor of complex I of the electron transport chain in mitochondria, had similar effects on ATP release from stimulated primary human CD4+ T cells (Fig. 2E). Taken together, these findings show that mitochondrial ATP production generates the intracellular ATP spike, and the ATP that is released in response to stimulation of Jurkat cells as well as primary CD4+ T cells, regardless of whether or not these cells utilize their mitochondria for bulk ATP production in the resting, non-stimulated state.
FIGURE 2.
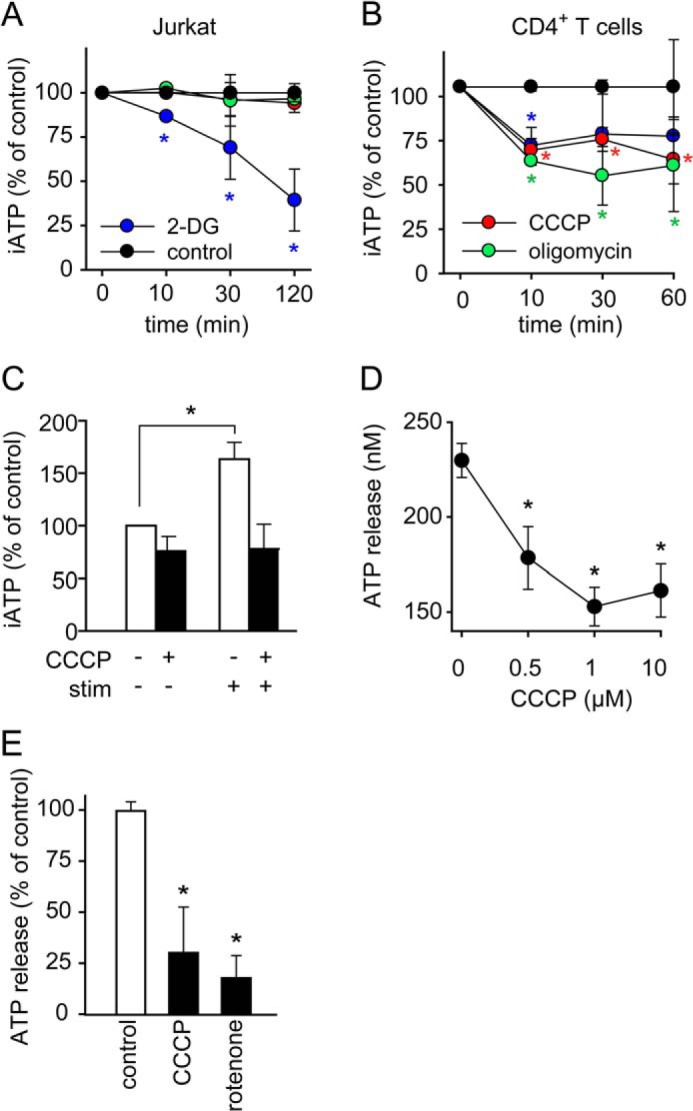
Mitochondria generate the ATP that is released by stimulated T cells. A and B, resting Jurkat cells derive their ATP mainly from glycolysis and primary CD4+ T cells mainly from mitochondrial oxidative phosphorylation. Jurkat cells (A) or CD4+ T cells (B) were treated with vehicle control (black), 2-DG (20 mm, blue) to block glycolysis or CCCP (10 μm, red) or oligomycin (10 μm, green) to inhibit mitochondrial ATP production for the indicated times, and intracellular ATP (iATP) levels were measured with a luciferase bioluminescence assay. Data show means ± S.D. of n = 4 independent experiments; *, p < 0.05 versus control. C, Jurkat cells were treated with CCCP (1 μm) for 10 min, stimulated with anti-CD3/CD28 coated beads for 30 s, and iATP was assessed by HPLC. Data represent means ± S.D. of n = 3 separate experiments; *, p < 0.05. D and E, Jurkat cells (D) were treated with the indicated concentrations of CCCP and CD4+ T cells (E) were treated with CCCP (1 μm), rotenone (1 μm) or vehicle control for 10 min and ATP release into the supernatant was measured with a bioluminescence assay after stimulating cells for 30 s with anti-CD3/CD28-coated beads. Data represent means ± S.D. (n = 3); *, p < 0.05 versus control.
ATP Release Is a Dynamic Process Associated with Immune Synapse Formation
T cell activation triggers a complex sequence of events that results in the formation of an immune synapse (IS) between T cells and accessory cells (23). The IS facilitates close cellular interactions between these cells, which is required for thorough antigen processing and the commitment of T cells to proliferate. Several previous reports have shown that mitochondria translocate to the IS during T cell activation (12, 24). Taken together with our findings, this suggests that mitochondria accumulate near the IS to generate intracellular ATP for release into the synaptic cleft. To study this possibility, we developed a new imaging technique that has allowed us to monitor the spatiotemporal dynamics of ATP release during IS formation. For that purpose, we used a novel fluorescent small molecular ATP probe designed by Dr. Kurishita in the laboratory of Professor Hamachi at Kyoto University (17). This probe, named 2–2Zn(II) features a lipid anchor residue which allows it to bind to the outer membrane of living cells This ATP probe made it possible to monitor submicromolar ATP concentration changes at the T cell surface in real-time using live-cell fluorescence imaging techniques (supplemental Fig. S1, A and B). Using this approach, we found that T cell stimulation with beads carrying antibodies to stimulate TCR/CD28 receptors triggered instantaneous ATP release from membrane sites associated with the beads (Fig. 3A, supplemental Movie S1). ATP release intensified at the IS during T cell activation, reaching local ATP concentrations of an estimated 80 μm at the cell surface (Fig. 3B, supplemental Fig. S1C). We also used 2–2Zn(II) in conjunction with flow cytometry and found that a significantly higher percentage of cells engaged with beads stained positive for ATP release compared with cells that were not attached to beads (Fig. 3C). The percentage of T cells with elevated ATP release peaked immediately after cell stimulation and remained elevated over a period of at least 60 min (Fig. 3D). To further analyze how focal TCR/CD28 stimulation influences ATP production and release we stimulated cells with beads coated with anti-CD3/CD28 antibodies or with soluble anti-CD3 antibodies. We then measured ATP concentrations in the supernatant and inside the cells. We found that both ATP release (Fig. 3E) and the increase in intracellular ATP (Fig. 3F) were significantly higher when cells were stimulated with beads coated with anti-CD3/CD28 antibodies compared with cell stimulation with soluble anti-CD3 antibodies alone.
FIGURE 3.
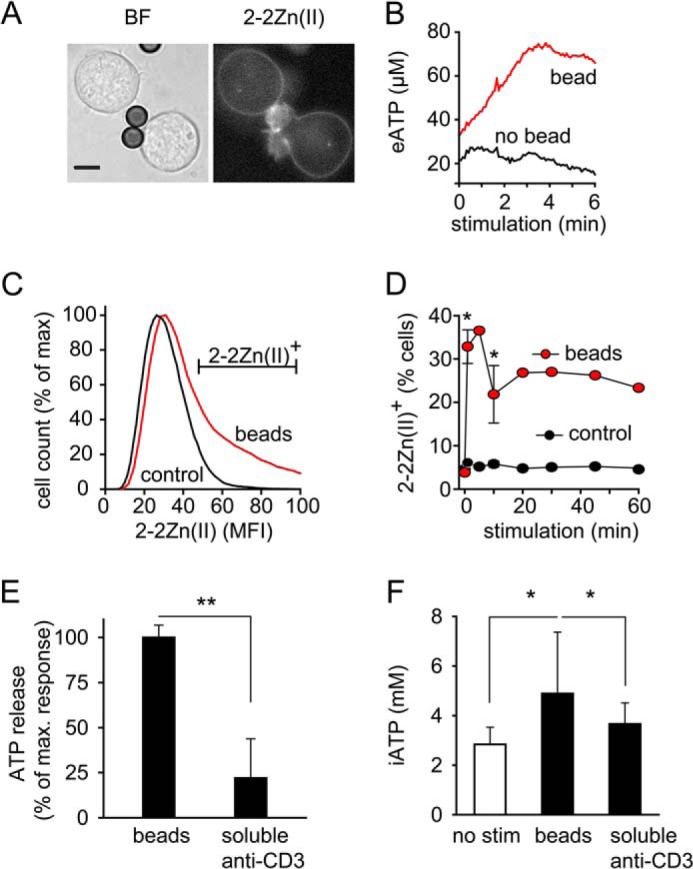
T cell receptor/CD28 stimulation triggers ATP release at the immune synapse. A and B, Jurkat cells stained with the membrane-bound fluorescent ATP probe 2–2Zn(II) were stimulated with anti-CD3/CD28 antibody-coated beads, and ATP release at the IS was visualized with epifluorescence microscopy and analyzed over time (A; scale bar, 5 μm; 63× oil objective, NA 1.4; see also supplemental Movie S1). B, representative fluorescence traces at sites of bead/cell contact and of basal surface ATP release (eATP) at opposite cell regions are shown. ATP concentrations at the cell surface were estimated by addition of ATP standards of known concentrations. C and D, Jurkat cells were stained with 2–2Zn(II), stimulated with beads or not (control), and ATP release was analyzed with flow cytometry. Representative histograms 20 min after stimulation (C) and the percentage of cells releasing ATP at indicated times after stimulation are shown (D). Data are means ± S.D.; n = 2–3; *, p < 0.05 versus control. E and F, Jurkat cells were stimulated with beads coated with anti-CD3/CD28 antibodies or with soluble anti-CD3 (0.5 μg/ml) for 1 min, and ATP release into the supernatant (E) or intracellular ATP concentrations (F) were determined. Data shown are means ± S.D. (n = 6); *, p < 0.05; **, p < 0.01.
Mitochondrial Translocation Facilitates ATP Release at the IS
The results above suggest that the cellular redistribution of mitochondria contributes to localized ATP release at the IS. To test this notion, we labeled Jurkat cells with MitoTracker dye and monitored mitochondrial translocation during IS formation. Mitochondria rapidly redistributed to the site of cell stimulation and accumulated at the IS that the cells formed with beads (Fig. 4A, supplemental Movie S2). Dual staining of Jurkat cells with 2–2Zn(II) and MitoTracker dye revealed hotspots of local ATP release at membrane regions near the mitochondria that accumulated at the IS during T cell activation (Fig. 4B, supplemental Movie S3).
FIGURE 4.
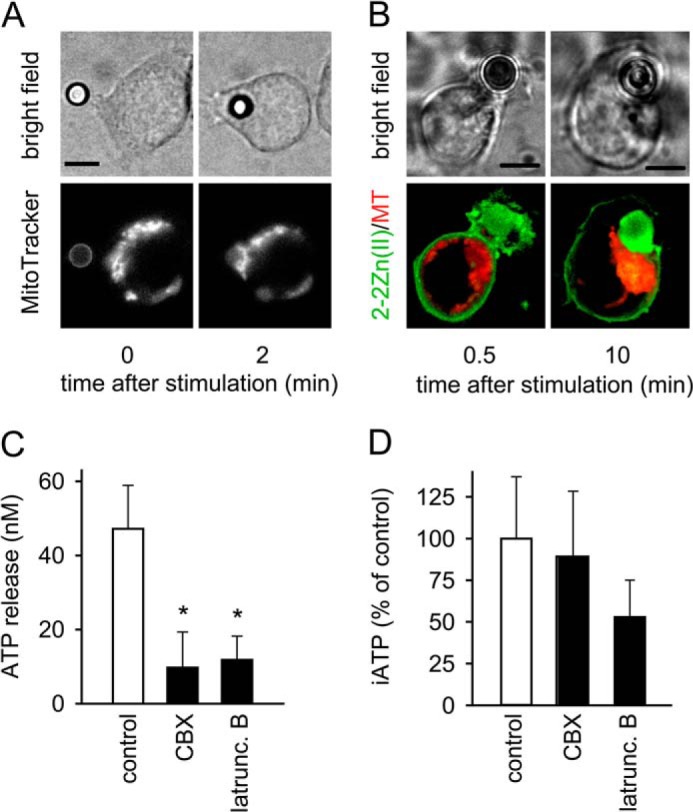
Mitochondrial accumulation at the immune synapse drives localized ATP release. A, Jurkat cells were loaded with MitoTracker Red CM-H2XRos, stimulated with anti-CD3/CD28 antibody-coated beads, and translocation of mitochondria to the IS was observed by epifluorescence time-lapse imaging (100× oil objective, NA 1.3; 2 s interval; see also supplemental Movie S2). B, ATP release and location of mitochondria was assessed in Jurkat cells stained with 2–2Zn(II) (for ATP detection; green) and MitoTracker Red CM-H2XRos (for mitochondrial staining; red) during formation of an immune synapse (IS; left) or after establishing of the bead/cell contact (100× oil objective, NA 1.4; z-stack projections, 0.1 μm slice increment; see also supplemental Movie S3). MT, MitoTracker; scale bars, 5 μm. C and D, Jurkat cells were treated or not (control) with CBX (20 μm) or latrunculin B (10 μg/ml) for 20 min. ATP concentrations in the supernatant (C) or inside the cells (D) were determined after stimulation for 1 min with anti-CD3/CD28 antibody-coated beads. Data shown are means ± S.D. (n = 3–8); *, p < 0.05.
IS formation and mitochondrial translocation are actin cytoskeleton-dependent processes (12, 25). Latrunculin B, an inhibitor of actin polymerization, markedly reduced the release of ATP from cells stimulated with beads. This suppression by latrunculin B was in the same range as that caused by the gap channel inhibitor carbenoxolone (CBX; Fig. 4C). In contrast to CBX, latrunculin B also reduced the increase in intracellular ATP levels after cell stimulation (Fig. 4D). Taken together, these findings suggest that mitochondrial translocation has an important role in shaping the spatiotemporal patterns of ATP release at the IS during T cell activation.
T Cell Stimulation Is Associated with a Rapid Drop in Mitochondrial Membrane Potential Δψm
The findings above suggest that ATP release is not merely a function of panx1 channel opening, but rather associated with rapid activation of mitochondrial ATP production. Mitochondrial ATP production is driven by oxidative phosphorylation, which requires the maintenance of an electrochemical gradient across the inner mitochondrial membrane that is sustained by the electron transport chain of mitochondria. The mitochondrial membrane potential (Δψm) is therefore an important parameter related to the capacity of cells to produce ATP with the help of their mitochondria. To study the functional response of mitochondria during T cell stimulation, we investigated whether T cell stimulation affects Δψm. Cells were stained with JC-1 and analyzed by flow cytometry. JC-1 is a fluorescent mitochondrial probe that allows monitoring of Δψm based on changes in its green and red fluorescence properties. Stimulation with anti-CD3/CD28 antibody coated beads caused a rapid increase in green and a concomitant decrease in red JC-1 fluorescence, suggesting a drop in Δψm (Fig. 5A). These changes occurred virtually instantaneously after cell stimulation (Fig. 5, B and C). The ratio of red versus green fluorescence, a measure for Δψm, dropped rapidly within 1 min after the stimulation of primary CD4+ T cells (Fig. 5B) and Jurkat cells (Fig. 5C) and remained below the values of unstimulated control cells for at least 30 min. CCCP, which uncouples oxidative phosphorylation, was used as a control and caused a further drop and complete dissipation of Δψm. The decrease in Δψm following T cell stimulation suggests intense mitochondrial activity and ATP production due to heavy ion flux and ATP release across the mitochondrial membrane. As with stimulated T cells, firing neurons are also known to show a drop in Δψm during bursts of heavy mitochondrial activity, which involves vigorous mitochondrial Ca2+ uptake and ATP release (26). Taken together with these findings, our results suggest that mitochondrial depolarization and massive mitochondrial ATP production are characteristics not only of synaptic activity in neurons but also in T cells that generate ATP for release into the IS.
FIGURE 5.
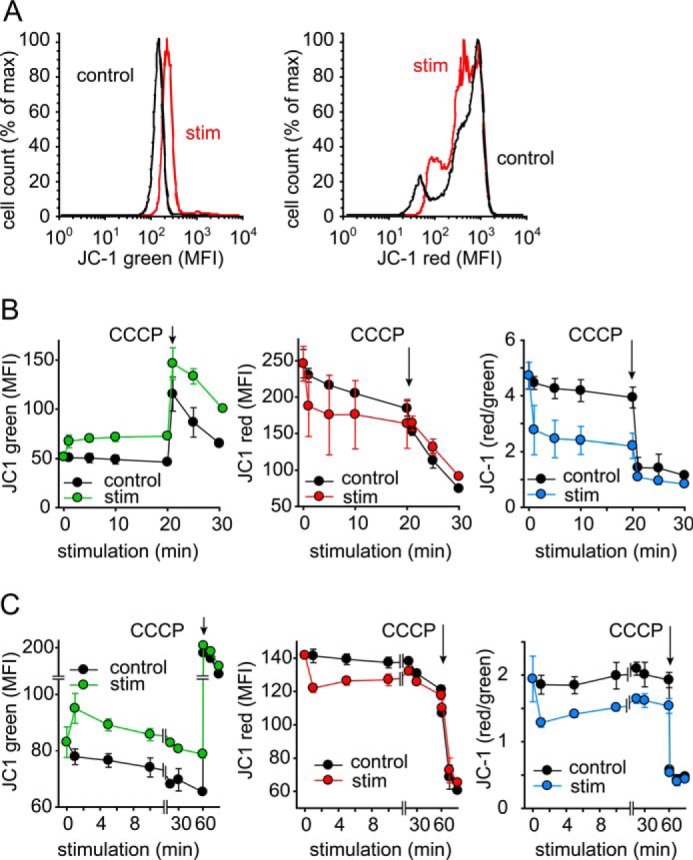
TCR stimulation decreases the mitochondrial membrane potential Δψm in T cells. CD4+ T cells (A and B) or Jurkat cells (C) were stained with JC-1, stimulated with anti-CD3/CD28-coated beads for the indicated periods of time, and red and green JC-1 fluorescence was recorded with a flow cytometer. Representative histograms after 20 min stimulation are shown in A. CCCP (10 μm) was added as a control for maximal depolarization. Data are means ± S.D. of n = 3–4 independent experiments.
T Cell Stimulation Triggers Mitochondrial ROS Production
The decrease in Δψm in stimulated T cells described above is consistent with increased mitochondrial activity and ATP production (26). Enhanced TCA cycle activity that energizes the electron transport chain not only increases the capability of mitochondria to produce ATP but also to form reactive oxygen species (ROS) as byproducts of ATP production. In T cells, ROS are almost exclusively generated in mitochondria and ROS formation can therefore serve as a read-out of mitochondrial activity. Using the cell-permeable fluorogenic probe dihydrorhodamine 123 (DHR) for the monitoring of ROS formation, we found that T cell stimulation increased mitochondrial ROS production (Fig. 6). When studying ROS formation with flow cytometry, we found that mitochondrial activity peaked instantly after cell stimulation. ROS production remained elevated above baseline for at least 20 min after stimulation of CD4+ T cells or Jurkat cells with beads (Fig. 6A). This rapid triggering of mitochondrial activity was also seen in live-cell imaging experiments, where we observed marked ROS production in CD4+ T cells and Jurkat cells after their initial contact and stimulation with beads (Fig. 6B, supplemental Movie S4).
FIGURE 6.
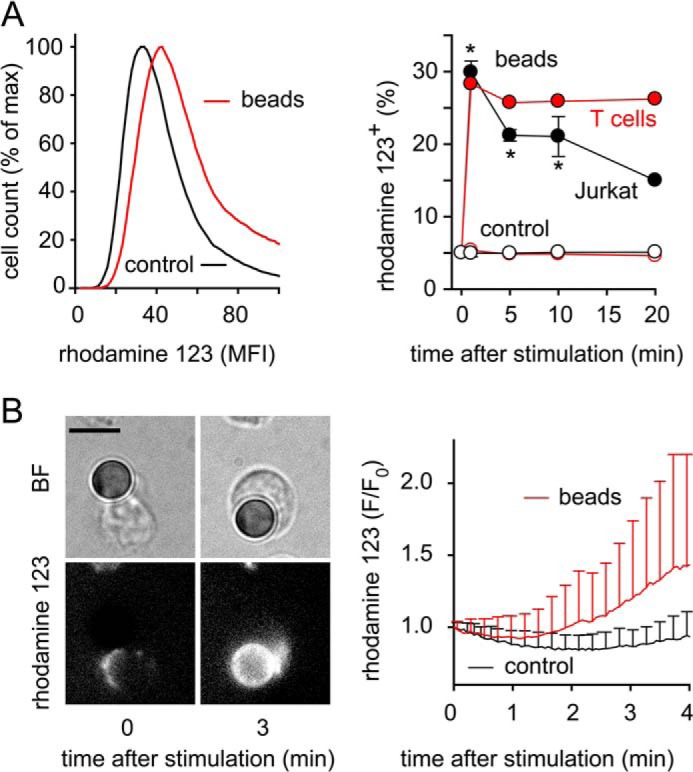
Stimulation rapidly increases mitochondrial ROS production in T cells. A and B, mitochondrial ROS production was measured with DHR to assess mitochondrial activation. Panel A shows representative histograms of Jurkat cells (left) or the percentage of ROS producing Jurkat and CD4+ T cells (right) stimulated for the indicated times with beads and analyzed by flow cytometry; gating was done for cells attached or not attached (control) to beads, respectively; n = 2–4; *, p < 0.05 versus control. B, CD4+ T cells loaded with DHR were stimulated with beads, and ROS formation was monitored by time-lapse fluorescence video microscopy (left) and analyzed with image analysis software (right; mean ± S.D. of 19 stimulated and 23 unstimulated cells of three independent experiments); BF, bright field image; scale bar, 5 μm; see also supplemental Movie S4.
Mitochondrial Ca2+ Influx Following T Cell Stimulation Triggers Intracellular ATP Production
Activation of oxidative phosphorylation requires mitochondrial Ca2+ uptake (27–29). Using the mitochondrial Ca2+ probe Rhod-2, we found that T cell stimulation with beads caused rapid mitochondrial Ca2+ uptake in primary CD4+ T cells (Fig. 7A, supplemental Movie S5) and in Jurkat cells (Fig. 7B, supplemental Movie S6). Treatment with latrunculin B or CCCP to prevent mitochondrial translocation or to induce disruption of Δψm, respectively, completely abolished mitochondrial Ca2+ influx in Jurkat cells expressing the mitochondria-targeting Ca2+ biosensor mito-CAR-GECO1 (Fig. 7, C and D, supplemental Movie S7). Suramin had no effect in these experiments, indicating that mitochondrial Ca2+ uptake occurs independently of P2 receptors (Fig. 7E). To assess concomitant intracellular ATP production, we used an intracellular ATP probe, 1–2Zn(II) that was also developed in the laboratory of Prof. Hamachi and is structurally identical to 2–2Zn(II), except that 1–2Zn(II) lacks the membrane anchor residue and can be taken up by cells (30). Using this probe, we found that mitochondrial firing in response to cell stimulation resulted in rapid bursts of intracellular ATP release, apparently by the release of ATP from activated mitochondria (supplemental Movie S8). Taken together, these findings demonstrate that T cell stimulation triggers rapid mitochondrial ATP production accompanied by bursts in mitochondrial Ca2+ uptake and oxidative phosphorylation, as well as by a sudden drop in Δψm.
FIGURE 7.
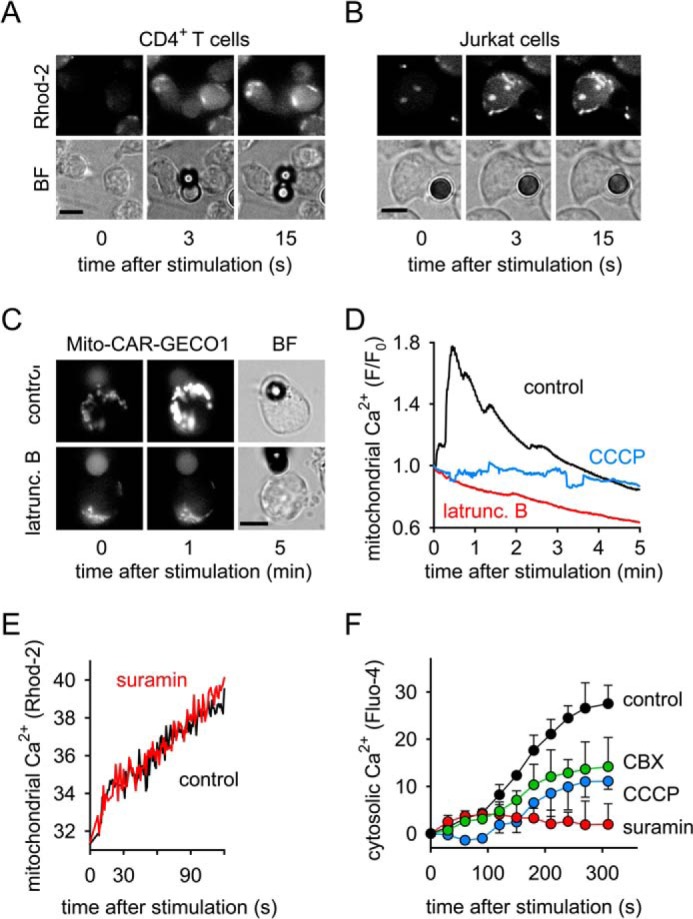
Rapid mitochondrial activation and Ca2+ influx precede sustained cytosolic Ca2+ signaling. A and B, primary human CD4+ T cells (A) and Jurkat cells (B) were loaded with the mitochondrial Ca2+ probe Rhod-2, stimulated with anti-CD3/CD28 antibody-coated beads, and mitochondrial Ca2+ firing was assessed with live-cell imaging (100× oil objective, NA 1.3; see also s u p p l em e n t a l M o v i e s S 5 a n d S 6). C and D, Jurkat cells expressing the mitochondrial Ca2+ biosensor mito-CAR-GECO1 were treated or not (control) with latrunculin B (10 μg/ml) or CCCP (10 μm) for 10 min and stimulated with anti-CD3/CD28 antibody-coated beads. Changes in mitochondrial Ca2+ were observed by time-lapse fluorescence video microscopy (time interval: 1s; 63× oil objective, NA 1.4) and analyzed with image analysis software (D; each trace represents the mean of n = 10 stimulated cells of 2 independent experiments). BF, bright field image; scale bars: 5 μm; see also supplemental Movie S7. E, Jurkat cells were loaded with the mitochondrial Ca2+ probe Rhod-2, treated (red line) or not (control; black line) with the P2X receptor inhibitor suramin (200 μm) for 10 min, stimulated with anti-CD3/CD28 antibody-coated beads, and analyzed with a fluorescence spectrophotometer. Data shown are means of three separate experiments. F, Jurkat cells were loaded with the cytosolic Ca2+ probe Fluo-4, treated or not (control) with suramin (200 μm; red), CCCP (1 μm; blue), or the panx1 blocker CBX (30 μm; green) for 10 min, stimulated with beads, and changes in cytosolic Ca2+ levels were monitored with flow cytometry; data shown are means ± S.D. of n = 3 independent experiments.
Mitochondrial ATP Production Regulates Cellular Ca2+ Influx in Response to T Cell Stimulation
Proper T cell activation is known to require an initial increase in intracellular Ca2+ concentrations followed by a sustained elevation of cytosolic Ca2+ levels due to the influx of Ca2+ from the extracellular space (31). We have previously shown that P2X receptors contribute to the Ca2+ influx in stimulated T cells (4, 5). To test whether mitochondrial activation is required for Ca2+ influx, we loaded cells with the cytosolic Ca2+ indicator Fluo-4 AM and studied how inhibition of mitochondrial ATP production affects Ca2+ signaling in the cytosol of stimulated T cells. We found that inhibition of mitochondrial ATP production with CCCP blocked sustained Ca2+ signaling. A similar effect was seen by inhibition of ATP release with the panx1 inhibitor CBX. Inhibition of P2 receptors with suramin further blocked cellular Ca2+ signaling (Fig. 7F), but did not alter mitochondrial Ca2+ uptake (Fig. 7E). This indicates that mitochondrial ATP production is required for the sustained phase of Ca2+ signaling, and that mitochondrial ATP and purinergic signaling are needed to sustain Ca2+ levels in stimulated T cells.
Mitochondrial ATP Production Is Required to Elicit Functional T Cell Responses
The findings described above indicate that mitochondrial ATP firing is an essential step in T cell activation. The importance of this process for proper T cell activation is supported by the findings that inhibition of mitochondria with CCCP blocked the expression of the early T cell activation marker CD69 and the transcription of IL-2 mRNA in Jurkat cells (Fig. 8, A and B). Likewise, IL-2 expression was suppressed in primary human CD4+ T cells treated with the mitochondrial inhibitors CCCP, KCN, or rotenone or with suramin (Fig. 8C). In addition, we found that mitochondrial ROS production in T cells of sepsis patients was significantly lower compared with cells from healthy controls (Fig. 8D). Although the mechanisms involved in the ATP release are still not completely understood, it seems likely that opening of panx1 channels is essential. In support of this assumption, we found that IL-2 expression was significantly suppressed in T cells of panx1 knock-out mice (Fig. 8E). The absence of panx1 channels and blockage of mitochondrial ATP production had similar effects on T cell activation. Taken together, these findings show that mitochondrial ATP production, ATP release via panx1, and purinergic signaling are critical requirements for proper T cell function and a successful host defense.
FIGURE 8.
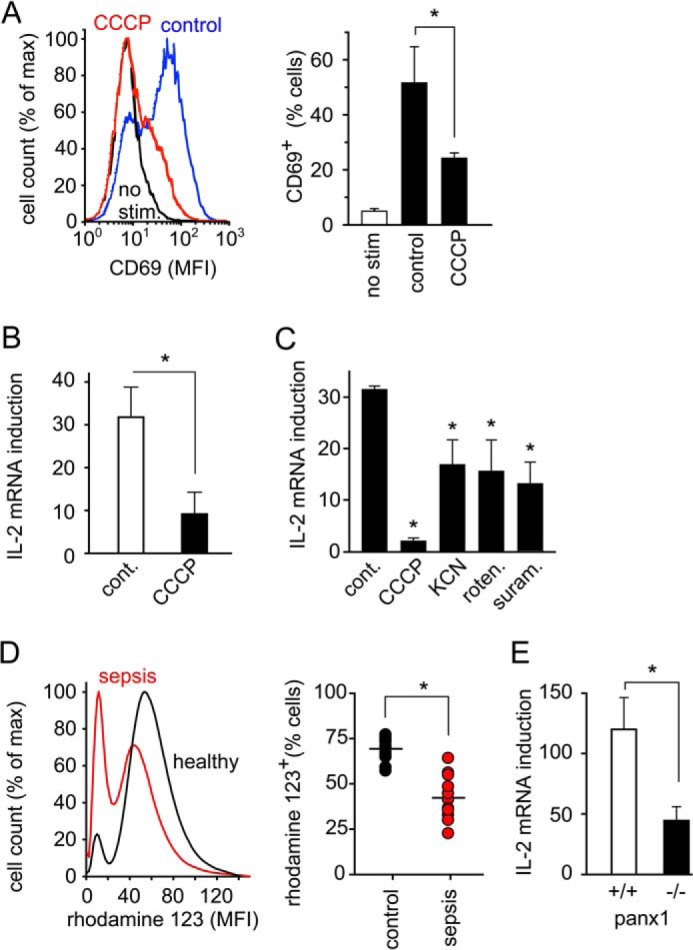
Proper T cell effector functions require mitochondrial ATP production. A, Jurkat cells were treated (red line) or not (black and blue line) with CCCP (1 μm) for 10 min and stimulated or not (black line) for 30 min with anti-CD3/CD28 beads. The expression of the early T cell activation marker CD69 was analyzed by flow cytometry. Representative histograms are depicted in the left panel. B and C, IL-2 mRNA expression was measured in Jurkat cells (B) or primary CD4+ T cells (C) stimulated with anti-CD3/CD28 beads for 30 min in the presence or absence (control) of blockers of mitochondrial function (CCCP, 1 μm; KCN, 500 μm; rotenone, 1 μm) or the P2X receptor inhibitor suramin (200 μm); data are means of n = 3–5 independent experiments; *, p < 0.05 versus control. D, mitochondrial function is impaired in sepsis patients. Mitochondrial ROS production was assessed in lymphocytes from septic patients (n = 10) and healthy subjects (n = 13) using DHR and flow cytometry. Representative histograms are shown on the left. MFI, mean fluorescence intensity; *, p < 0.05. E, transcription of IL-2 mRNA after CD3/CD28 stimulation (4 h) in splenocytes of panx1 knock-out or wild type mice; n = 5 animals per group, *, p < 0.05.
DISCUSSION
Our findings indicate that mitochondria have a central role in T cell activation by producing the ATP that is required for purinergic signaling and maintaining Ca2+ homeostasis. Mitochondria thus occupy a key regulatory position in which they integrate the inside-out (purinergic) and outside-in (Ca2+) signaling networks that control T cell activation. This finding is interesting given the fact that glycolysis, and not mitochondrial ATP production, is the predominant mechanism by which activated T cells generate the bulk of their ATP demand (7–9). The function of mitochondria during T cell activation shifts from ATP production to the production of TCA intermediates that are required for biosynthesis (9, 32). However, emerging evidence points to a more complex involvement of mitochondria in the T cell activation process (33, 34). Our current findings support this notion. We found that mitochondria are not only rapidly activated but that they also produce large amounts of ATP immediately after TCR/CD28 stimulation. Mitochondrial ATP production is a highly dynamic process that can rapidly up-regulate intracellular ATP to levels that match regional demands, specifically at the IS. Mitochondria are responsible for these rapid increases in intracellular ATP levels and for the production of the ATP that is delivered into the extracellular space during cell stimulation, where ATP propels the purinergic signaling events that trigger T cell activation. However, our data also show that the rapid increase in cellular ATP production during T cell activation requires additional mechanisms that provide the ADP that mitochondria phosphorylate to ATP. It is likely that purine salvage pathways are involved in these mechanisms (22). Several immune dysfunctions, including SCID, are caused by deficiencies of key enzymes involved in purine salvage pathways (35–37). However, it is also possible that de novo purine synthesis and creatine kinases are involved in the formation of ADP that can be phosphorylated and converted to ATP in mitochondria (21). Further studies are needed to delineate these mechanisms.
Our novel finding that mitochondria provide ATP for autocrine purinergic signaling at the IS is supported by previous reports that suggest a direct involvement of mitochondria in T cell activation. For example, mitochondria were shown to accumulate at the IS and to regulate store-operated Ca2+ signaling by buffering inflowing Ca2+ ions, thus preventing termination of Ca2+ signaling (11, 12, 38). Our current findings extend this concept by showing that mitochondria can regulate Ca2+ signaling at the IS by fueling purinergic signaling mechanisms that facilitate sustained Ca2+ influx in a P2X receptor-mediated fashion. Our novel concept that mitochondria pump ATP into the IS extends previous reports that the mitochondrial fission factor DRP-1 positions mitochondria to the peripheral supramolecular activation cluster (pSMAC) of the IS and regulates mitochondrial ATP production near the IS (24).
Several other reports have suggested that mitochondria-derived ROS, the byproducts of mitochondrial ATP production, function as secondary messengers that are necessary for T cell activation (39–41). Recently, Sena et al. reported that ROS specifically generated at complex III of the electron transport chain are required for activation of nuclear factor of activated T cells (NFAT) and subsequent induction of IL-2 and proliferation in CD4+ T cells. The authors also showed that ROS production depends on Ca2+ influx and mitochondrial Ca2+ uptake (13). Taken together with these findings, our results indicate that mitochondrial ROS as well as ATP production have important roles in T cell activation. We found a spike in ATP production that may fuel autocrine purinergic signaling processes that contribute to Ca2+ influx as well as intracellular processes associated with T cell proliferation. Taken together with previous reports, we conclude that mitochondria have at least three different tasks in T cell activation: generating a rapid burst in ATP production that triggers autocrine purinergic signaling, production of ROS that regulate downstream signaling pathways, and regulation of cytosolic Ca2+ homeostasis that sustains T cell responses.
T cells are able to respond with remarkable sensitivity and selectivity to the faint antigen-induced signals generated at the IS (42). While it has been proposed that T cells must possess sophisticated amplification mechanisms that help them respond to such weak external signals, the nature of these amplification mechanisms has remained elusive (42). Purinergic signal amplification could explain this enigma. We have previously shown that panx1 and P2X1 and P2X4 receptors accumulate at the IS (5). Our current results show that this process is preceded by rapid induction of vigorous mitochondrial ATP production and the translocation of activated mitochondria to the IS. The accumulation of mitochondria that generate ATP, panx1 channels that release ATP, and P2X receptors that facilitate Ca2+ influx in response to the released ATP at the IS results in a purinergic signaling complex that can efficiently amplify TCR signaling in the synaptic cleft.
Based on our findings, we propose a yinyang-like mechanism whereby mitochondria integrate purinergic and Ca2+ signaling at the IS (Fig. 9). TCR stimulation initially triggers an increase in mitochondrial Ca2+ levels that is followed by rapid ATP production and the release of ATP into the extracellular space via panx1 channels and probably additional release mechanisms (3, 5, 43). ATP in the IS then stimulates P2X receptors that function as ATP-gated Ca2+ channels and facilitate Ca2+ influx. These inside-out/outside-in feedback loops escalate mitochondrial ATP production, thereby amplifying TCR/CD28 signaling and sustaining Ca2+ influx through P2X receptors.
FIGURE 9.
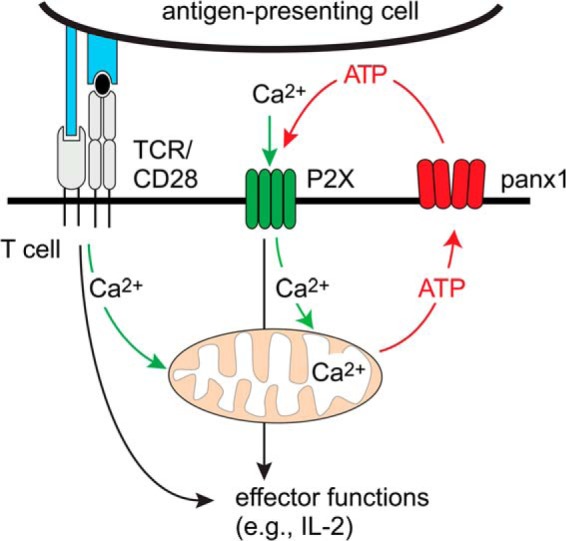
Proposed model of the regulation of Ca2+ and purinergic signaling by mitochondrial firing. TCR/CD28 stimulation triggers Ca2+ release from intracellular stores, resulting in mitochondrial Ca2+ firing and ATP production that feeds autocrine purinergic signaling and prolonged Ca2+ influx via P2X1 and P2X4 receptors at the immune synapse.
Impairments of these interconnected signaling processes can inhibit T cell function and cause immunosuppression (44). Critical care patients are particularly prone to such complications, which increases their risk of developing nosocomial infections and sepsis (1, 2). It has long been known that patients with severe trauma or burn injuries are unable to appropriately generate IL-2 in response to T cell stimulation (45, 46) and that Ca2+ homeostasis in T cells is affected (47). We found that mitochondrial activity in lymphocytes of septic patients is impaired, which may be an underlying cause of T cell suppression in these patients. This notion is supported by findings that oxygen consumption of peripheral blood mononuclear cells is lower in sepsis patients than in patients without sepsis (48, 49) and that the cellular ATP content of circulating cells is lower and lactate levels are higher in sepsis patients compared with patients without sepsis (50).
All these findings point toward mitochondria as important regulators of T cell function and as sentinels that help protect the host against infections and sepsis. Mitochondria share many similarities with their close bacterial relatives that include the rickettsiae, which are obligate intracellular aerobic bacteria and cause devastating diseases such as typhus (51). In contrast to these pathogens, mitochondria have evolved to protect their mammalian host from microbial invaders and their own bacterial relatives.
Supplementary Material
Acknowledgments
We thank Drs. Yasutaka Kurishita and Itaru Hamachi for kindly providing the fluorescent ATP probes and Dr. Simon Robson for stimulating discussions and for his continued support.
This work was funded in part by Grants GM-51477, GM-60475, AI-080582, and T32GM103702 from the National Institutes of Health (to W. G. J.), by The Harvard Digestive Disease Center, and by a fellowship from the German Research Foundation (DFG), LE-3209/1-1 (to C. L.).

This article contains supplemental Fig. S1 and Movies S1–S8.
- panx1
- pannexin-1
- APC
- antigen-presenting cells
- CBX
- carbenoxolone
- CCCP
- carbonyl cyanide 3-chlorophenylhydrazone
- 2-DG
- 2-deoxy-d-glucose
- DHR
- dihydrorhodamine 123
- IS
- immunological synapse
- PBMC
- peripheral blood mononuclear cells
- ROS
- reactive oxygen species
- TCR
- T cell receptor.
REFERENCES
- 1. Hotchkiss R. S., Monneret G., Payen D. (2013) Immunosuppression in sepsis: a novel understanding of the disorder and a new therapeutic approach. Lancet Infect. Dis. 13, 260–268 [DOI] [PMC free article] [PubMed] [Google Scholar]
- 2. Hotchkiss R. S., Monneret G., Payen D. (2013) Sepsis-induced immunosuppression: from cellular dysfunction to immunotherapy. Nat. Rev. Immunol. 13, 862–874 [DOI] [PMC free article] [PubMed] [Google Scholar]
- 3. Schenk U., Westendorf A. M., Radaelli E., Casati A., Ferro M., Fumagalli M., Verderio C., Buer J., Scanziani E., Grassi F. (2008) Purinergic control of T cell activation by ATP released through pannexin-1 hemichannels. Sci. Signal 1, ra6. [DOI] [PubMed] [Google Scholar]
- 4. Yip L., Woehrle T., Corriden R., Hirsh M., Chen Y., Inoue Y., Ferrari V., Insel P. A., Junger W. G. (2009) Autocrine regulation of T-cell activation by ATP release and P2X7 receptors. FASEB J. 23, 1685–1693 [DOI] [PMC free article] [PubMed] [Google Scholar]
- 5. Woehrle T., Yip L., Elkhal A., Sumi Y., Chen Y., Yao Y., Insel P. A., Junger W. G. (2010) Pannexin-1 hemichannel-mediated ATP release together with P2X1 and P2X4 receptors regulate T-cell activation at the immune synapse. Blood 116, 3475–3484 [DOI] [PMC free article] [PubMed] [Google Scholar]
- 6. Junger W. G. (2011) Immune cell regulation by autocrine purinergic signaling. Nat. Rev. Immunol. 11, 201–212 [DOI] [PMC free article] [PubMed] [Google Scholar]
- 7. Pearce E. L. (2010) Metabolism in T cell activation and differentiation. Curr. Opin Immunol. 22, 314–320 [DOI] [PMC free article] [PubMed] [Google Scholar]
- 8. Fox C. J., Hammerman P. S., Thompson C. B. (2005) Fuel feeds function: energy metabolism and the T-cell response. Nat. Rev. Immunol. 5, 844–852 [DOI] [PubMed] [Google Scholar]
- 9. Wang R., Green D. R. (2012) Metabolic reprogramming and metabolic dependency in T cells. Immunol. Rev. 249, 14–26 [DOI] [PMC free article] [PubMed] [Google Scholar]
- 10. Gerriets V. A., Rathmel J. C. (2012) Metabolic pathways in T cell fate and function. Trends Immunol. 33, 168–173 [DOI] [PMC free article] [PubMed] [Google Scholar]
- 11. Hoth M., Fanger C. M., Lewis R. S. (1997) Mitochondrial regulation of store-operated calcium signaling in T lymphocytes. J. Cell Biol. 137, 633–648 [DOI] [PMC free article] [PubMed] [Google Scholar]
- 12. Quintana A., Schwindling C., Wenning A. S., Becherer U., Rettig J., Schwarz E. C., Hoth M. (2007) T cell activation requires mitochondrial translocation to the immunological synapse. Proc. Natl. Acad. Sci. U.S.A. 104, 14418–14423 [DOI] [PMC free article] [PubMed] [Google Scholar]
- 13. Sena L. A., Li S., Jairaman A., Prakriya M., Ezponda T., Hildeman D. T., Wang C., Schumacker P. T., Licht J. D., Perlman H., Bryce P. J., Chandel N. S. (2013) Mitochondria are required for antigen-specific T cell activation through reactive oxygen species signaling. Immunity 38, 225–236 [DOI] [PMC free article] [PubMed] [Google Scholar]
- 14. Wu J., Liu L., Matsuda T., Zhao Y., Rebane A., Drobizhev M., Chang Y. F., Araki S., Arai Y., March K., Hughes T. E., Sagou K., Miyata T., Nagai T., Li W., Campbell R. E. (2013) Improved orange and red Ca2+ indicators and photophysical considerations for optogenetic applications. ACS Chem. Neurosci. 4, 963–972 [DOI] [PMC free article] [PubMed] [Google Scholar]
- 15. Bone R. C., Sibbald W. J., Sprung C. L. (1992) The ACCP-SCCM consensus conference on sepsis and organ failure. Chest 101, 1481–1483 [DOI] [PubMed] [Google Scholar]
- 16. Lazarowski E. R., Tarran R., Grubb B. R., van Heusden C. A., Okada S., Boucher R. C. (2004) Nucleotide release provides a mechanism for airway surface liquid homeostasis. J. Biol. Chem. 279, 36855–36864 [DOI] [PMC free article] [PubMed] [Google Scholar]
- 17. Kurishita Y., Kohira T., Ojida A., Hamachi I. (2012) Organelle-localizable fluorescent chemosensors for site-specific multicolor imaging of nucleoside polyphosphate dynamics in living cells. J. Am. Chem. Soc. 134, 18779–18789 [DOI] [PubMed] [Google Scholar]
- 18. Royall J. A., Ischiropoulos H. (1993) Evaluation of 2′,7′-dichlorofluorescein and dihydrorhodamine 123 as fluorescent probes for intracellular H2O2 in cultured endothelial cells. Arch. Biochem. Biophys. 302, 348–355 [DOI] [PubMed] [Google Scholar]
- 19. Woehrle T., Yip L., Manohar M., Sumi Y., Yao Y., Chen Y., Junger W. G. (2010) Hypertonic stress regulates T cell function via pannexin-1 hemichannels and P2X receptors. J. Leukoc Biol. 88, 1181–1189 [DOI] [PMC free article] [PubMed] [Google Scholar]
- 20. Séror C., Melki M. T., Subra F., Raza S. Q., Bras M., Saïdi H., Nardacci R., Voisin L., Paoletti A., Law F., Martins I., Amendola A., Abdul-Sater A. A., Ciccosanti F., Delelis O., Niedergang F., Thierry S., Said-Sadier N., Lamaze C., Métivier D., Estaquier J., Fimia G. M., Falasca L., Casetti R., Modjtahedi N., Kanellopoulos J., Mouscadet J. F., Ojcius D. M., Piacentini M., Gougeon M. L., Kroemer G., Perfettini J. L. (2011) Extracellular ATP acts on P2Y2 purinergic receptors to facilitate HIV-1 infection. J. Exp. Med. 208, 1823–1834 [DOI] [PMC free article] [PubMed] [Google Scholar]
- 21. Zhang Y., Li H., Wang X., Gao X., Liu X. (2009) Regulation of T cell development and activation by creatine kinase B. PLoS One 4, e5000. [DOI] [PMC free article] [PubMed] [Google Scholar]
- 22. Choi O., Heathcote D. A., Ho K. K, Müller P. J., Ghani H., Lam E. W., Ashton-Rickardt P. G., Rutschmann S. (2012) A deficiency in nucleoside salvage impairs murine lymphocyte development, homeostasis, and survival. J. Immunol. 188, 3920–3927 [DOI] [PMC free article] [PubMed] [Google Scholar]
- 23. Monks C. R., Freiberg B. A., Kupfer H., Sciaky N., Kupfer A. (1998) Three-dimensional segregation of supramolecular activation clusters in T cells. Nature 395, 82–86 [DOI] [PubMed] [Google Scholar]
- 24. Baixauli F., Martín-Cófreces N. B., Morlino G., Carrasco Y. R., Calabia-Linares C., Veiga E., Serrador J. M., Sánchez-Madrid F. (2011) The mitochondrial fission factor dynamin-related protein 1 modulates T-cell receptor signalling at the immune synapse. EMBO J. 30, 1238–1250 [DOI] [PMC free article] [PubMed] [Google Scholar]
- 25. Campi G., Varma R., Dustin M. L. (2005) Actin and agonist MHC-peptide complex-dependent T cell receptor microclusters as scaffolds for signaling. J. Exp. Med. 202, 1031–1036 [DOI] [PMC free article] [PubMed] [Google Scholar]
- 26. Kann O., Kovács R. (2007) Mitochodria and neuronal activity. Am. J. Physiol. Cell Physiol 292, C641–C657 [DOI] [PubMed] [Google Scholar]
- 27. McCormack J. G., Halestrap A. P., Denton R. M. (1990) Role of calcium ions in regulation of mammalian intramitochondrial metabolism. Physiol. Rev. 70, 391–425 [DOI] [PubMed] [Google Scholar]
- 28. Gunter T. E., Yule D. I., Gunter K. K., Eliseev R. A., Salter J. D. (2004) Calcium and mitochondria. FEBS Lett. 567, 96–102 [DOI] [PubMed] [Google Scholar]
- 29. Glancy B., Balaban R. S. (2012) Role of mitochondrial Ca2+ in the regulation of cellular energetic. Biochemistry 51, 2959–2973 [DOI] [PMC free article] [PubMed] [Google Scholar]
- 30. Ojida A., Takashima I., Kohira T., Nonaka H., Hamachi I. (2008) Turn-on fluorescence sensing of nucleoside polyphosphates using a xanthene-based Zn(II) complex chemosensor. J. Am. Chem. Soc. 130, 12095–12101 [DOI] [PubMed] [Google Scholar]
- 31. Lewis R. S. (2001) Calcium signaling mechanisms in T lymphocytes. Annu. Rev. Immunol. 19, 497–521 [DOI] [PubMed] [Google Scholar]
- 32. Jones R. G., Thompson C. B. (2007) Revving the engine: signal transduction fuels T cell activation. Immunity 72, 173–178 [DOI] [PubMed] [Google Scholar]
- 33. Krauss S., Brand M. D., Buttgereit F. (2001) Signaling takes a breath – new quantitative perspectives on bioenergetics and signal transduction. Immunity 15, 497–502 [DOI] [PubMed] [Google Scholar]
- 34. Sena L. A., Chandel N. S. (2012) Physiological roles of mitochondrial reactive oxygen species. Mol. Cell 48, 158–167 [DOI] [PMC free article] [PubMed] [Google Scholar]
- 35. Dehkordy S. F., Aghamohammadi A., Ochs H. D., Rezaei N. (2012) Primary immunodeficiency diseases associated with neurologic manifestations. J. Clin. Immunol. 32, 1–24 [DOI] [PubMed] [Google Scholar]
- 36. Nyhan W. (2005) Disorders of purine and pyrimidine metabolism. Mol. Genet. Metab. 86, 25–33 [DOI] [PubMed] [Google Scholar]
- 37. Markert M. L. (1991) Purine nucleoside phosphorylase deficiency. Immunodefic Rev. 3, 45–81 [PubMed] [Google Scholar]
- 38. Schwindling C., Quintana A., Krause E., Hoth M. (2010) Mitochondria positioning controls local calcium influx in T cells. J. Immunol. 184, 184–190 [DOI] [PubMed] [Google Scholar]
- 39. Devadas S., Zaritskaya L., Rhee S. G., Oberley L., Williams M. S. (2002) Discrete generation of superoxide and hydrogen peroxide by T cell receptor stimulation: selective regulation of mitogen-activated protein kinase activation and fas ligand expression. J. Exp. Med. 195, 59–70 [DOI] [PMC free article] [PubMed] [Google Scholar]
- 40. Kaminski M. M., Sauer S. W., Klemke C. D., Süss D., Okun J. G., Krammer P. H., Gülow K. (2010) Mitochondrial reactive oxygen species control T cell activation by regulating IL-2 and IL-4 expression: mechanism of ciprofloxacin-mediated immunosuppression. J. Immunol. 184, 4827–4841 [DOI] [PubMed] [Google Scholar]
- 41. Kamiński M. M., Röth D., Sass S., Sauer S. W., Krammer P. H., Gülow K. (2012) Manganese superoxide dismutase: a regulator of T cell activation induced oxidative signaling and cell death. Biochim. Biophys. Acta 1823, 1041–1052 [DOI] [PubMed] [Google Scholar]
- 42. Van der Merwe P. A., Davis S. J. (2003) Molecular interactions mediating T cell antigen recognition. Annu. Rev. Immunol. 21, 659–684 [DOI] [PubMed] [Google Scholar]
- 43. Tokunaga A., Tsukimoto M., Harada H., Moriyama Y., Kojima S. (2010) Involvement of SLC-17A9-dependent vesicular exocytosis in the mechanism of ATP release during T cell activation. J. Biol. Chem. 285, 17406–17416 [DOI] [PMC free article] [PubMed] [Google Scholar]
- 44. Wherry E. J. (2011) T cell exhaustion. Nat. Immunol. 12, 492–499 [DOI] [PubMed] [Google Scholar]
- 45. Faist E., Schinkel C., Zimmer S., Kremer J. P., Von Donnersmarck G. H., Schildberg F. W. (1993) Inadequate interleukin-2 synthesis and interleukin-2 messenger expression following thermal and mechanical trauma in humans is caused by defective transmembrane signalling. J. Trauma 34, 846–853 [DOI] [PubMed] [Google Scholar]
- 46. Chaudry I. H., Bland K. I. (2009) Cellular mechanisms of injury after major trauma. Br. J. Surg 96, 1097–1098 [DOI] [PMC free article] [PubMed] [Google Scholar]
- 47. Hoyt D. B., Junger W. G., Loomis W. H., Liu F. C. (1994) Effects of trauma on immune cell function: impairment of intracellular calcium signaling. Shock 2, 23–28 [DOI] [PubMed] [Google Scholar]
- 48. Belikova I., Lukaszewicz A. C., Faivre V., Damoisel C., Singer M., Payen D. (2007) Oxygen consumption of human peripheral blood mononuclear cells in severe human sepsis. Crit. Care Med. 35, 2702–2708 [DOI] [PubMed] [Google Scholar]
- 49. Japiassú A. M., Santiago A. P., d'Avila J. C., Garcia-Souza L., Galina A., Castro Faria-Neto H. C., Bozza F. A., Oliveira M. F. (2011) Bioenergetic failure of human peripheral blood monocytes in septic shock patients is mediated by reduced F1F0 ATP synthase activity. Crit. Care Med. 39, 1056–1063 [DOI] [PubMed] [Google Scholar]
- 50. Chida J., Ono R., Yamane K., Hiyoshi M., Nishimura M., Onodera M., Nakataki E., Shichijo K., Matushita M., Kido H. (2013) Blood lactate/ATP ratio, as an alarm index and real-time biomarker in critical illness. PloS One 8, e60561. [DOI] [PMC free article] [PubMed] [Google Scholar]
- 51. Gray M. W., Burger G., Lang B. F. (1999) Mitochondrial evolution. Science 283, 1476–1481 [DOI] [PubMed] [Google Scholar]
Associated Data
This section collects any data citations, data availability statements, or supplementary materials included in this article.