

Abstract
Objective:
To examine the relationship between sleep quality and cortical and hippocampal volume and atrophy within a community-based sample, explore the influence of age on results, and assess the possible confounding effects of physical activity levels, body mass index (BMI), and blood pressure.
Methods:
In 147 community-dwelling adults (92 female; age 53.9 ± 15.5 years), sleep quality was measured using the Pittsburgh Sleep Quality Index and correlated with cross-sectional measures of volume and longitudinal measures of atrophy derived from MRI scans separated by an average of 3.5 years. Exploratory post hoc analysis compared correlations between different age groups and included physical activity, BMI, and blood pressure as additional covariates.
Results:
Poor sleep quality was associated with reduced volume within the right superior frontal cortex in cross-sectional analyses, and an increased rate of atrophy within widespread frontal, temporal, and parietal regions in longitudinal analyses. Results were largely driven by correlations within adults over the age of 60, and could not be explained by variation in physical activity, BMI, or blood pressure. Sleep quality was not associated with hippocampal volume or atrophy.
Conclusions:
We found that longitudinal measures of cortical atrophy were widely correlated with sleep quality. Poor sleep quality may be a cause or a consequence of brain atrophy, and future studies examining the effect of interventions that improve sleep quality on rates of atrophy may hold key insights into the direction of this relationship.
Poor sleep quality, characterized by difficulties in initiating or maintaining sleep or nonrestorative sleep, has been linked to cognitive deficits1,2 and increased risk of Alzheimer disease and cognitive decline3 within community-based samples. MRI is an ideal tool to address whether variations in brain structure underlie these relationships, and MRI studies have linked primary insomnia with reduced volume of the orbitofrontal cortex (OFC),4,5 hippocampus,6,7 and precuneus,4 and increased volume of the rostral anterior cingulate.5 Although few studies have explored the relationship between sleep and brain structure in healthy individuals, cross-sectional correlations have been reported between the volume of the OFC and early-morning awakening8 and daytime sleepiness.9 Furthermore, reduction in non-REM (NREM) slow wave activity (SWA) in older adults has been associated with age-related decreases in gray matter density within the medial prefrontal cortex (mPFC).10 To our knowledge, no studies have assessed the relationship between sleep quality and longitudinal change in brain structure.
We investigated the relationship between sleep quality and cross-sectional measurements of cortical and hippocampal volume as well as longitudinal measures of atrophy in community-dwelling adults. We expected that poor sleep quality would be associated with reduced volume and increased atrophy within the OFC and mPFC. Furthermore, we hypothesized that correlations may extend to wider areas of the frontal, temporal, and parietal cortices, reflecting the multifactorial cognitive deficits that coexist with poor sleep. In post hoc analyses, we compared correlations between different age groups, explored possible confounding effects, and assessed sleep duration, efficiency, and latency.
METHODS
Participants.
The sample was drawn from the ongoing project Cognition and Plasticity through the Lifespan at the Research Group for Lifespan Changes in Brain and Cognition, Department of Psychology, University of Oslo, Norway.11,12 Baseline MRI was administered between 2006 and 2009, follow-up MRI between 2011 and 2012, and sleep quality assessment between 2012 and 2013.
For the first wave of data collection, participants were recruited through newspaper advertisements. Recruitment for the follow-up assessments was by written invitation to the original participants. At timepoint 1 (T1) and timepoint 2 (T2), participants were screened with health interviews to ascertain eligibility, outlined in appendix e-1 on the Neurology® Web site at Neurology.org.
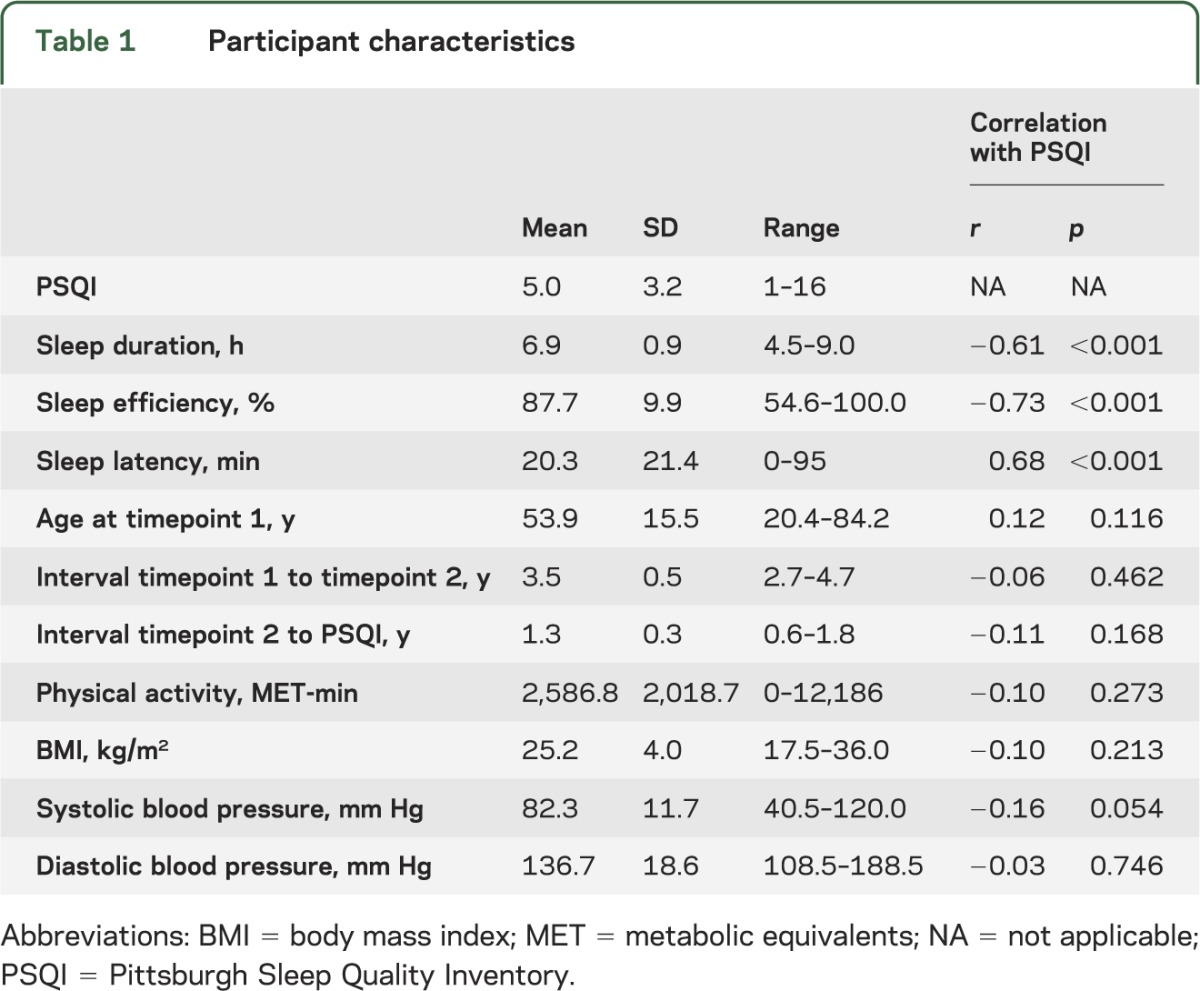
A total of 147 participants (92 female, 55 male) were included in this study. Attrition of participants is provided in figure e-1 and full participant characteristics in table 1.
Table 1.
Participant characteristics
Standard protocol approvals, registrations, and patient consents.
All procedures were approved by the Regional Ethical Committee of Southern Norway (REK-Sør), and written consent was obtained from all participants prior to commencement.
MRI acquisition and processing.
Full details of the MRI acquisition and processing are provided in appendix e-1. Briefly, imaging data were collected at T1 and T2 using a 12-channel head coil on a 1.5T Siemens Avanto scanner (Siemens Medical Solutions, Erlangen, Germany) at Rikshospitalet, Oslo University Hospital. The same scanner and sequences were used at both timepoints, though with minor software updates. Images were first automatically processed cross-sectionally (independently) for each time point with FreeSurfer (version 5.1.0),13–15 then subsequently run through the longitudinal processing stream.16
Sleep quality assessment.
Sleep quality was assessed using the Pittsburgh Sleep Quality Inventory (PSQI17) in Norwegian after T2. PSQI is a self-rated questionnaire that assesses 7 domains of sleep quality (duration, subjective sleep quality, latency, habitual sleep efficiency, sleep disturbances, use of sleeping medication, and daytime dysfunction) over a 1-month time interval. The minimum score is 0 and maximum score 21. Using answers to individual questions within the PSQI, we also derived measures of sleep latency (minutes taken to fall asleep at night), sleep duration (hours spent asleep at night), and sleep efficiency (the percentage of time in bed at night spent asleep).
Physical activity, body mass index, and blood pressure assessment.
Physical activity, body mass index (BMI), and blood pressure were assessed at T2. Physical activity level was measured using the International Physical Activity Questionnaire18 self-administered short version in Norwegian. Participants detail the duration (in minutes) and frequency (days) of walking and moderate intensity and vigorous intensity activities over the past 7 days. The volume of activity is computed by weighting each type of activity by its energy requirements, defined in metabolic equivalents (MET) (multiples of the resting metabolic rate), to yield a score in MET-min. Participants' height and weight were measured, and BMI was calculated as weight (kg)/height × height (m). Blood pressure was measured with an A&D (Sydney, Australia) UA-767+ 30 digital upper arm blood pressure monitor while participants were seated, before and after the neuropsychological testing, and the average of the 2 measurements was used for the analyses.
Statistical analyses.
For cross-sectional cortical analysis, a general linear model (GLM) was run using FreeSurfer with volume at each vertex across the brain surface at T2 as the dependent variable and PSQI score as the independent variable. Sex, age at T2, intracranial volume (ICV), interval between T2 and acquisition of PSQI data, and the interactions between sex and each continuous variable were included as covariates.
For longitudinal cortical analyses, symmetrized proportion change in volume was computed at each vertex by subtracting T2 volume from T1 volume, and dividing by the mean T1 and T2 volume at that vertex. A GLM was run using FreeSurfer with change in volume at each vertex as the dependent variable and PSQI score as the independent variable. Sex, age at T2, interval between T1 and T2, interval between T2 and acquisition of PSQI data, and the interactions between sex and each continuous variable were included as covariates.
Both cross-sectional and longitudinal cortical results were tested against an empirical null distribution of maximum cluster size across 10,000 iterations using Z Monte Carlo simulations19,20 synthesized with a cluster-forming threshold of p < 0.05 (2-sided), yielding clusters corrected for multiple comparisons across the surface.
For cross-sectional hippocampal analysis, partial correlations were run using IBM (Armonk, NY) SPPS Statistics v21 between hippocampal volume and PSQI, with sex, age at T2, ICV, and interval between T2 and acquisition of PSQI data as covariates. For longitudinal hippocampal analyses, partial correlations were run between proportion change in volume and PSQI, with sex, age at T2, interval between T1 and T2, and interval between T2 and acquisition of PSQI data as covariates.
Post hoc analyses.
Mean cortical volume (cross-sectional analyses) or proportion change in cortical volume (longitudinal analyses) was extracted within significant clusters in order to perform post hoc analyses using SPSS.
First, we tested the influence of outliers by excluding participants with mean cortical measures more than 3 SDs from the mean.
Second, to assess whether relationships differed between younger and older participants, we divided our sample according to age at T2 (<60 years, ≥60 years, a threshold often referred to in the sleep literature21). We performed partial correlations with PSQI within these groups, with sex, age at T2, ICV, and interval between T2 and acquisition of PSQI data as covariates in cross-sectional analyses, and sex, age at T2, interval between T1 and T2, and interval between T2 and acquisition of PSQI data as covariates in longitudinal analyses. We then used a Fisher r-to-z transformation to determine if the correlation coefficient was significantly different between groups.
Third, we explored the possible confounding effects of physical activity, BMI, and blood pressure by including these factors as additional covariates. Due to missing data, this analysis was performed in subsamples of 120 (physical activity), 144 (BMI), and 146 (blood pressure) participants.
Finally, we performed correlations with sleep duration, sleep efficiency, and sleep latency to determine which aspects of sleep were most strongly related with our results.
RESULTS
Correlations between variables.
An independent samples t test showed that PSQI was not significantly different in female and male participants (male: 4.4 ± 2.9, female: 5.3 ± 3.3, t = −1.67, p = 0.097). PSQI was not associated with interval between assessments, physical activity, BMI, or blood pressure (table 1). Older age was associated with reduced sleep efficiency (r = −0.23, p = 0.005), but not total PSQI score (r = 0.12, p = 0.166), sleep duration (r = −0.08, p = 0.343), or sleep latency (r = 0.02, p = 0.844).
Cross-sectional analyses.
Poor sleep quality was associated with smaller volume in a single cluster located within the right superior frontal cortex (cluster size 1,931 mm2, cluster-wise p = 0.0095; figure 1). Hippocampal volume was not associated with sleep quality (left: r = 0.050, p = 0.554; right: r = 0.024, p = 0.780).
Figure 1. Correlations between sleep quality and cross-sectional estimates of cortical volume.

(A) Spatial maps display regions where poor sleep quality was significantly associated with reduced cortical volume (p < 0.05, after correction for multiple comparisons across the surface). Age, sex, interval between MRI and Pittsburgh Sleep Quality Inventory (PSQI) acquisition, and intracranial volume were included as covariates. (B) Scatterplot of the correlation between sleep quality and cortical volume within the significant cluster (expressed as a z score).
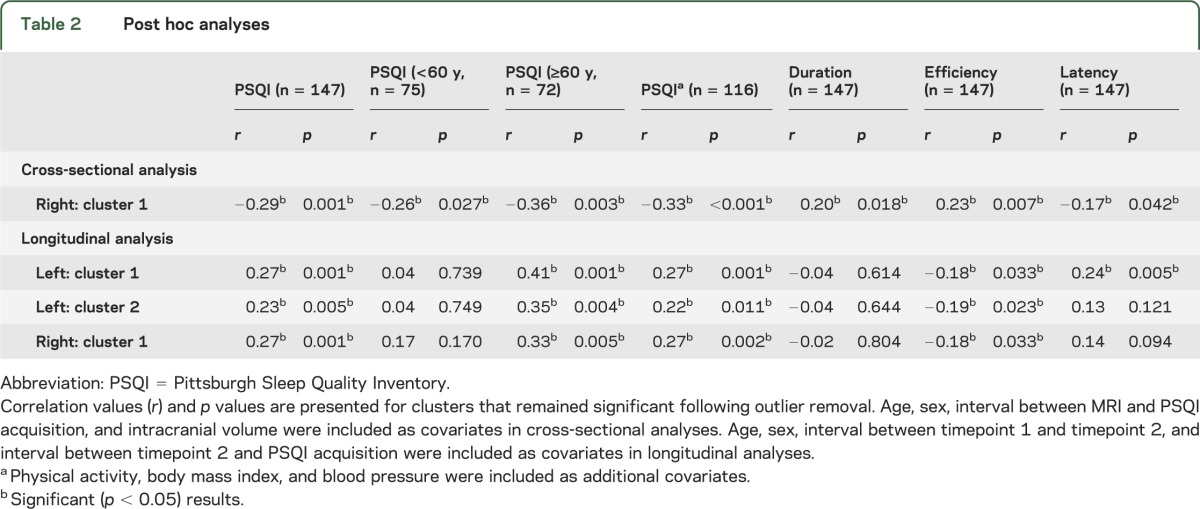
Mean cortical volume was extracted within the significant cluster in order to perform post hoc analyses (table 2). The cluster remained significant in analyses that excluded outliers. Significant correlations were observed in both the under 60s and the over 60s, and the correlation coefficient was not significantly different between groups (p = 0.542). Results were unchanged when physical activity, BMI, and blood pressure were included as additional covariates. Smaller volume within this cluster was significantly associated with shorter sleep duration, lower sleep efficiency, and increased sleep latency.
Table 2.
Post hoc analyses
Longitudinal analyses.
Vertex-wise analyses showed that poor sleep quality was associated with a greater rate of decline in volume (atrophy) within 3 clusters in the left hemisphere and 2 clusters in the right hemisphere (figure 2).
Figure 2. Spatial maps of correlations between sleep quality and longitudinal estimates of change in cortical volume.

Spatial maps display regions where poor sleep quality was significantly associated with increased rate of cortical atrophy (p < 0.05, after correction for multiple comparisons across the surface). Age, sex, interval between T1 and T2, and interval between T2 and Pittsburgh Sleep Quality Inventory acquisition were included as covariates.
Within the left hemisphere, the largest cluster encompassed lateral frontal, temporal, and parietal regions (cluster size 16,539 mm2, cluster-wise p = 0.0001, figure 2). A second cluster spanned the medial superior frontal cortex and caudal and rostral cingulate (2,793 mm2, p = 0.0024) and a third cluster was located within the left precuneus and isthmus cingulate (retrosplenial cortex) (1,868 mm2, p = 0.0384).
Within the right hemisphere, the largest cluster included much of the lateral and medial frontal cortex, extending to the rostral anterior cingulate (11,562 mm2, p = 0.0001), with a second cluster located within the temporal cortex (2,933 mm2, p = 0.0028).
Change in hippocampal volume was not associated with sleep quality (left: r = −0.105, p = 0.211; right: r = 0.102, p = 0.224).
Mean proportion change in cortical volume was extracted from within significant clusters in order to perform post hoc analyses. The third cluster within the left hemisphere and second cluster within the right hemisphere did not remain significant following outlier removal and no further post hoc tests were performed on these clusters.
First, we divided our sample according to age at T2. A significant relationship between mean proportion change in cortical volume and PSQI was observed within the over 60s in all clusters, but no significant relationships were observed within the under 60s (table 2, figure 3). Within the left hemisphere, the correlation coefficient was significantly different between groups in the first cluster (p = 0.021) and approached significance in the second cluster (p = 0.055). Within the right hemisphere, the correlation coefficient was not significantly different between groups (p = 0.285).
Figure 3. Scatterplots of the correlations between sleep quality and longitudinal estimates of change in cortical volume.

Participants younger than 60 years at timepoint 2 are displayed in red; participants older than 60 at timepoint 2 are displayed in blue. PSQI = Pittsburgh Sleep Quality Inventory.
All of the clusters remained significant in analyses that included physical activity, BMI, and blood pressure as additional covariates (table 2).
Mean proportion change in cortical volume was significantly associated with sleep efficiency in all 3 clusters and with sleep latency in 1 cluster. No significant associations were observed with sleep duration (table 2).
DISCUSSION
Poor sleep quality was associated with reduced volume within the superior frontal cortex and a greater rate of atrophy across the frontal, temporal, and parietal cortices. Results were driven by correlations within older adults, could not be explained by variation in physical activity levels, BMI, or blood pressure, and were most closely linked to reduced sleep efficiency.
The MRI sleep literature to date has most frequently reported associations between sleep quality and the OFC and wider mPFC, with smaller volume linked with a diagnosis of primary insomnia,4,5 greater severity of insomnia symptoms,4 daytime sleepiness,9 early-morning awakening,8 and reduced “sleep credit” (i.e., the difference between habitual sleep and subjectively reported minimum hours of sleep needed)22 and NREM SWA.10 Although our cross-sectional analyses did not find relationships between sleep quality and mPFC volume, longitudinal analyses detected significant correlations between sleep quality and atrophy within the OFC and mPFC.
Poor sleep quality was also associated with increased atrophy within widespread frontal, parietal, and temporal regions. A parallel can be drawn between the anatomy of our findings and regions in which structural characteristics have been linked to aspects of cognitive performance, for example, cortical correlates of executive control12 and visuospatial reasoning abilities23 across the lifespan. The extent to which variation in brain structure can explain cognitive deficits associated with poor sleep quality is a key area for future studies.
Variation in cortical measures is associated with different underlying neural mechanisms across the lifespan.11,24 As post hoc analyses comparing the PSQI–atrophy relationships in different age groups indicated that results were driven by correlations within older adults, it follows that processes that accumulate in later life may mediate the observed relationship between sleep quality and atrophy. For example, these processes could include shrinkage of large neurons, loss of myelinated axonal fibers, deafferentation, and reduction in synaptic density.25
We did not detect any significant relationships between sleep quality and hippocampal volume or atrophy. While animal studies have indicated that prolonged restriction or disruption of sleep may lead to reduced cell proliferation, cell survival, and neurogenesis within the hippocampus,26 results of studies of primary insomnia have been mixed.6,7,27,28 Higher PSQI scores have been associated with reduced CA1 volume within primary insomnia,6 and it is possible that analysis of the volume and atrophy of hippocampal subfields may provide more sensitive measures in relation to sleep quality in nonclinical populations.
A key issue, which our study was not designed to explore directly, is the degree to which poor sleep quality is a cause or a consequence of brain atrophy. Sleep has been proposed to be “the brain's housekeeper,” serving to restore and repair the brain, and has recently been shown to be associated with both enhanced removal of potentially neurotoxic waste products29 and an increased expression of genes related to myelin synthesis and maintenance.30 It follows that poor sleep may have a direct impact upon brain structure.
Alternatively, atrophy has also been postulated to be a cause of poor sleep quality. For example, age-related reductions in the gray matter density of the mPFC have been found to be associated with reduced NREM SWA in older adults, with data supporting a model in which atrophy mediates sleep disruption.10 Interestingly, although questionnaire-based measures of sleep quality do not necessarily reflect polysomnographic measures, our longitudinal results overlap not only with the mPFC, but also with other elements of the default mode network that are implicated in the functional anatomy of SWA.31
It is also possible that the relationship between sleep quality and brain atrophy could be mediated by a third factor that influences both variables. Physical activity levels, BMI, and blood pressure have all been associated with both sleep quality32,33 and reduced gray matter volume and atrohpy.34–36 However, within our sample, sleep quality was not significantly associated with physical activity levels, BMI, or blood pressure, perhaps because of the smaller sample size of this study compared with epidemiologic studies, and including these measures as additional covariates did not alter our results. Similarly, including Full-Scale IQ and Mini-Mental State Examination as covariates did not affect our results (table e-1).
Sleep problems are also frequently reported in psychiatric and neurodegenerative disease, and a complex relationship between their neuropathology and sleep disruption is posited.37 Participants included in analyses had passed a thorough screening procedure including health interview, cognitive assessments, and radiologic evaluation, thus ensuring current psychiatric or neurologic diagnoses did not confound results. However, subclinical or preclinical conditions may still have influenced our findings and, notably, our study lacked a consideration of the possible role of depressive symptoms or anxiety.
Ultimately, further insights into the nature of the relationship between poor sleep and brain atrophy are dependent upon future studies directly assessing whether interventions targeted at improving sleep quality affect atrophy rates. If sleep interventions were found to help slow or reverse atrophy, this would emphasize the importance of public health messages promoting good sleep hygiene.
Sleep quality was assessed using the PSQI an average of 1.3 years following the second neuroimaging assessment. Although sleep quality measures have been shown to be relatively stable over time within community-based samples,38 the interval between follow-up MRI scan and sleep quality assessment may have added noise to our analyses. Within our sample, 35% of participants met PSQI criteria for “poor sleep” and the average PSQI among these participants was 8.5. Such characteristics are comparable to other community-based samples,1 but lower than clinical samples. Also, although PSQI displays good internal consistency and close correlation with sleep diaries, it is not necessarily reflective of objective measures of sleep quality,39 and our study would have been improved by additional collection of actigraphy or home polysomnography.
PSQI reflects a range of sleep quality variables. In post hoc analyses that assessed sleep efficiency, latency, and duration, correlations with brain structural measures were strongest and most consistent for sleep efficiency, which quantifies time asleep relative to total time in bed. Such findings are in agreement with a study of the cognitive correlates of sleep quality in older community-based adults1 and in line with cognitive behavioral therapy for insomnia, which aims to improve sleep efficiency and reduce symptoms of insomnia partly by controlling time in bed.
Finally, poor sleep quality can be symptomatic of a number of diverse etiologies, which may have distinct neurobiological correlates. A limitation of our study was that it did not include an investigation of the underlying cause of high PSQI scores.
In the first longitudinal MRI study of sleep quality in community-dwelling adults, we found that cortical atrophy was correlated with sleep quality, and that the relationship increased with age. The effect of interventions that improve sleep quality on rates of atrophy is a key area for future research and may have important implications for public health messages.
Supplementary Material
GLOSSARY
- BMI
body mass index
- GLM
general linear model
- ICV
intracranial volume
- MET
metabolic equivalents
- mPFC
medial prefrontal cortex
- OFC
orbitofrontal cortex
- NREM
non-REM
- PSQI
Pittsburgh Sleep Quality Inventory
- SWA
slow wave activity
Footnotes
Supplemental data at Neurology.org
AUTHOR CONTRIBUTIONS
C.E.S.: analyzed and interpreted data, drafted manuscript. A.B.S.: analyzed data, revised manuscript. K.B.W.: designed study, interpreted data, revised manuscript. H.J.-B.: designed study, revised manuscript. A.M.F. designed study, interpreted data, revised manuscript.
STUDY FUNDING
C.E.S. is supported by the Yggdrasil Mobility Programme, Research Council of Norway. C.E.S. and H.J.-B. are supported by the National Institute for Health Research (NIHR) Oxford Biomedical Research Centre based at Oxford University Hospitals NHS Trust and University of Oxford. H.J.-B. is supported by the Wellcome Trust. K.B.W. and A.M.F. are supported by the Norwegian Research Council and the European Research Council's Starting Grant scheme. A.B.S., K.B.W., and A.M.F. are also supported by the Department of Psychology, University of Oslo.
DISCLOSURE
The authors report no disclosures relevant to the manuscript. Go to Neurology.org for full disclosures.
REFERENCES
- 1.Nebes RD, Buysse DJ, Halligan EM, Houck PR, Monk TH. Self-reported sleep quality predicts poor cognitive performance in healthy older adults. J Gerontol B Psychol Sci Soc Sci 2009;64:180–187 [DOI] [PMC free article] [PubMed] [Google Scholar]
- 2.Benitez A, Gunstad J. Poor sleep quality diminishes cognitive functioning independent of depression and anxiety in healthy young adults. Clin Neuropsychol 2012;26:214–223 [DOI] [PubMed] [Google Scholar]
- 3.Lim ASP, Kowgier M, Yu L, Buchman AS, Bennett DA. Sleep fragmentation and the risk of incident Alzheimer's disease and cognitive decline in older persons. Sleep 2013;36:1027–1032 [DOI] [PMC free article] [PubMed] [Google Scholar]
- 4.Altena E, Vrenken H, Van Der Werf YD, van den Heuvel OA, Van Someren EJW. Reduced orbitofrontal and parietal gray matter in chronic insomnia: a voxel-based morphometric study. Biol Psychiatry 2010;67:182–185 [DOI] [PubMed] [Google Scholar]
- 5.Winkelman JW, Plante DT, Schoerning L, et al. Increased rostral anterior cingulate cortex volume in chronic primary insomnia. Sleep 2013;36:991–998 [DOI] [PMC free article] [PubMed] [Google Scholar]
- 6.Joo EY, Kim H, Suh S, Hong SB. Hippocampal substructural vulnerability to sleep disturbance and cognitive impairment in patients with chronic primary insomnia: MRI morphometry. Sleep (In press 2014). [DOI] [PMC free article] [PubMed]
- 7.Riemann D, Voderholzer U, Spiegelhalder K, et al. Chronic insomnia and MRI-measured hippocampal volumes: a pilot study. Sleep 2007;30:955–958 [DOI] [PMC free article] [PubMed] [Google Scholar]
- 8.Stoffers D, Moens S, Benjamins J, et al. Orbitofrontal gray matter relates to early morning awakening: a neural correlate of insomnia complaints? Front Neurol 2012;3:105. [DOI] [PMC free article] [PubMed] [Google Scholar]
- 9.Killgore WD, Schwab ZJ, Kipman M, DelDonno SR, Weber M. Voxel-based morphometric gray matter correlates of daytime sleepiness. Neurosci Lett 2012;518:10–13 [DOI] [PubMed] [Google Scholar]
- 10.Mander BA, Rao V, Lu B, et al. Prefrontal atrophy, disrupted NREM slow waves and impaired hippocampal-dependent memory in aging. Nat Neurosci 2013;16:357–364 [DOI] [PMC free article] [PubMed] [Google Scholar]
- 11.Westlye LT, Walhovd KB, Dale AM, et al. Differentiating maturational and aging-related changes of the cerebral cortex by use of thickness and signal intensity. Neuroimage 2010;52:172–185 [DOI] [PubMed] [Google Scholar]
- 12.Westlye LT, Grydeland H, Walhovd KB, Fjell AM. Associations between regional cortical thickness and attentional networks as measured by the attention network test. Cereb Cortex 2011;21:345–356 [DOI] [PubMed] [Google Scholar]
- 13.Dale AM, Fischl B, Sereno MI. Cortical surface-based analysis: I: segmentation and surface reconstruction. Neuroimage 1999;9:179–194 [DOI] [PubMed] [Google Scholar]
- 14.Fischl B, Sereno MI, Dale AM. Cortical surface-based analysis: II: inflation, flattening, and a surface-based coordinate system. Neuroimage 1999;9:195–207 [DOI] [PubMed] [Google Scholar]
- 15.Fischl B, Dale AM. Measuring the thickness of the human cerebral cortex from magnetic resonance images. Proc Natl Acad Sci USA 2000;97:11050–11055 [DOI] [PMC free article] [PubMed] [Google Scholar]
- 16.Reuter M, Schmansky NJ, Rosas HD, Fischl B. Within-subject template estimation for unbiased longitudinal image analysis. Neuroimage 2012;61:1402–1418 [DOI] [PMC free article] [PubMed] [Google Scholar]
- 17.Buysse DJ, Reynolds CF, Monk TH, Berman SR, Kupfer DJ. The Pittsburgh Sleep Quality Index: a new instrument for psychiatric practice and research. Psychiatry Res 1989;28:193–213 [DOI] [PubMed] [Google Scholar]
- 18.Hagströmer M, Oja P, Sjöström M. The International Physical Activity Questionnaire (IPAQ): a study of concurrent and construct validity. Public Health Nutr 2006;9:755–762 [DOI] [PubMed] [Google Scholar]
- 19.Hayasaka S, Nichols TE. Validating cluster size inference: random field and permutation methods. Neuroimage 2003;20:2343–2356 [DOI] [PubMed] [Google Scholar]
- 20.Hagler DJ, Saygin AP, Sereno MI. Smoothing and cluster thresholding for cortical surface-based group analysis of fMRI data. Neuroimage 2006;33:1093–1103 [DOI] [PMC free article] [PubMed] [Google Scholar]
- 21.Ohayon MM, Carskadon MA, Guilleminault C, Vitiello MV. Meta-analysis of quantitative sleep parameters from childhood to old age in healthy individuals: developing normative sleep values across the human lifespan. Sleep 2004;27:1255–1273 [DOI] [PubMed] [Google Scholar]
- 22.Weber M, Webb CA, Deldonno SR, et al. Habitual “sleep credit” is associated with greater grey matter volume of the medial prefrontal cortex, higher emotional intelligence and better mental health. J Sleep Res 2013;22:527–534 [DOI] [PubMed] [Google Scholar]
- 23.Fjell AM, Westlye LT, Amlien I, et al. High-expanding cortical regions in human development and evolution are related to higher Intellectual abilities. Cereb Cortex (Epub 2013 Aug 19). [DOI] [PubMed]
- 24.Sowell ER, Peterson BS, Thompson PM, Welcome SE, Henkenius AL, Toga AW. Mapping cortical change across the human life span. Nat Neurosci 2003;6:309–315 [DOI] [PubMed] [Google Scholar]
- 25.Pakkenberg B, Pelvig D, Marner L, et al. Aging and the human neocortex. Exp Gerontol 2003;38:95–99 [DOI] [PubMed] [Google Scholar]
- 26.Meerlo P, Mistlberger RE, Jacobs BL, Heller HC, McGinty D. New neurons in the adult brain: the role of sleep and consequences of sleep loss. Sleep Med Rev 2009;13:187–194 [DOI] [PMC free article] [PubMed] [Google Scholar]
- 27.Winkelman JW, Benson KL, Buxton OM, et al. Lack of hippocampal volume differences in primary insomnia and good sleeper controls: an MRI volumetric study at 3 Tesla. Sleep Med 2010;11:576–582 [DOI] [PubMed] [Google Scholar]
- 28.Spiegelhalder K, Regen W, Baglioni C, et al. Insomnia does not appear to be associated with substantial structural brain changes. Sleep 2013;36:731–737 [DOI] [PMC free article] [PubMed] [Google Scholar]
- 29.Xie L, Kang H, Xu Q, et al. Sleep drives metabolite clearance from the adult brain. Science 2013;342:373–377 [DOI] [PMC free article] [PubMed] [Google Scholar]
- 30.Bellesi M, Pfister-Genskow M, Maret S, Keles S, Tononi G, Cirelli C. Effects of sleep and wake on oligodendrocytes and their precursors. J Neurosci 2013;33:14288–14300 [DOI] [PMC free article] [PubMed] [Google Scholar]
- 31.Murphy M, Riedner BA, Huber R, Massimini M, Ferrarelli F, Tononi G. Source modeling sleep slow waves. Proc Natl Acad Sci USA 2009;106:1608–1613 [DOI] [PMC free article] [PubMed] [Google Scholar]
- 32.Hargens TA, Kaleth AS, Edwards ES, Butner KL. Association between sleep disorders, obesity, and exercise: a review. Nat Sci Sleep 2013;5:27–35 [DOI] [PMC free article] [PubMed] [Google Scholar]
- 33.Palagini L, Bruno RM, Gemignani A, Baglioni C, Ghiadoni L, Riemann D. Sleep loss and hypertension: a systematic review. Curr Pharm Des 2013;19:2409–2419 [DOI] [PubMed] [Google Scholar]
- 34.Voss MW, Nagamatsu LS, Liu-Ambrose T, Kramer AF. Exercise, brain, and cognition across the life span. J Appl Physiol 2011;111:1505–1513 [DOI] [PMC free article] [PubMed] [Google Scholar]
- 35.Carnell S, Gibson C, Benson L, Ochner CN, Geliebter A. Neuroimaging and obesity: current knowledge and future directions. Obes Rev 2012;13:43–56 [DOI] [PMC free article] [PubMed] [Google Scholar]
- 36.Walhovd KB, Storsve AB, Westlye LT, Drevon CA, Fjell AM. Blood markers of fatty acids and vitamin D, cardiovascular measures, body mass index, and physical activity relate to longitudinal cortical thinning in normal aging. Neurobiol Aging 2014;35:1055–1064 [DOI] [PubMed] [Google Scholar]
- 37.Wulff K, Gatti S, Wettstein JG, Foster RG. Sleep and circadian rhythm disruption in psychiatric and neurodegenerative disease. Nat Rev Neurosci 2010;11:589–599 [DOI] [PubMed] [Google Scholar]
- 38.Knutson KL, Rathouz PJ, Yan LL, Liu K, Lauderdale DS. Stability of the Pittsburgh Sleep Quality Index and the Epworth Sleepiness Questionnaires over 1 year in early middle-aged adults: the CARDIA study. Sleep 2006;29:1503–1506 [DOI] [PubMed] [Google Scholar]
- 39.Buysse DJ, Hall ML, Strollo PJ, et al. Relationships between the Pittsburgh Sleep Quality Index (PSQI), Epworth Sleepiness Scale (ESS), and clinical/polysomnographic measures in a community sample. J Clin Sleep Med 2008;4:563–571 [PMC free article] [PubMed] [Google Scholar]
Associated Data
This section collects any data citations, data availability statements, or supplementary materials included in this article.