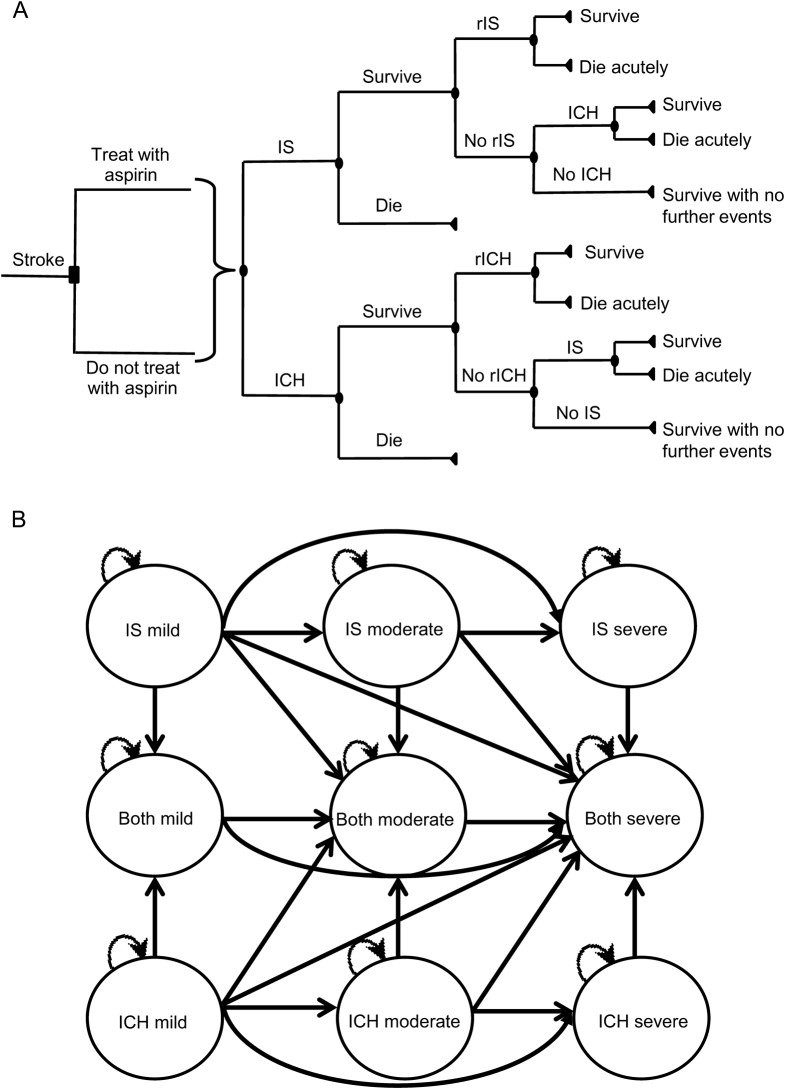
Figure 1. Model structure.
(A) Schematic of decision tree. For clarity, levels of disability are not shown. (B) State diagram showing possible transitions between states. For clarity, the possible transition to death from each of the 9 states is not shown. ICH = intracerebral hemorrhage; IS = ischemic stroke; rICH = recurrent ICH; rIS = recurrent ischemic stroke.

