

Abstract
Autism spectrum disorders (ASD) represent a formidable challenge for psychiatry and neuroscience because of their high prevalence, life-long nature, complexity and substantial heterogeneity. Facing these obstacles requires large-scale multidisciplinary efforts. While the field of genetics has pioneered data sharing for these reasons, neuroimaging had not kept pace. In response, we introduce the Autism Brain Imaging Data Exchange (ABIDE) – a grassroots consortium aggregating and openly sharing 1112 existing resting-state functional magnetic resonance imaging (R-fMRI) datasets with corresponding structural MRI and phenotypic information from 539 individuals with ASD and 573 age-matched typical controls (TC; 7–64 years) (http://fcon_1000.projects.nitrc.org/indi/abide/). Here, we present this resource and demonstrate its suitability for advancing knowledge of ASD neurobiology based on analyses of 360 males with ASD and 403 male age-matched TC. We focused on whole-brain intrinsic functional connectivity and also survey a range of voxel-wise measures of intrinsic functional brain architecture. Whole-brain analyses reconciled seemingly disparate themes of both hypo and hyperconnectivity in the ASD literature; both were detected, though hypoconnectivity dominated, particularly for cortico-cortical and interhemispheric functional connectivity. Exploratory analyses using an array of regional metrics of intrinsic brain function converged on common loci of dysfunction in ASD (mid and posterior insula, posterior cingulate cortex), and highlighted less commonly explored regions such as thalamus. The survey of the ABIDE R-fMRI datasets provides unprecedented demonstrations of both replication and novel discovery. By pooling multiple international datasets, ABIDE is expected to accelerate the pace of discovery setting the stage for the next generation of ASD studies.
Keywords: Resting state fMRI, Intrinsic functional connectivity, Data sharing, Large-scale networks, Default network, Interhemispheric connectivity, Thalamus
INTRODUCTION
Autism spectrum disorders (ASD), formerly considered rare, are now reported to occur in ~1% of children.1, 2 Increased recognition of ASD derives at least partially from the adoption of standardized methods for their evaluation and diagnosis.3, 4 Beyond clinical utility, standardized approaches facilitate comparison and synthesis of findings across research studies. Consistent phenotypic characterizations have also facilitated establishing large open access data repositories to address the genetic bases of ASD.5–8 Open sharing of neuroimaging data has not kept pace, despite substantial potential to inform our understanding of the neurophysiological mechanisms underlying autism.
In response, we introduce the Autism Brain Imaging Data Exchange (ABIDE; http://fcon_1000.projects.nitrc.org/indi/abide/) – a grassroots consortium effort dedicated to aggregating and sharing previously collected resting-state fMRI (R-fMRI) datasets from individuals with ASD and age-matched typical controls (TC). The focus on R-fMRI was motivated by multiple factors. First, ASD neuroimaging studies have increasingly converged on abnormalities in connectivity among brain regions, rather than local functional or structural abnormalities.9–11 Second, R-fMRI approaches are particularly suitable for examining intrinsic functional connectivity (iFC); beyond robust test-retest reliability,12, 13 R-fMRI sidesteps the challenge of designing tasks capable of probing the wide range of intellectual and behavioral capabilities characteristic of ASD.14 Third, as recently demonstrated by the 1000 Functional Connectomes Project15 and recent efforts from the International Neuroimaging Data-sharing Initiative (INDI; e.g., ADHD-200)16–18 R-fMRI datasets from multiple imaging sites can be fruitfully aggregated for discovery and replication.18, 19
In conceptualizing ABIDE, we hypothesized that the ASD community’s adoption of standardized protocols would be reflected in the sample. Specifically, despite lack of prior coordination, we expected comparable phenotyping across sites due to the widespread use of Autism Diagnostic standardized instruments.3, 4 We also anticipated identifying factors that vary across studies, whether by design or unintentionally, to guide future efforts to increase harmonization among research groups.
Another goal was to demonstrate the utility of the aggregated sample for exploring the functional connectome in ASD. Despite overall convergence among R-fMRI studies in supporting a dysconnectivity model of ASD, reports disagree regarding the specific nature and extent of ASD-related abnormalities in iFC (e.g., hypo vs. hyperconnectivity) and the breadth of the systems affected.20, 21 In the present work, we carry out a full-brain examination using parcellation-unit based correlation analyses to determine relative prevalence of ASD-related increases vs. decreases in iFC. Given the focus in the ASD literature on the default network,22–25 we also examined voxel-wise iFC for its key components.26
Finally, we explored regional iFC dysfunction using four voxel-wise R-fMRI measures, regional homogeneity (ReHo),27 voxel-matched homotopic connectivity (VMHC),28, 29 degree centrality (DC),30, 31 and fractional amplitude of low frequency fluctuations (fALFF).32 Neither fALFF, a direct index of the spontaneous signal fluctuations underlying resting-state functional connectivity, nor DC, a graph-based measure of the functional relationships of each voxel within the whole connectome, have been examined previously in ASD. These approaches are suited for discovery science thanks to their relative computational simplicity, lack of requirements for data reduction, or a priori knowledge.
METHODS
Contributions
Initial contributions were sought from members of the ADHD-200 Consortium conducting autism research (Kennedy Krieger Institute, NYU Langone Medical Center, Oregon Health & Science University, University of Pittsburgh). Invitations to participate were extended based on personal communications, recent publications and conference presentations. All investigators willing and able to openly share previously collected awake R-fMRI data from individuals with ASD and age- and sex-group matched TC were included. Institutional Review Board (IRB) approval to participate, or explicit waiver to provide fully anonymized data, was required prior to data contribution.
All contributions were based on studies approved by local IRBs, and data were fully anonymized (removing all 18 HIPAA protected health information identifiers, and face information from structural images). All data distributed were visually inspected prior to release.
Phenotypic Data
Prior to data aggregation, consortium members agreed on a “base” phenotypic protocol by identifying overlaps in measures across sites. These included age at scan, sex, IQ, and diagnostic information. Contributors were encouraged to provide as many additional measures as possible, although such contributions were not required given the voluntary, unfunded nature of this effort.
Quality Assurance
Upon receipt, data were checked for extreme outliers (relative to each site’s group), impossible data entries (e.g., beyond published maxima and minima) and missing values. Phenotypic variable entries (e.g., diagnosis) were recoded as necessary to ensure uniformity across sites. Prior to distribution of quality-controlled data, each site reviewed and verified its accuracy. Missing data were imputed for each sample separately, based upon individuals of the same diagnostic category, if the variable was present across ≥60% of datasets and sufficient data were available (i.e., for ≥75% of participants in each diagnostic group at that site). Categorical variables were imputed using the mode and continuous variables using the mean per diagnostic group, per site. When missing, full IQ (FIQ) was estimated by averaging available performance and verbal IQ scores per diagnostic group, per site.
Surveying Group Characteristics
For continuous variables, we calculated range, mean and SD for each diagnostic group per and across sites. Similarly, for categorical variables (e.g., diagnosis per fourth and text revised edition of the Diagnostic and Statistical Manual of Mental Disorders [DSM-IV-TR]), we computed totals and percentages by diagnostic group.
Imaging Analyses
Sample Selection
Imaging analyses were limited to: 1) males, as they represented 90% of the aggregate sample, 2) sites with IQ estimated for >75% per diagnostic group, 3) individuals with FIQ within two SD of the overall ABIDE sample mean (108±15), 4) individuals with mean framewise displacement (FD)33 less than two SD above the sample mean (0.23±0.27mm; Supplementary Figure 1), 5) data with anatomical images providing near-full brain coverage and successful registration, 6) sites with at least 10 participants per group after the above exclusions. This yielded data for 763 individuals (ASD=360, TC=403) from 17 sites; (Supplementary Table 1).
Analytic Strategy
While the ASD literature converges on the presence of abnormal functional connectivity,9, 11 findings of hyper vs. hypoconnectivity vary across studies.20 To understand the relative contributions of hypo and hyperconnectivity in ASD, we carried out whole-brain iFC analyses for both structural and functional parcellation schemes (i.e., structural: Harvard-Oxford Atlas34, functional: Crad-20035). Whole-brain voxelwise iFC analyses were computationally impractical given the sample size. Beyond whole-brain analyses, we focused on regional voxel-wise measures of intrinsic functional architecture including seed-based iFC of the Default Network,26 ReHo,27, 36 VMHC,37 fALFF,32 and DC.30, 31, 38 See Supplementary Information.
Image Preprocessing
R-fMRI scans were preprocessed with an alpha version of the Configurable Pipeline for the Analysis of Connectomes (C-PAC, http://fcp-indi.github.com/C-PAC/). Image preprocessing steps included slice-timing and motion correction, nuisance signal regression (including 6 motion parameters, 5 CompCorr signals39 and linear trend) and temporal filtering (0.009–0.1Hz; except for fALFF). Derived R-fMRI measures were normalized to Montreal Neurological Institute (MNI)152 stereotactic space (2mm3 isotropic) with linear and non-linear registrations and spatially smoothed (applied FWHM=6mm). For VMHC analysis, functional data were registered to a symmetric template.
Whole-Brain iFC Analyses
For each parcellation scheme, we extracted the mean time-series for each unit from the preprocessed 4D time-series data in MNI space, and then calculated the full-brain connectivity matrix using Pearson correlation. Correlation coefficients were Fisher transformed to Z-scores to ensure normality. To facilitate data characterization and interpretation, we sorted connections based upon lobar (i.e., frontal, temporal, parietal, occipital, subcortical) and functional40 (i.e., heteromodal, unimodal, primary somatosensory, paralimbic, limbic, subcortical) classifications. Additionally, following prior results,41 we sorted findings based on hemispheric configuration (intrahemispheric, homotopic, heterotopic) using the structural parcellation (Crad-200 does not provide explicit homotopic regions).
Regional Measures
The following voxel-wise regional metrics were generated for each participant: 1) ReHo,36 which represents the average Kendall’s Tau correlation between a given voxel’s time-series and its 26 adjacent neighbors, 2) VMHC,37 which represents the correlation between a voxel and its opposite hemisphere counterpart on a symmetric template, 3) fALFF,32 a frequency domain metric reflecting the ratio between the amplitude of fluctuations in the 0.01–0.1 Hz band and the total amplitude within the sampled periodogram, and 4) DC,30, 31 a measure of the connectome graph indexing the number of direct connections for a given node.
Default Network iFC
To demonstrate the utility of the large-scale aggregate dataset in testing existing hypotheses, we conducted a targeted seed-based correlation examination to test previous suggestions of default network hypoconnectivity in ASD.23, 25, 42–44 We focused on its midline core,26 using spherical region-of-interest masks (radius=4mm) centered at anterior medial prefrontal cortex, and posterior cingulate.26 For each seed region, a Fisher’s Z-transformed correlation map was generated.
Group-level Analyses
We employed a general linear model implemented in DPARSF45 to examine neuroimaging differences related to diagnosis (covariates: age, FIQ, site, and mean FD). To correct for multiple comparisons at the cluster level we employed Gaussian random field theory (voxel Z>2.3, cluster-level p<0.05). For parcellation-based whole brain correlation analyses, we corrected for multiple comparisons using false discovery rate (FDR; q<0.05).46
Secondary Analyses: ‘Scrubbed’ Data
Given the potential for spurious signal changes from head micromovements,18, 33, 47–49 primary analyses accounted for group differences in micromovements by covarying for mean FD at the group-level.47 To verify the effectiveness of this approach, we repeated analyses after removing frames with FD>0.2mm (‘scrubbing’); individuals with greater than 50% of their time-series removed were excluded from analyses. fALFF was not calculated with ‘scrubbed’ data as the removal of time-points disrupts the temporal structure precluding standard Fourier transform-based approaches.14
Structural Analyses
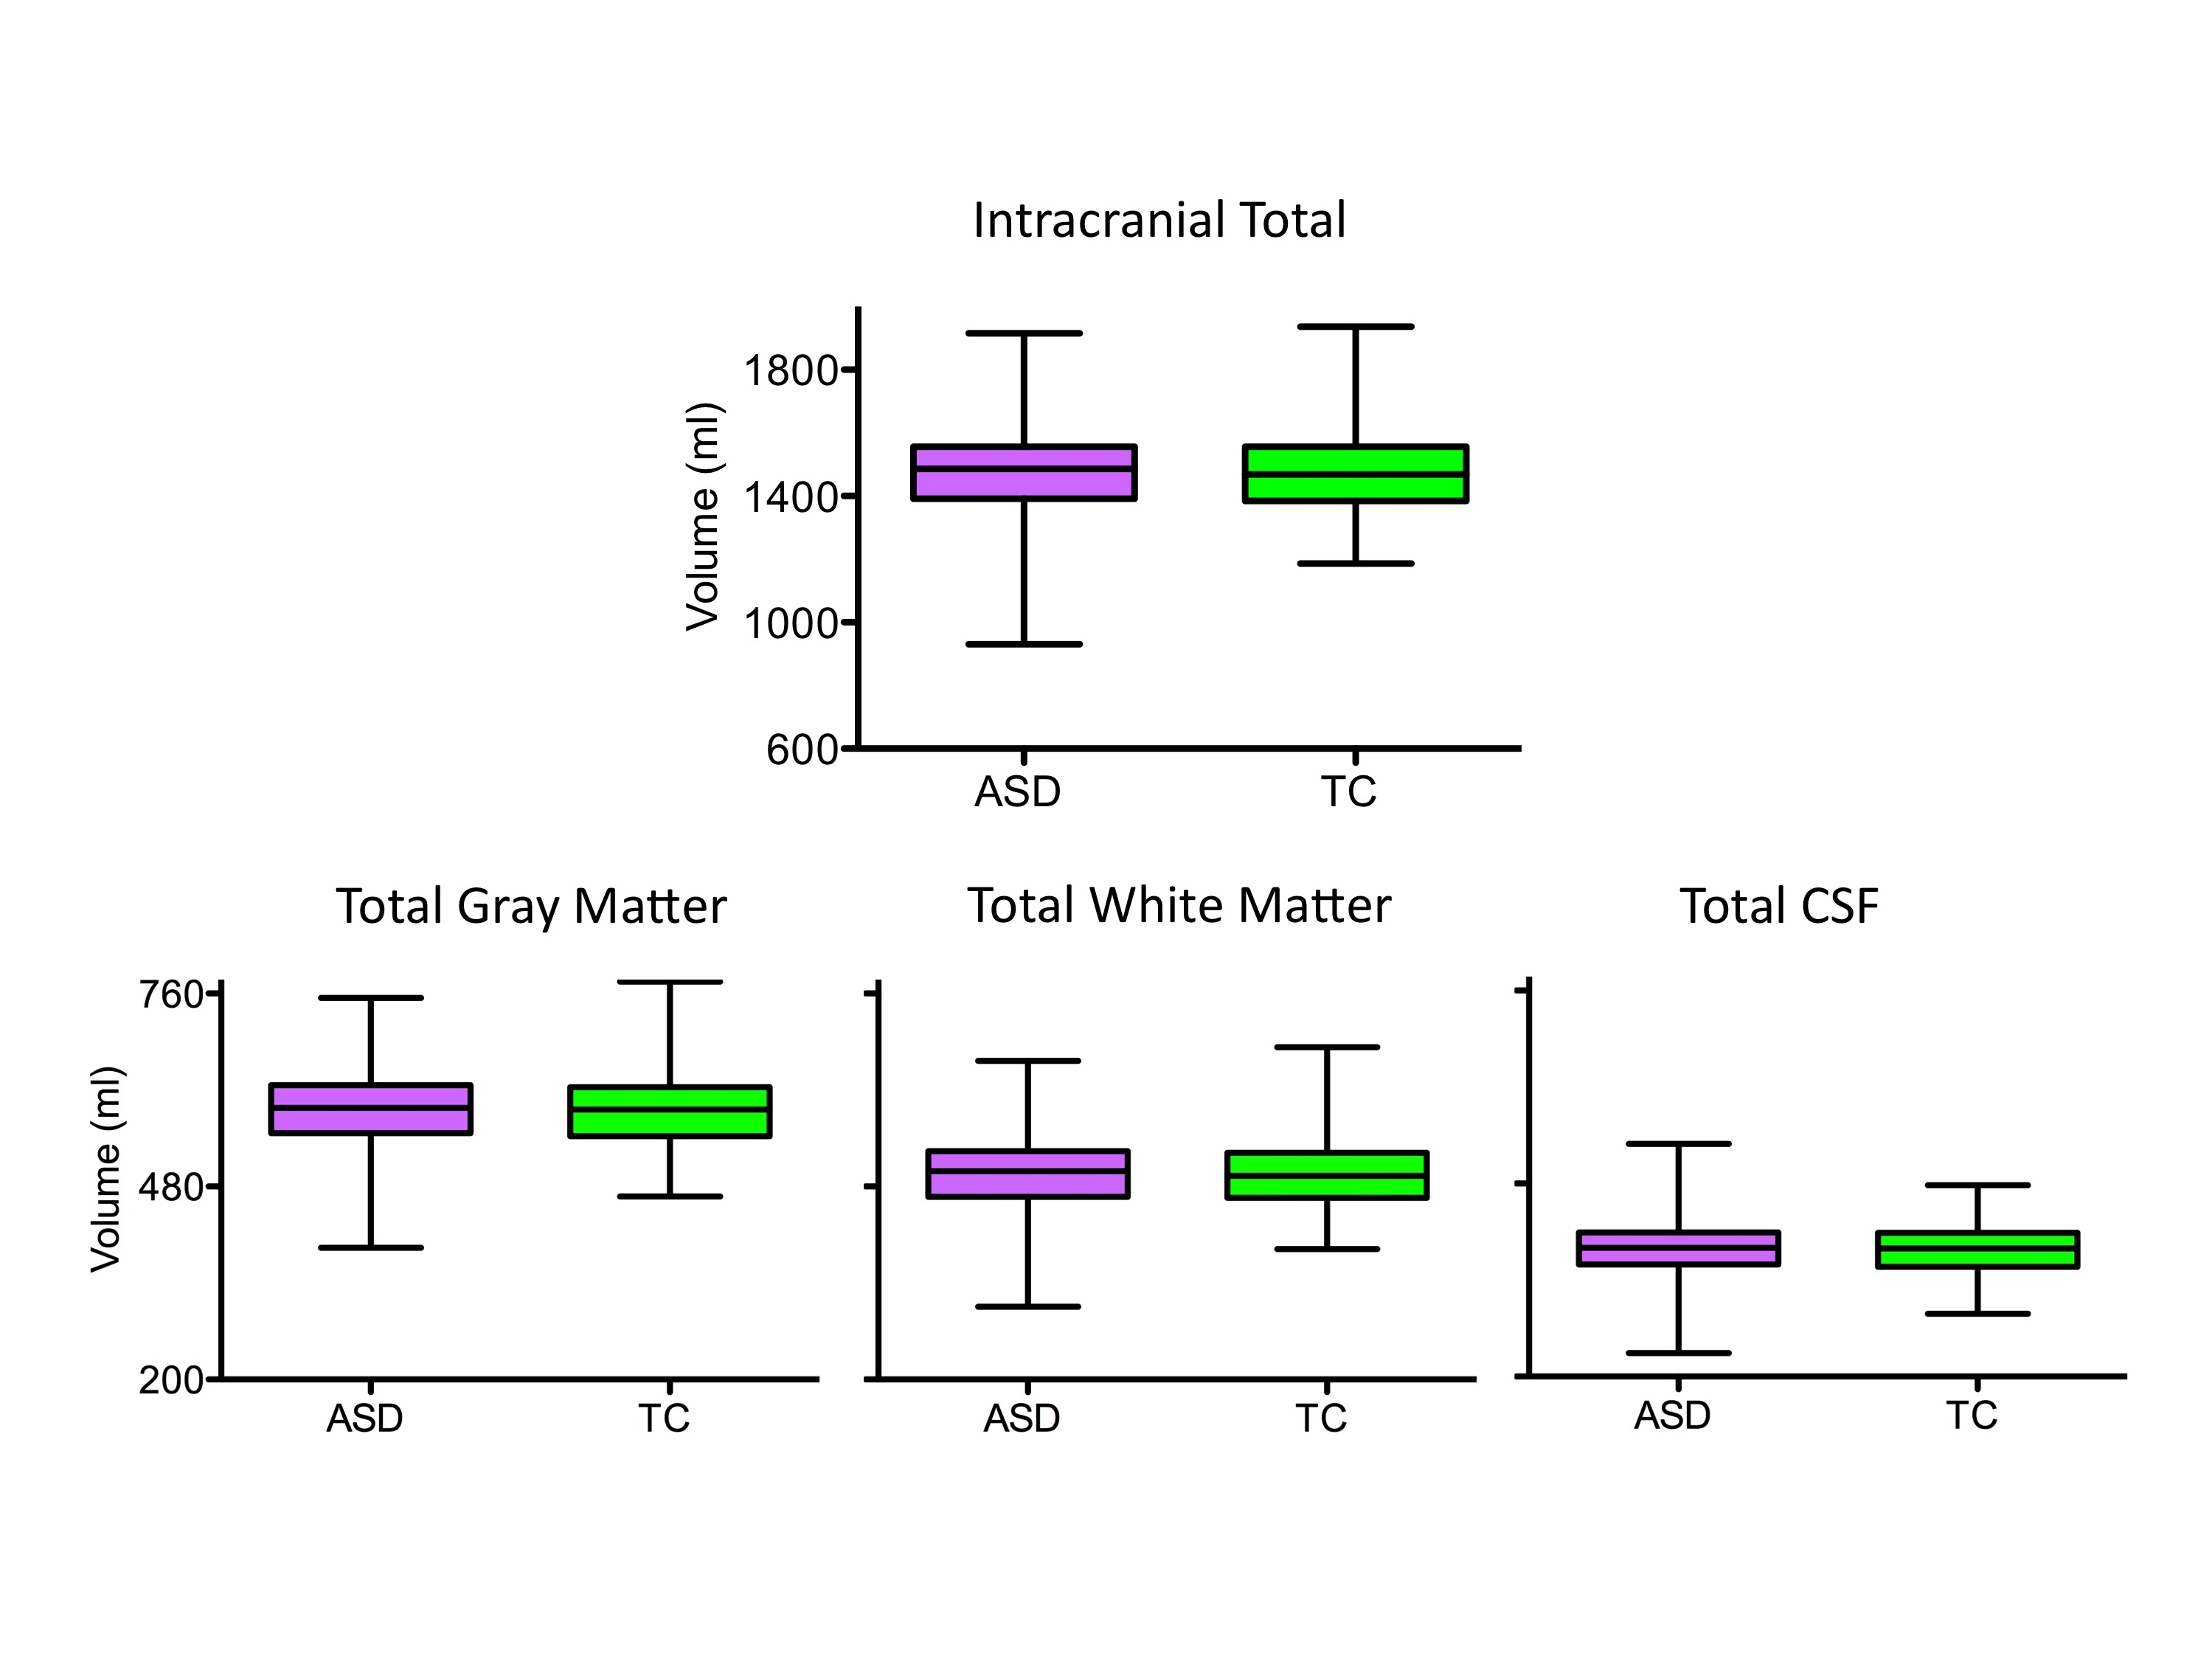
Although beyond this work’s scope, to demonstrate the ability to conduct structural analyses using ABIDE datasets, we computed total intracranial, white matter, gray matter and cerebrospinal fluid volumes; no significant group differences emerged (Supplementary Figure 2 and Information).
RESULTS
Sample Composition
Seventeen sites (Figure 1A, Supplementary Table 2) contributed 20 previously collected datasets for 1112 individuals (533 with ASD, 579 TC); 10 datasets (58%) were previously unpublished in regard to ASD vs. TC R-fMRI comparisons. Contributions per site ranged from 13 to 79 participants with ASD and 13 to 105 TC. Marked variation in age-range across samples was evident along with a vast predominance of males, with 25% of sites excluding females by design (Figure 1B, Supplementary Table 2). With few exceptions, sites included individuals with average or above-average intelligence. Mean FIQ exceeded 100 for TC for all sites and in 17 of 20 datasets for individuals with ASD. Sites varied with respect to the minimum FIQ included (ASD: 41–95; TC: 73–101; Figure 1D); Full and verbal IQ were significantly greater for TC than ASD (p < 0.0001) and so was performance IQ, though it only differed marginally (p=0.067). Right-handedness was more frequent in TC than ASD (p < 0.002). The male-only sample included for imaging analyses reflected these characteristics (Supplementary Tables 1 and 3).
Figure 1. ABIDE Sample Characteristics.

(A) Total number of participants per group (green=Typical Controls [TC], purple=Autism Spectrum Disorders [ASD]) for each contributing site ordered as a function of sample size (labeled alphabetically, see Supplementary Table 2 for label key). The same site labels are used for Figures 1 B-F. (B) Number of males (blue-white) and females (red) for each site irrespective of diagnostic group (groups were matched for sex). (C) Age (in years) for all individuals per site (ordered by youngest age included per site) irrespective of diagnostic group (groups were age matched). Each site’s mean is represented as a solid red line; the median age across sites (14.7 years) is depicted with a thick red dashed line; 25th, 75th, and 90th percentiles (11.7, 20.1, and 28.3 years, respectively) are represented by thin red dashed lines. (D) Distribution of full IQ (FIQ) standard scores per site (ordered by lowest FIQ included per site) for individuals with ASD (purple, left plot) and TC (green, right plot), respectively. Solid black lines indicate mean FIQ per site. (E) The Tukey box-whiskers plots depict the distribution of Total Autism Diagnostic Observation Scale (ADOS) scores (i.e., sum of scaled Communication and Reciprocal Social interaction subtotals) for individuals with ASD in the 13 sites using the ADOS. (F) Number of probands assigned to specific ASD diagnostic categories per site. Categories were DSM-IV-TR Autistic Disorder (red), Asperger Syndrome (aqua green), and Pervasive Developmental Disorder—Not Otherwise Specified (PDD-NOS) (white-gray pattern), and individuals identified as ASD but not further differentiated into specific DSM-IV-TR subtypes (gray). Data displayed in D and E were imputed as described in main text.
Sites reached ASD diagnoses by either 1) combining clinical judgment and “gold standard” diagnostic instruments – Autism Diagnostic Observation Schedule (ADOS) and/or Autism Diagnostic Interview –Revised (ADI-R) (n=13 samples, 65% of datasets)3, 2) clinical judgment only (n=3, 15%), or 3) “gold standard” diagnostic instruments only (n=4, 20%). Among the 17 sites employing the ADOS and/or ADI-R, 16 (94%) obtained research-reliable administrations and scorings. Site-specific details are available at http://fcon_1000.projects.nitrc.org/indi/abide. Given participant ages (> six years) and IQ, most were evaluated with ADOS Modules 3 or 4. Average ADOS total scores were similar across sites, suggesting consistency in ASD severity.
Calibrated severity scores (computed using the new ADOS algorithm for Modules 1, 2, and 350), were available for nine sites and confirmed this pattern. DSM-IV-TR diagnostic subtypes were provided by 80% of sites. Consistent with previous findings,3 sites differed substantially in subtype (Autism, Asperger Disorder, PDD-NOS) distributions (Figure 1F, Supplementary Tables 1 and 3).
Imaging Findings
Whole-Brain iFC
Regardless of parcellation scheme (structural/functional), we found both hypo and hyperconnectivity in ASD, though with a striking predominance of hypoconnectivity (Figure 2). Analyses sorting abnormal iFC based on functional hierarchy40 showed decreased cortico-cortical iFC across all functional divisions, though in varying degrees (omnibus χ42=33.5, p<0.0001), with paralimbic and unimodal association regions having the highest proportions of affected connections (Figure 2; Supplementary Table 4). Lobar-based classification suggested hypoconnectivity in all lobes, but particularly for the temporal (Supplementary Table 5). ASD-related hyperconnectivity was limited to subcortical regions, particularly for iFC between subcortical (thalamus, globus pallidus) and primary parietal sensorimotor regions; (Figure 2, Supplementary Tables 4 and 5). Finally, examining hemispheric schemes41 revealed ASD-related iFC decreases particularly in homotopic iFC (Figure 2A dorsal and coronal views; Supplementary Table 6). This pattern of results remained largely unchanged after ‘scrubbing’ - consistent with recent work18, 49 suggesting that including mean FD as a group-level covariate provides findings similar to scrubbing (Supplementary Figure 3 and Information).
Figure 2. Whole-Brain Intrinsic Functional Connectivity (iFC) Analyses.

(A) Significant group differences (i.e., Autism Spectrum Disorders [ASD] vs. Typical Controls [TC]) for iFC between each of the 112 parcellation units (56 per hemisphere) included in the structural Harvard-Oxford Atlas (HOA). Parcellations are represented with their center of mass overlaid as spheres on glass brains. The upper panel shows the intrinsic functional connections (blue lines) that were significantly weaker in ASD vs. TC. The lower panel shows the intrinsic functional connections that were significantly stronger in ASD relative to TC (red lines). Each HOA unit is colored based on its membership in the six functional divisions per Mesulam et al.44 [yellow=primary sensorimotor (SM); green=unimodal association; blue=heteromodal association; orange=paralimbic; red=limbic; pink=subcortical]. Interhemispheric iFC is noted on dorsal and coronal views. Glass brains (left lateral, dorsal, and coronal views, shown from left to right) are generated using BrainNet Viewer (http://www.nitrc.org/projects/bnv/). Displayed results are corrected for multiple comparisons using false discovery rate (FDR) at p<0.05. (B) The table summarizes the absolute number and percentage of node-to-node iFC surviving statistical threshold for group comparisons within and between functional divisions. Gray cells represent absence of significant iFC, blue cells represent ASD-related hypoconnectivity (Hypo: ASD<TC), while red cells represent hyperconnectivity (Hyper: ASD>TC). Blue and red shadings decrease proportionally from the highest percentage (37%) to the lowest (~0%). See Supplementary Tables 4, 5 and 6 for results based on lobar and hemispheric divisions as well as for those based on the Crad-200 functional parcellation and Supplementary Information for further discussion on the approach.
Regional Abnormalities
Figure 3 shows brain regions exhibiting significant group differences in regional metrics. We highlight regions exhibiting convergence in ASD-related differences among measures, suggesting more pervasive disturbances in ASD (Figure 4). Two clusters exhibited ASD-related abnormalities in three measures. The first extended from the left posterior insula to the central and parietal operculum and exhibited ASD-related decreases in VMHC, ReHo, and DC. The second cluster was located in right dorsal superior frontal cortex and exhibited ASD-related increases in fALFF, ReHo, and DC. A distributed set of regions exhibited ASD-related reductions in at least two measures, including thalamus, posterior cingulate, bilateral mid-insula, and left middle occipital gyrus. Again, these findings were largely unchanged after ‘scrubbing’ (Supplementary Figure 4).
Figure 3. Regional Measures of Intrinsic Functional Architecture.

(A) Z maps of the grand means (i.e., across all 763 individuals) and (B) significant group differences between individuals with Autism Spectrum Disorders (ASD) and Typical Controls (TC) for each of the four regional measures examined. These were fractional amplitude of low frequency fluctuations (fALFF), regional homogeneity (ReHo), voxel-mirrored homotopic connectivity (VMHC), and degree centrality (DC). We employed Gaussian random field theory to carry out cluster-level corrections for multiple comparisons (voxel-level Z>2.3; cluster significance: p<0.05, corrected). Significant clusters are overlaid on inflated surface maps generated using BrainNet Viewer (http://www.nitrc.org/projects/bnv/), as well as on axial images generated with REST Slice Viewer (http://www.restfmri.net). L= Left hemisphere; R= Right hemisphere.
Figure 4. Overlap Between Regional Measures of Intrinsic Brain Function.

(A) Surface and axial maps depict the extent of overlap for significant group differences (i.e., Autism Spectrum Disorders [ASD] vs. Typical Controls [TC]) among any of the four regional measures of intrinsic brain function shown in Figure 3. Purple clusters represent areas of significant group differences emerging for only one measure; orange and yellow clusters indicate measures with overlap among 2 and 3 measures, respectively. (B) For each of the yellow and orange clusters in panel A, the table lists the cluster’s anatomical area label, cluster size in number of voxels, and stereotaxic coordinates for the center of mass in Montreal Neurological Institute (MNI) coordinates, the specific measures involved in the overlap, and the group difference direction (ASD>TC in red, ASD<TC in blue). L= Left hemisphere; R= Right hemisphere.
Focus on the Default Network
Seed-based correlations confirmed previous findings of ASD-related default network hypoconnectivity.23, 25, 42–44 Specifically, we noted decreased long-distance iFC between its anterior and posterior components. We also found decreased iFC between each of the default network components and their neighboring regions (e.g., posterior cingulate and precuneus; anterior medial and dorsomedial prefrontal cortex). Decreases in long-distance iFC were robust to the specific motion-correction employed (‘scrubbing’, group-level correction). In contrast, ASD-related decreases in local iFC were less robust; they were detectable for posterior cingulate, but not for medial prefrontal cortex in secondary analyses using ‘scrubbed’ data (Supplementary Figure 4).
Site-Related Variation
Based on prior work,15 the ability to detect ASD-related differences in the ABIDE sample does not imply a lack of site-related variation. Although not a primary focus of this study, we present a demonstration of site-related variation and a parametric analysis of the impact of sample size on detectable differences for a representative finding (i.e., left insula VMHC; Supplementary Figures 5, 6 and Information).
Normality
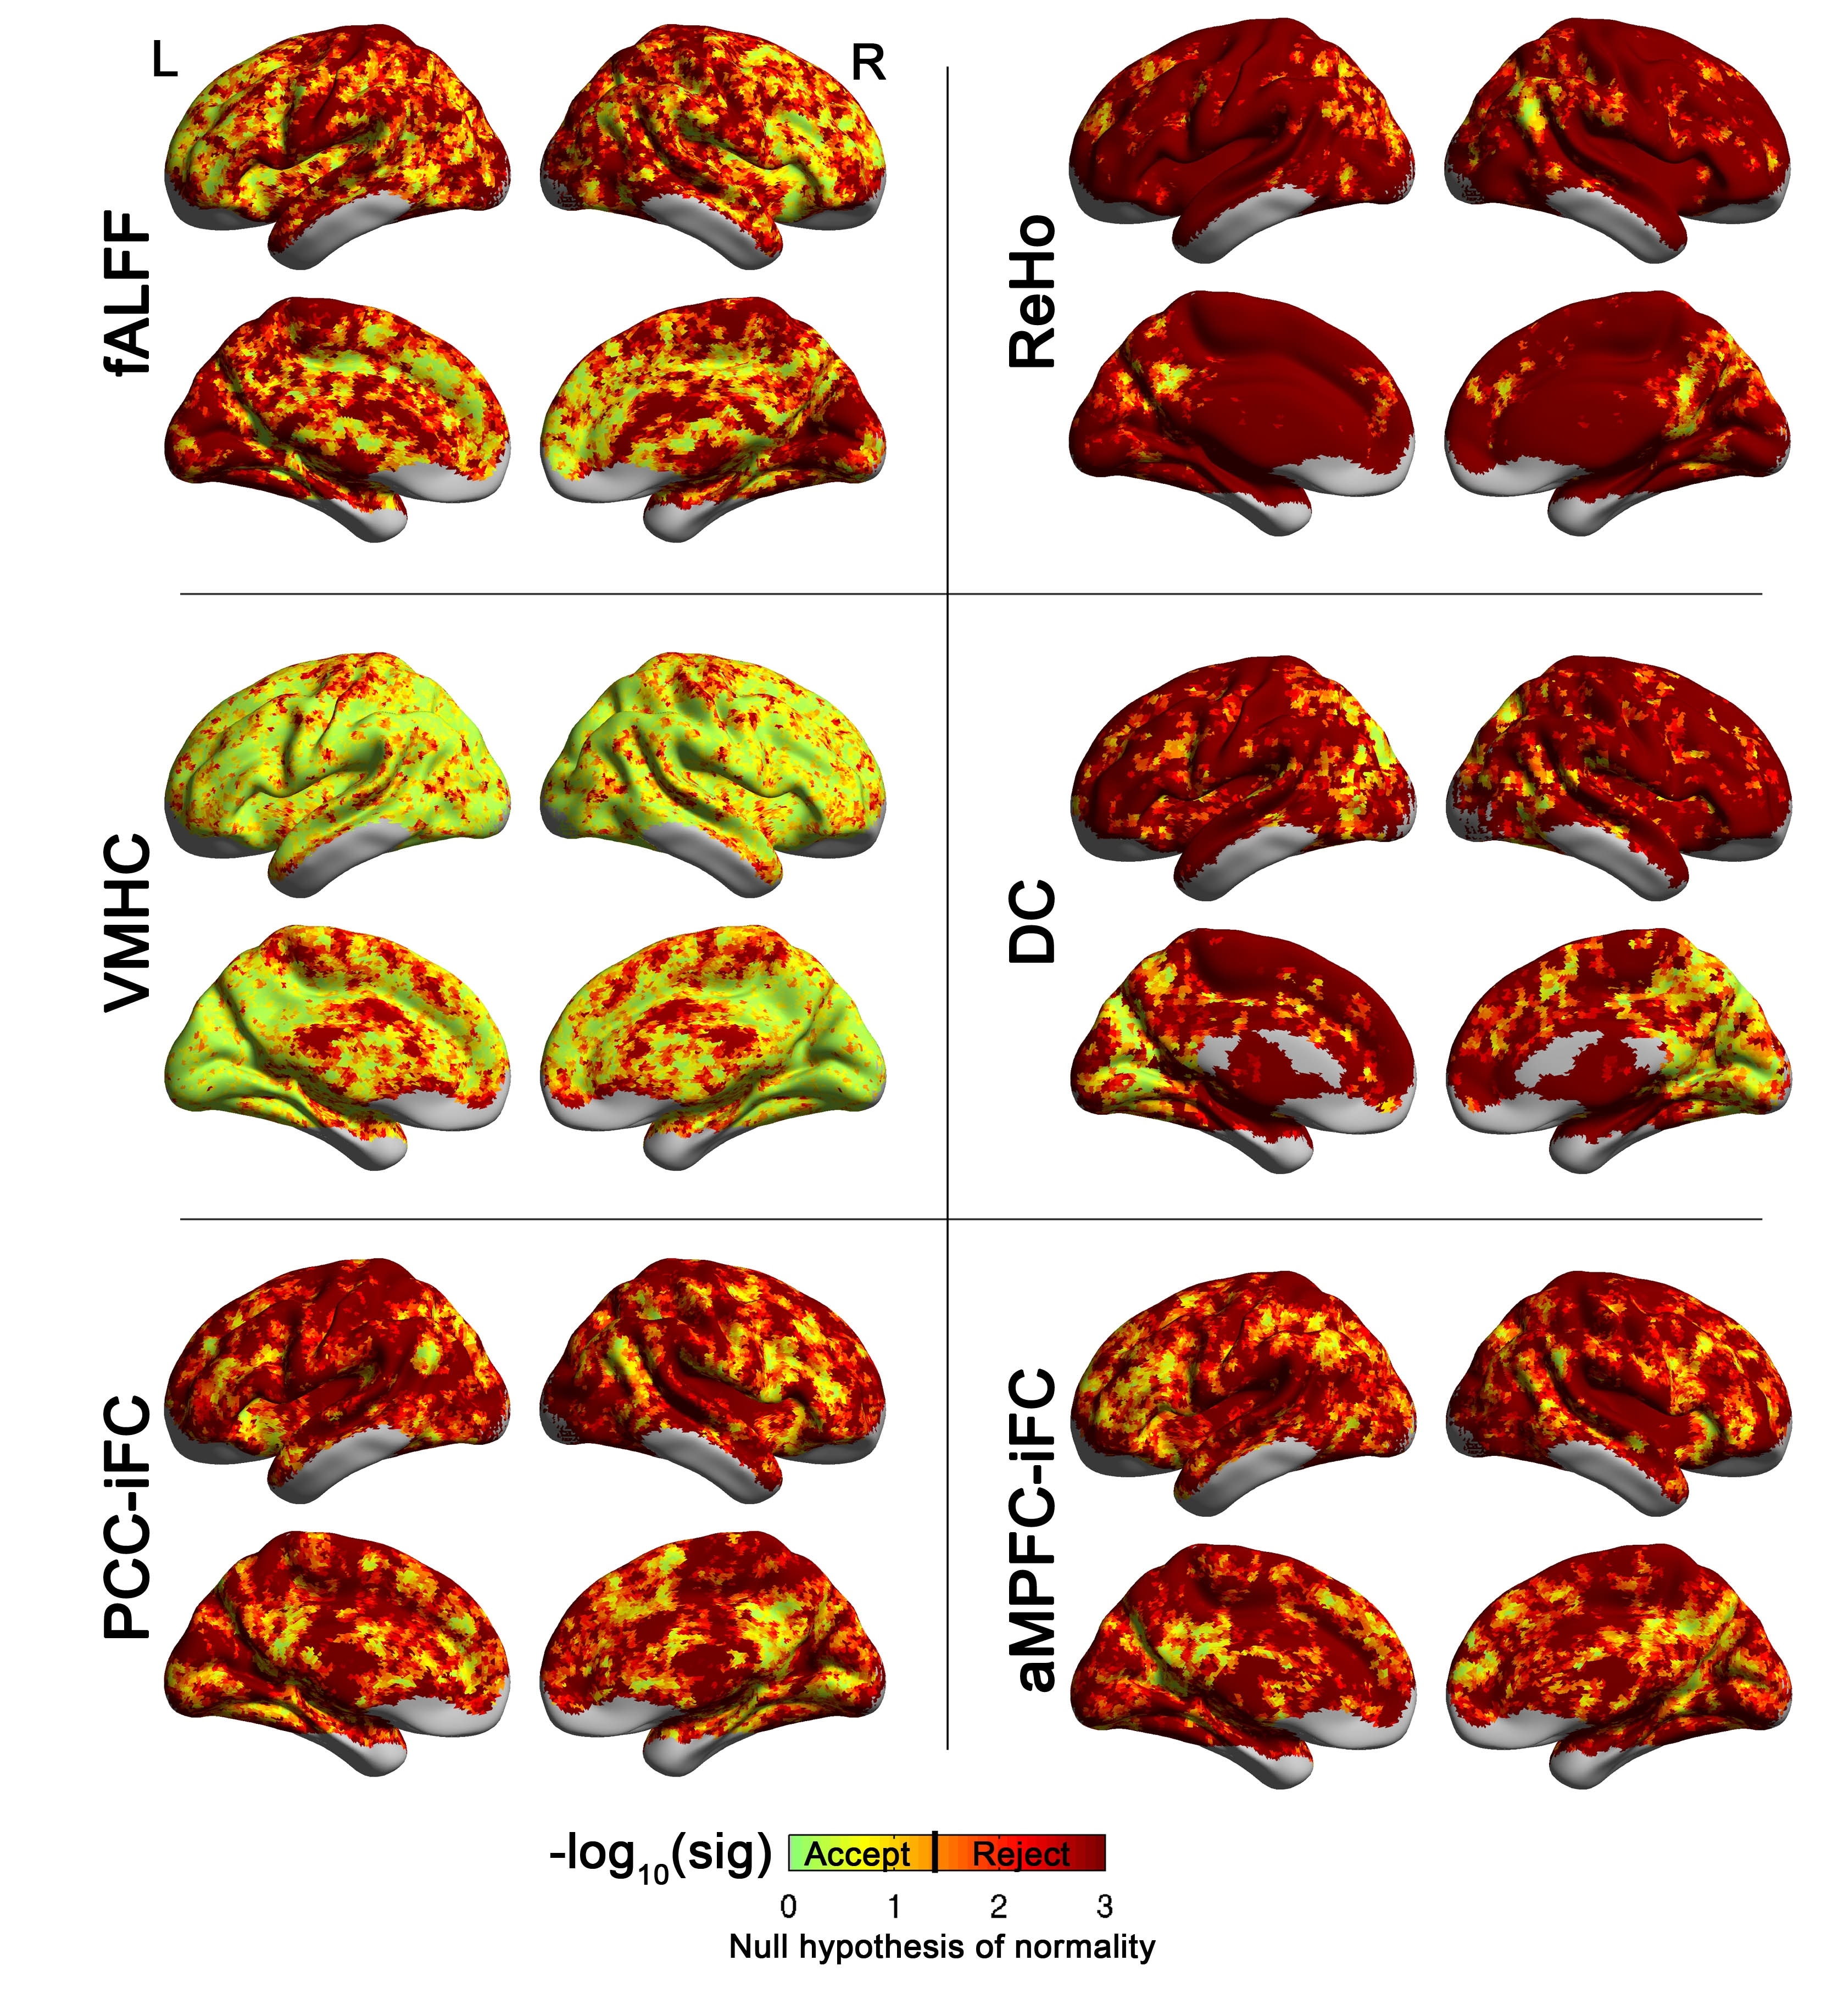
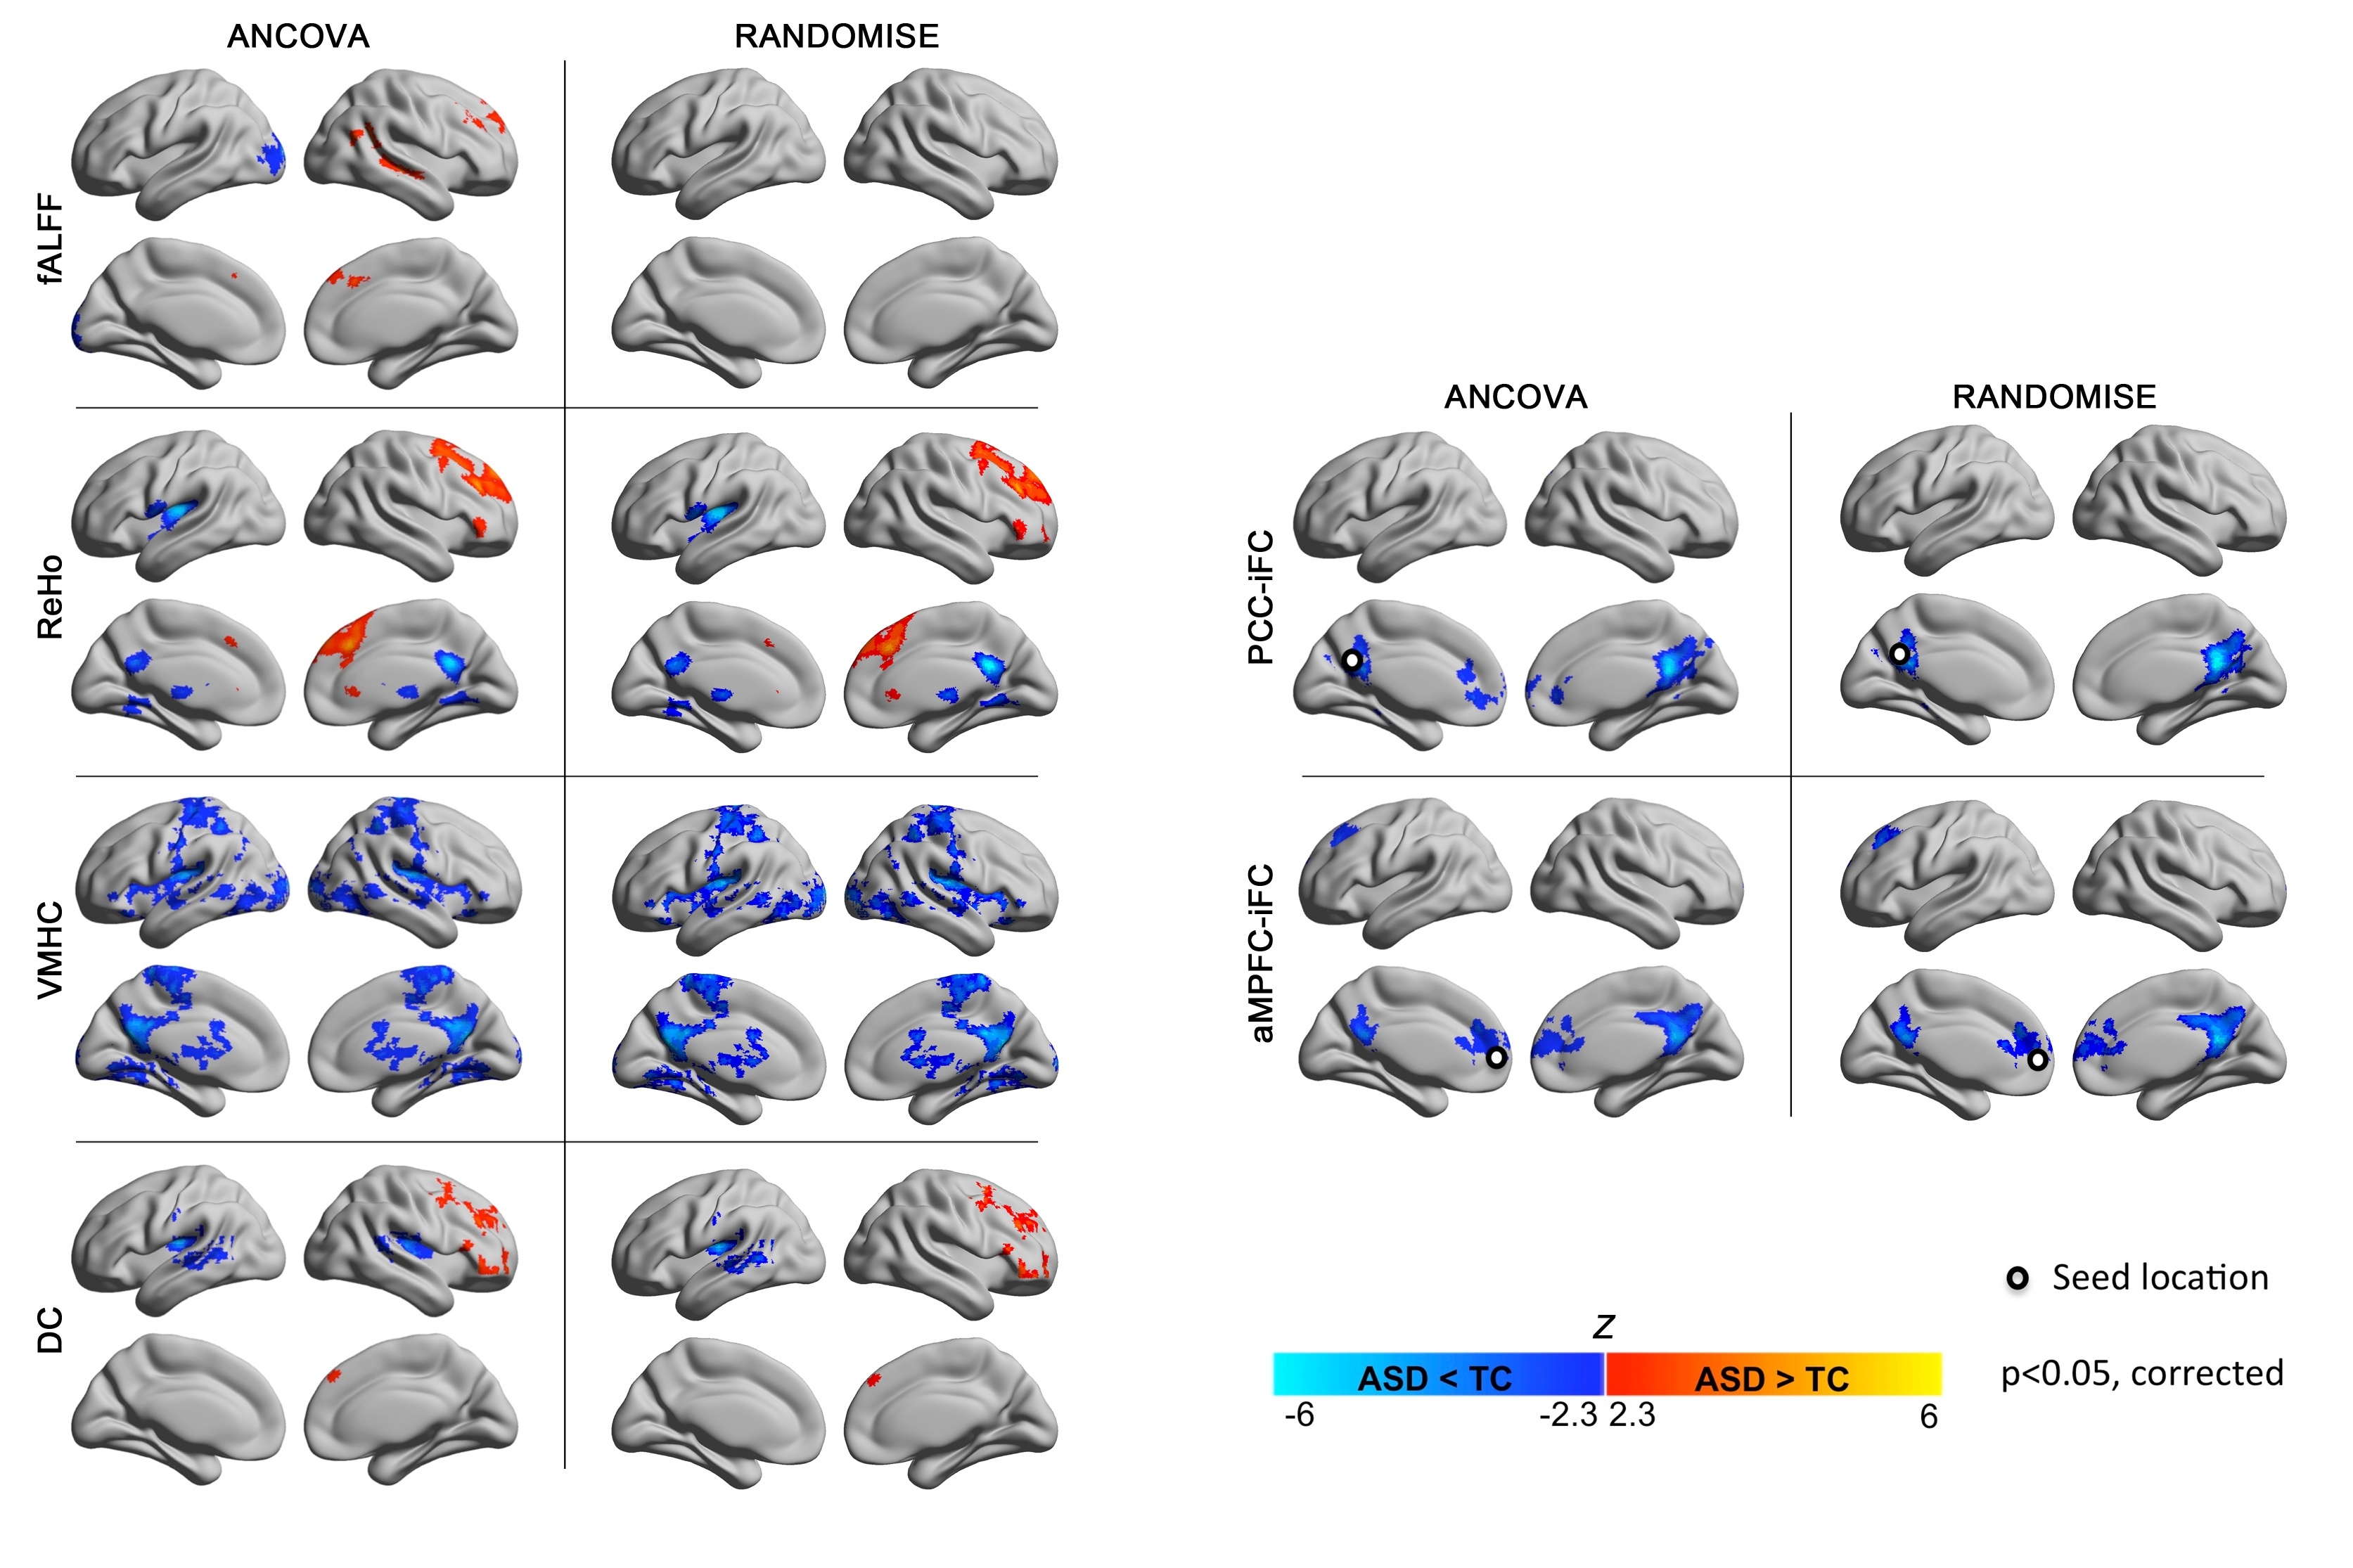
Reflective of common-practice, the present work employed parametric statistics. Supplementary Figure 7 demonstrates regional variation in the degree to which assumptions of normality are maintained. Non-parametric confirmatory analyses conducted at the cluster level supported results of primary analyses (Supplementary Table 7). Future work may benefit from exploring voxel-wise non-parametric approaches, when normality assumptions are violated (Supplementary Figure 8 and information).
DISCUSSION
The feasibility of establishing ABIDE, a collection of 20 mostly unpublished samples from 17 independent sites, testifies to the rapid adoption of R-fMRI approaches to ASD as well as to the benefits of diagnostic harmonization in ASD. Our initial analyses of the ABIDE R-fMRI data replicate and extend key findings in ASD, and highlight emerging significant themes that merit further study.
Whole-brain connectivity analyses reconciled seemingly conflicting evidence of hypo and hyperconnectivity,20, 24, 51, 52 by revealing both phenomena in ASD, though to different degrees and with distinct topographies. Specifically, while findings of hyperconnectivity in ASD were limited and primarily associated with subcortical regions, ASD-related hypoconnectivity dominated cortico-cortical iFC. Of note, while ASD-related decreases in iFC extended across functional cortical divisions, there was a predilection for unimodal association areas and paralimbic circuits. The prominence of unimodal association areas is in line with the autism literature, which has consistently implicated the fusiform gyrus,53 and superior temporal gyrus.54 Likewise, the implication of paralimbic areas is consistent with studies highlighting ASD-related dysfunction within higher order circuits subserving social, cognitive and affective processes.21, 25 Findings of ASD-related decreases in iFC within the default network midline core further amplify this theme.
Our results also underscore another emerging theme: alterations in interhemispheric connectivity.10, 28, 29, 55–59 Structural morphometric abnormalities (e.g., volume,10, 56, 57 microstructure55, 59–61) in the corpus callosum first drew attention to ASD-related interhemispheric dysconnections. While initial volumetric studies only found evidence of partial compromise of the corpus callosum, diffusion tensor imaging studies of corpus callosum microstructure have suggested abnormalities extending to all major subdivisions.59, 61 Similarly, while initial R-fMRI studies reported abnormalities in interhemispheric iFC for sensorimotor and language areas,28, 29 whole-brain analyses suggest broader compromises, affecting 30% of homotopic connections, across functional hierarchies or lobes. Given that interhemispheric interactions are thought to facilitate high-load cognitive processes,62 findings of altered connectivity extending across systems may be relevant to models emphasizing impairments of complex reasoning and information processing in ASD.63 Intriguingly, the present work also highlighted decreases in voxel-wise interhemispheric iFC of subcortical areas, suggesting that callosal abnormalities may not exclusively account for abnormal interhemispheric interactions in ASD.
A concern in R-fMRI studies is that requirements for a priori information (e.g., seed-specification; number of components in independent component or cluster analyses) influence results. By applying a broad array of unbiased regional metrics, we successfully recapitulated some of the most commonly cited loci of dysfunction (e.g., insula,64–66 PCC23, 42, 67–69). Findings of abnormal iFC also converged on a less commonly considered region - the thalamus. While initial R-fMRI studies tended to focus on large-scale cortico-cortico networks,23, 42 recent work has emphasized examination of subcortical functional circuits (e.g., cortico-striato-thalamo-cortical circuitry).52, 70 The role of these circuits in both sensory-motor processes and learning – fundamental mechanisms that may underlie the pervasive clinical impairments in ASD – make them appealing targets for future studies. Beyond the added value of extending the scope of circuits examined in ASD, unprecedented findings of abnormal fALFF in ASD highlight the need to investigate properties of the intrinsic brain beyond functional connectivity. Supporting this notion, recent work suggests that examination of intrinsic fluctuations in the BOLD signal may provide a window into more fundamental neuronal signatures of ASD.71, 72
Along with the substantial statistical power afforded by the ABIDE aggregate sample, we also note remaining challenges for the field. In particular, the relationships of IQ to psychiatric disorders and brain structure and function are always complex, and the same holds for our sample. Across sites, the ASD and TC groups both tended to cluster around the average to above-average range of FIQ; however, marked between-site variation was noted in the range, mean values, and SD – particularly for individuals with ASD. Future work will need to attend even more closely to IQ, as R-fMRI studies allow the inclusion of individuals with substantially lower IQ than task-based approaches. Beyond IQ, we observed notable variation in the specific diagnostic subtypes reported across studies. Such heterogeneity in presentations of ASD must be considered when generalizing findings from an individual study to the larger literature. Revisions proposed for DSM-5 offer the promise of increasing the accuracy with which heterogeneity in ASD is characterized.3
The present findings of ASD-related differences in intrinsic functional architecture despite variations in age across sites suggest that some aspects of the neural signatures of ASD remain constant throughout brain maturation. Yet, mirroring the architectural properties observed in early childhood,73 evidence of cortico-cortical hypoconnectivity and subcortico-cortical hyperconnectivity suggest maturational abnormalities in ASD.52 As only a few ABIDE sites spanned childhood to middle adulthood, a definitive examination of the developing brain in ASD is beyond the scope of the present work. Future efforts need to delve into the ascertainment of the developmental dynamics of autism. Including younger ages is a must for such efforts. A meta-analysis of the task-based autism imaging literature in 2009 found that most studies at the time were conducted in adults.69 The greater representation of children, albeit above 6, in the ABIDE sample suggests that R-fMRI facilitates the examination of neural circuitry at younger ages. Still, the first six years of life represent a critical period in neurodevelopment. Further, initial presentations and diagnosis of ASD extend down to as early as 24 months. With rare exceptions,28, 74 early development is poorly represented in the neuroimaging literature. As the field moves towards a more comprehensive understanding of the neural basis of ASD and their developmental trajectories, a shift towards imaging toddlers and preschoolers is unavoidable – particularly if imaging is to strive for clinical utility.
Future efforts should also focus on standardized phenotyping, including and extending diagnostic assessments. This will allow comprehensive characterization of dimensional brain-behavior relationships. In addition, physiologic measurements capable of indexing ASD-related abnormalities in brain function should be considered (e.g., eye tracking). Finally, it must be acknowledged that while studies establishing the test-retest reliability for R-fMRI have alleviated concerns about the uncontrolled nature of rest,12 potential concerns remain that group-differences in mental states associated with the magnet environment (e.g., anxiety) can contribute to findings. Future efforts examining the unique signatures of differing mental states in R-fMRI data should be encouraged.
In summary, the construction and open release of the ABIDE sample represents a landmark milestone in autism imaging. Bringing together international datasets, the ABIDE sample allows for replication, secondary analyses and discovery efforts, as demonstrated in the present work, and provides insights into study designs for the next generation of investigations using multifaceted databases such as NDAR rapidly growing in size.75
Supplementary Material
(A) Mean framewise displacement and (B) percentage of scans with framewise displacement > .2mm are plotted for each subject’s functional dataset at each site (labeled alphabetically, see Supplementary Table 2 for label key) for the data of individuals with autism spectrum disorder (ASD; violet right side plots) and typical control (TC; green left side plots). The red dashed line in panel A represents the cutoff used for inclusion in neuroimaging analyses (=0.8 mm which corresponds to two standard deviations above the mean of the whole sample). The dashed line in panel B represents the cutoff (50%) for inclusion in secondary analyses conducted on scrubbed data (only sites with a minimum of 6 datasets per group with at least 50% frames < .2 mm were included in these analyses). Of note, 1111 functional data are plotted here as one functional dataset with four time points (site f) was discarded from any analyses. It is important to note that the ABIDE consortium, after substantial consideration, decided that data should be shared regardless of movement artifacts. As highlighted by Milham (2012)2, this decision was motivated by the lack of consensus regarding data quality standards, and potential differences in quality requirements based on individual user’s needs. Additionally, poor quality data may be useful for efforts to develop algorithms capable of correcting movement artifacts, and may one day prove useful for data analysis if more effective correction approaches emerge. As Supplementary Figure 1 shows, most shared data had limited micromovements. With regard to variations among sites, some sites only shared data that had been quality-controlled. To make users aware of such variations, we draw their attention to the ABIDE website (http://fcon_1000.projects.nitrc.org/indi/abide/), which states whether quality control was applied to select data to be shared, and provides information on the protocols utilized to prepare participants for scan sessions at each site.
The Tukey box-whiskers plots depict the distribution of total intracranial volume, total gray matter and total white matter, and cerebrospinal fluid (CSF) volumes for the datasets of individuals with autism spectrum disorder (ASD, violet) and typical controls (TC, green). For illustration purposes, we plotted fitted values by regressing out the covariates used for ANCOVAs group comparisons (i.e., age, FIQ, mean frame wise displacement, and site). The results of ANCOVA group comparisons showed that the two groups did not significantly differ in regard to these global measures. See Supplementary Information for details on volumetric analyses.
Whole-brain analyses were repeated using individual data censored for frames with movement >0.2mm (‘scrubbing’): only sites with at least six subjects per group remaining with at least 50% frames retained were included (184 with Autism Spectrum Disorders [ASD] and 253 Typical Controls [TC]). The glass brains display the pattern of significant group differences (i.e., ASD vs. TC) for iFC between each of the 112 parcellation units (56 per hemisphere) included in the structural Harvard-Oxford Atlas (HOA). Parcellations are represented with their centers of mass overlaid as spheres on glass brains. The upper panel shows the intrinsic functional connections (blue lines) that were significantly weaker in ASD vs. TC. The lower panel shows the intrinsic functional connections that were significantly stronger in ASD relative to TC (red lines). Each HOA unit is colored based on its membership in the six functional divisions per Mesulam et al.44 [yellow=primary sensorimotor (SM); green=unimodal association; blue=heteromodal association; orange=paralimbic; red=limbic; pink=subcortical]. Interhemispheric iFC is noted on dorsal and coronal views. Glass brains (left lateral, dorsal, and coronal views, shown from left to right) were generated using BrainNet Viewer (http://www.nitrc.org/projects/bnv/). Displayed results are corrected for multiple comparisons using false discovery rate (FDR) at p<0.05.
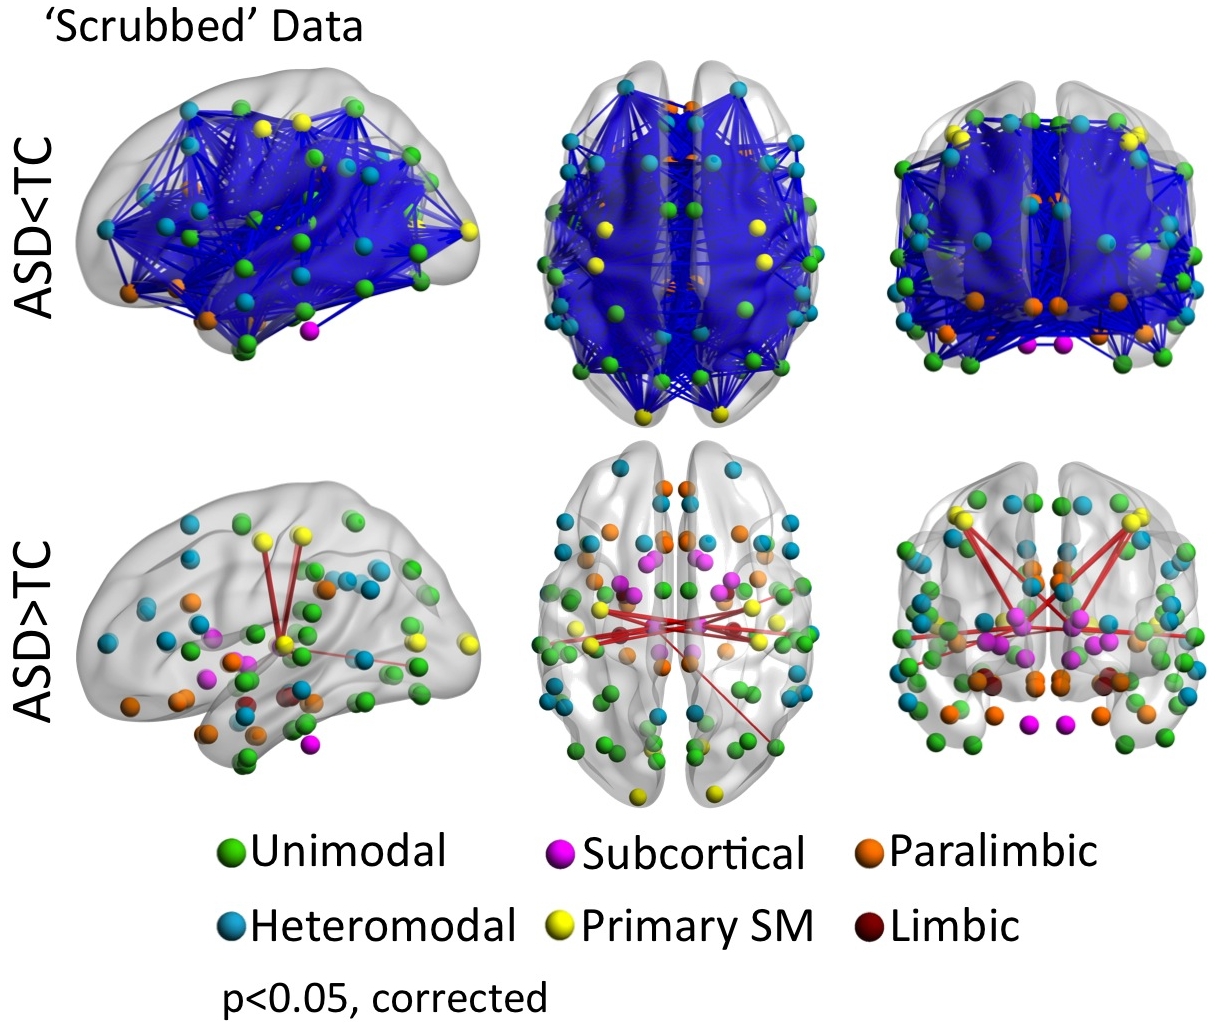
We repeated analyses on regional measures of intrinsic functional architecture as well as seed-based correlation of the core midline seeds of the default network (DN) with individual data censoring frames with movement >0.2mm (‘scrubbing’). Only datasets from sites remaining with at least six subjects per each diagnostic group (Autism Spectrum Disorders [ASD] and Typical Controls [TC]) presenting with at least 50% frames retained were included (184 with ASD and 253 TC). (A) Z maps of the grand means (i.e., across all 437 scrubbed individual data) and (B) significant group differences between individuals with ASD and TC for regional homogeneity (ReHo), voxel-mirrored homotopic connectivity (VMHC), degree centrality (DC), as well as seed-based correlation of posterior cingulate cortex (PCC) and anterior medial prefrontal cortex (aMPFC). Seeds were centered at Montreal Neurological Institute stereotaxic coordinates x=−8, y=−56, z=26 for PCC and x=−6, y=52, z=−2 for aMPFC, and are depicted as white dots on the surface maps. Fractional amplitude of low frequency fluctuations (fALFF) was not calculated with ‘scrubbed’ data as the removal of time points disrupts the temporal structure and thus limits standard Fourier transform-based approaches.14 We employed Gaussian random field theory to carry out cluster-level corrections for multiple comparisons (Z> 2.3, p<.05). Significant clusters are overlaid on inflated surface maps generated using BrainNet Viewer (http://www.nitrc.org/projects/bnv/), as well as on axial images generated with REST Slice Viewer (http://www.restfmri.net). L= Left hemisphere; R= Right hemisphere
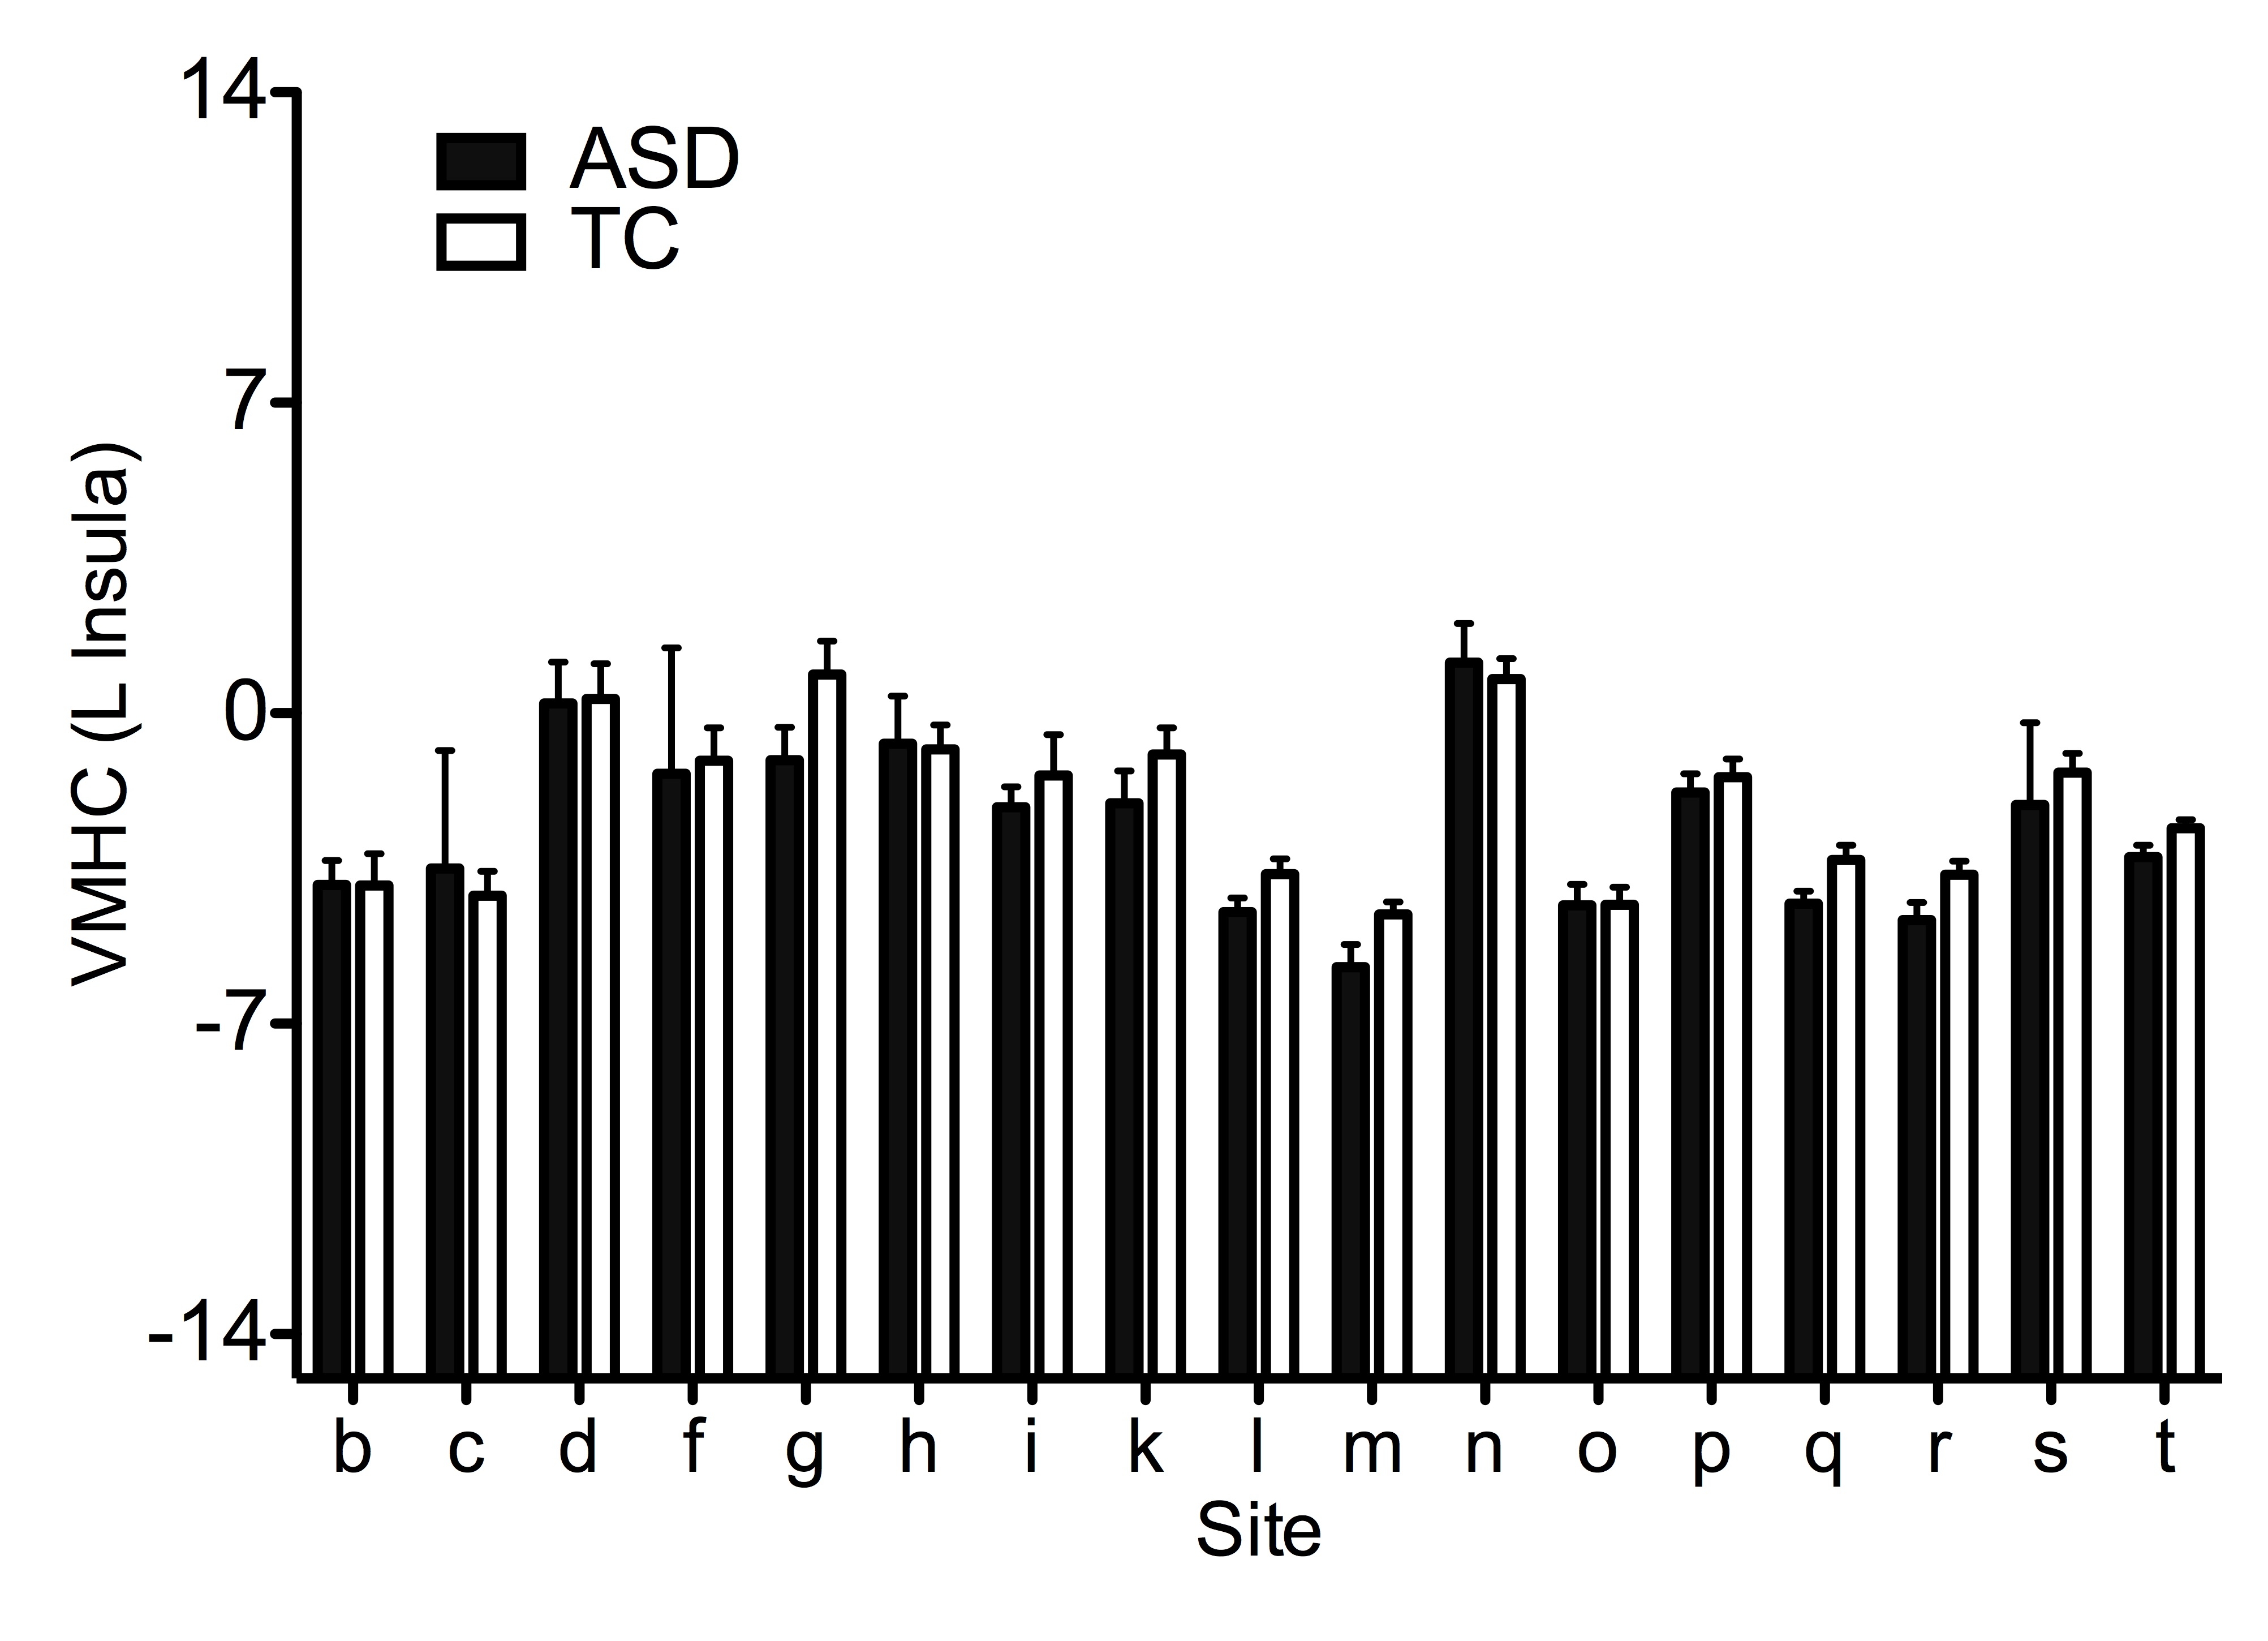
Supplementary Figure 5 Site-related variation in group differences for the voxel mirrored homotopic connectivity (VMHC) of the left insula cluster identified based on convergent abnormalities across three regional measures in primary analyses (See Figure 4). Age, FIQ, and mean framewise displacement were regressed out from VMHC across subjects, thus the group means (± SEM) represent adjusted VMHC Z values. See Supplementary Information.
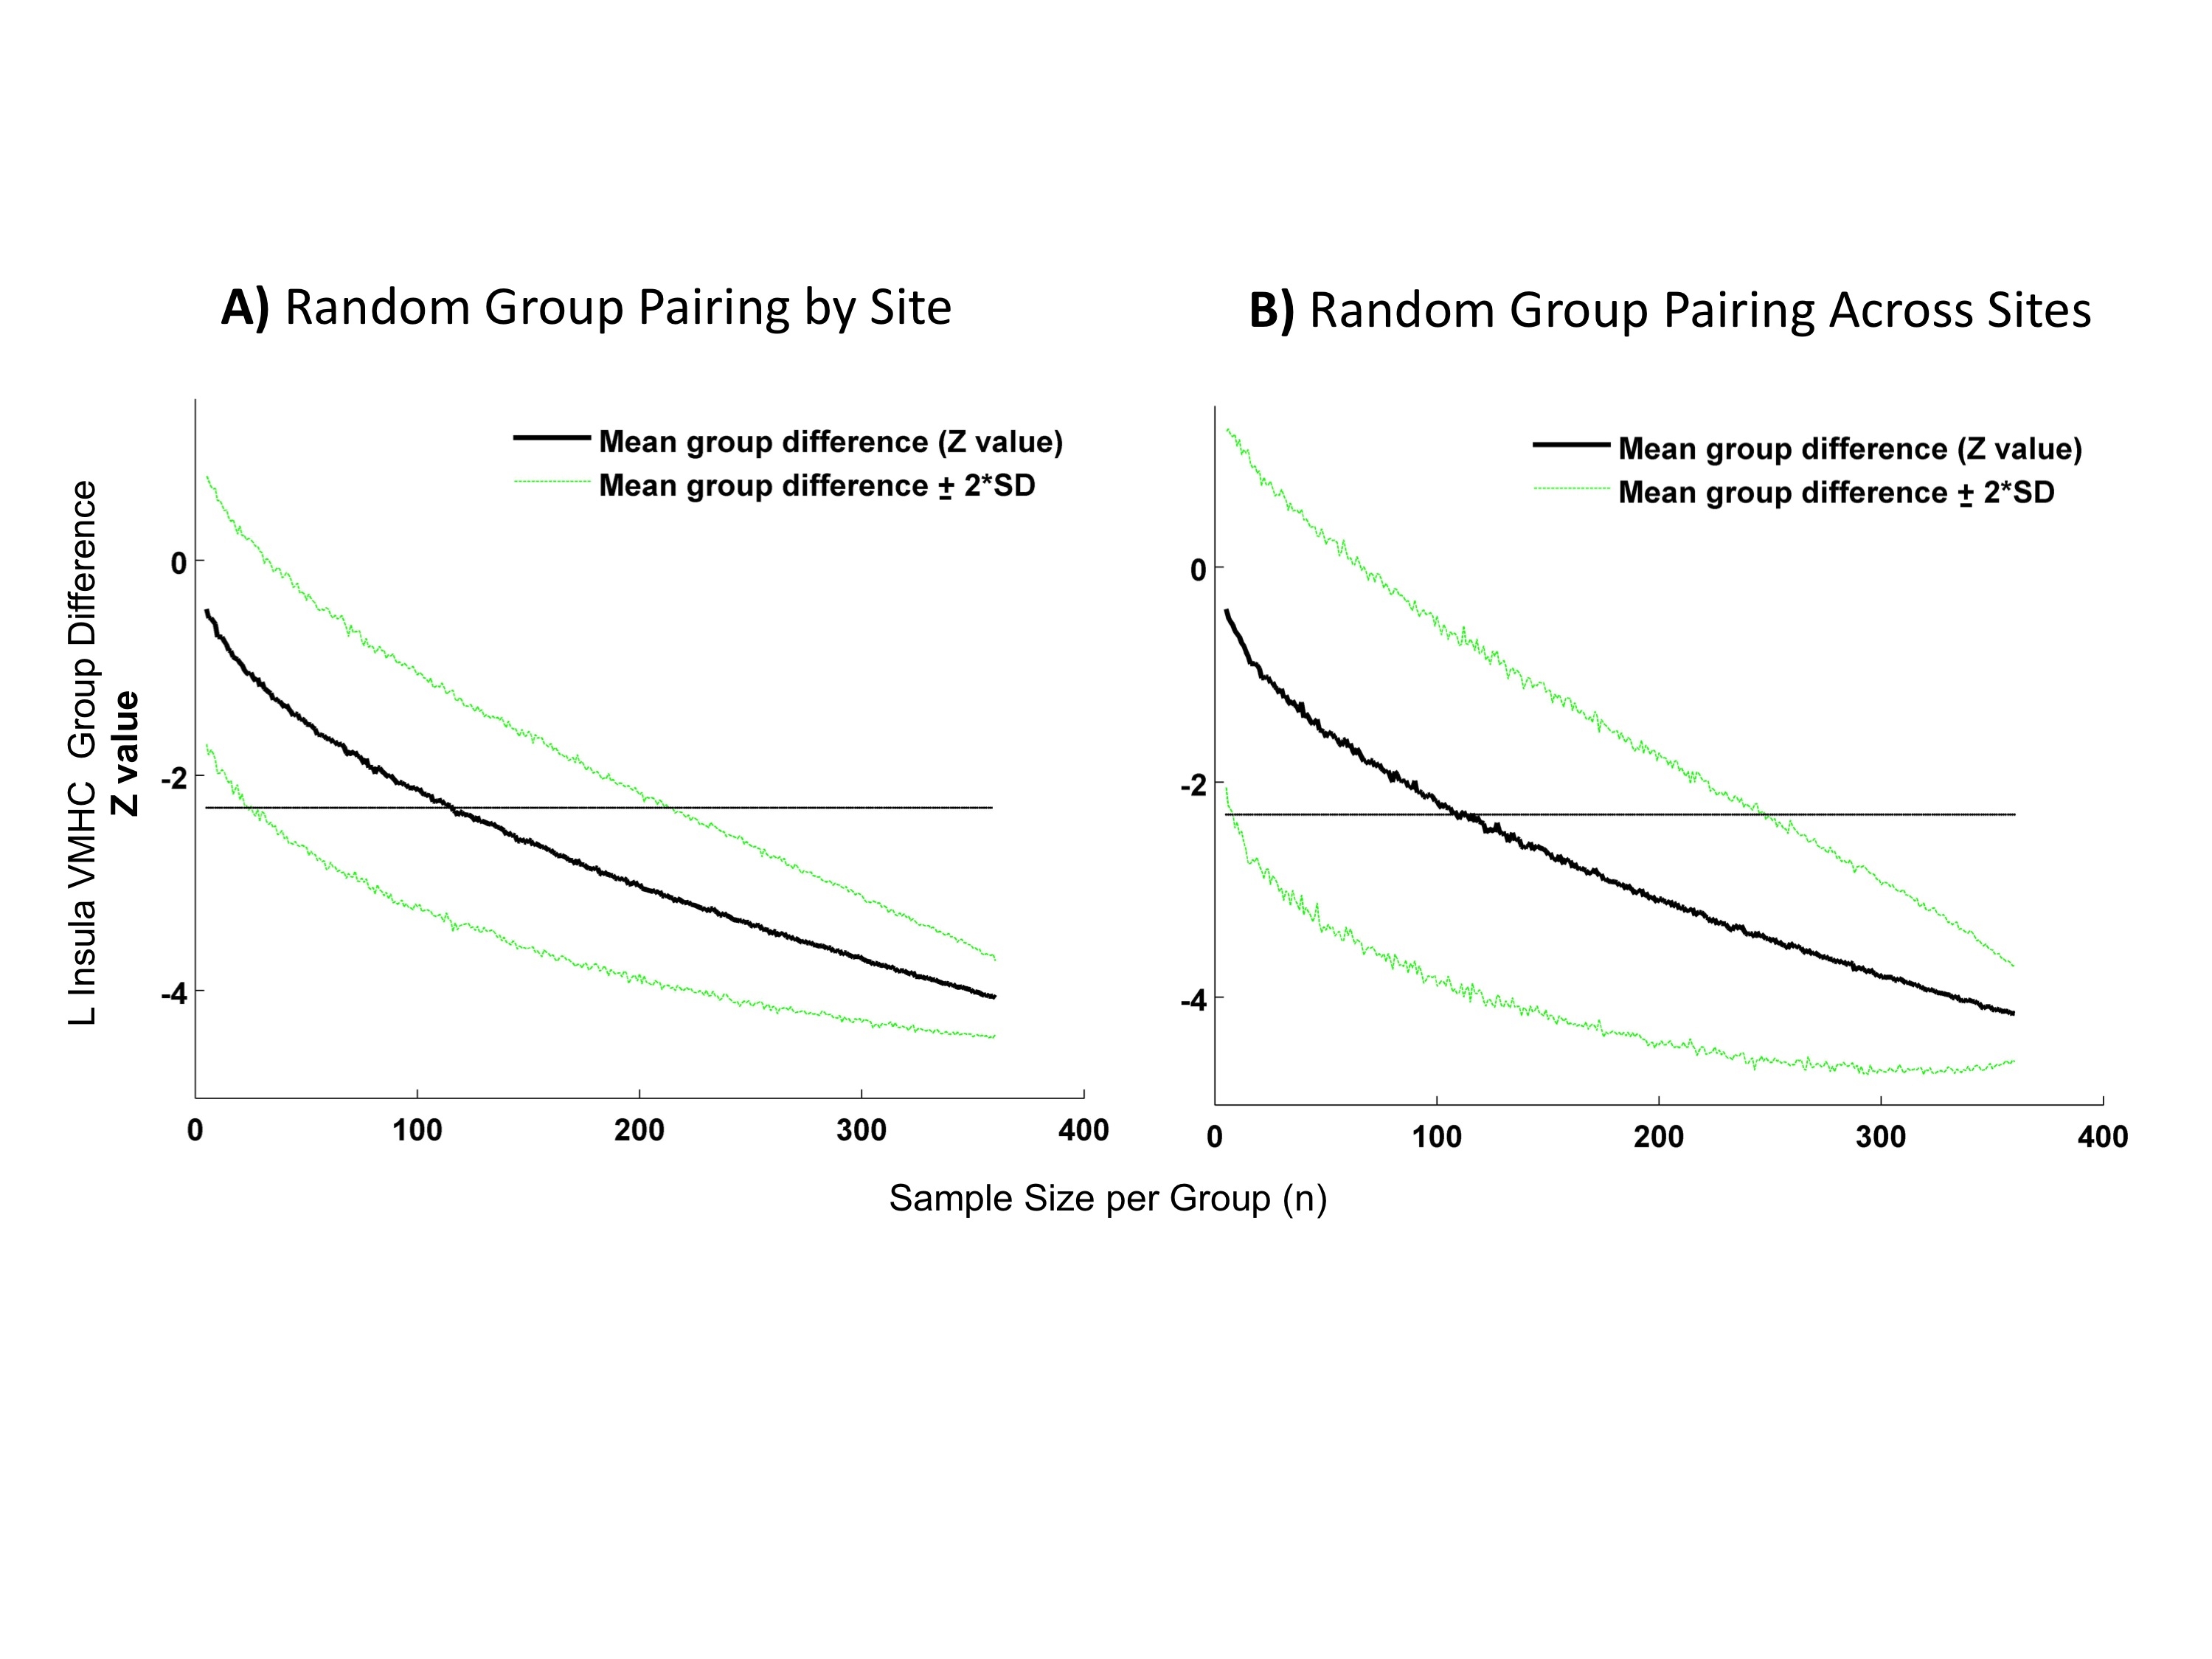
(Autism Spectrum Disorders [ASD] and Typical Controls [TC]) differences for voxel mirrored homotopic connectivity (VMHC) of the left insula cluster identified based on convergent abnormalities across three regional measures in primary analyses (see Figure 4). Shown in both plots is the Z value of the group differences ± 2 standard deviations (SD) computed with 1000 permutations as a function of sample size (increasing by 1 from 5 to 360 individuals per group). A dashed line is set at Z= −2.3. In panel A) each between-group calculation was conducted by randomly pairing ASD and TC selected within each site. In panel B) each between-group calculation was conducted by randomly pairing ASD and TC selected regardless of their site of provenance.
Maps of the voxel-wise statistical significance (indexed as a negative base 10 logarithm) of the Lilliefors normality test conducted on the 763 functional datasets included in analyses for the regional measures: examined in the study. These included fractional amplitude of low frequency fluctuations (fALFF), regional homogeneity (ReHo), voxel-mirrored homotopic connectivity (VMHC), degree centrality (DC), and intrinsic functional connectivity of the posterior cingulate (PCC) and of the anterior medial prefrontal cortex (aMPFC). The Lilliefors normality test was performed on the residuals acquired in the ANCOVA group analysis model, i.e., testing the normality of the error terms. Orange to dark red colors indicate rejection of the null hypothesis (p < 0.05). Statistical maps are overlaid on inflated surface maps generated using BrainNet Viewer (http://www.nitrc.org/projects/bnv/). L= Left hemisphere; R= Right hemisphere.
Z maps of the significant group differences between individuals with Autism Spectrum Disorders (ASD) and Typical Controls (TC) resulting from parametric testing used in primary analyses (ANCOVA; left columns per panel) and from non-parametric testing (FSL’s Randomize program; Right columns per panel). These tests were performed for each of the following regional measures: fractional amplitude of low frequency fluctuations (fALFF), regional homogeneity (ReHo), voxel-mirrored homotopic connectivity (VMHC), degree centrality (DC), and intrinsic functional connectivity (iFC) of the posterior cingulate cortex (PCC) and anterior medial prefrontal cortex (aMPFC). We employed Gaussian random field theory to carry out cluster-level corrections for multiple comparisons (voxel-level Z>2.3; cluster significance: p<0.05, corrected). Significant clusters are overlaid on inflated surface maps generated using BrainNet Viewer (http://www.nitrc.org/projects/bnv/). L= Left hemisphere; R= Right hemisphere.
Figure 5. Seed Based Correlation Analyses: Default Network.
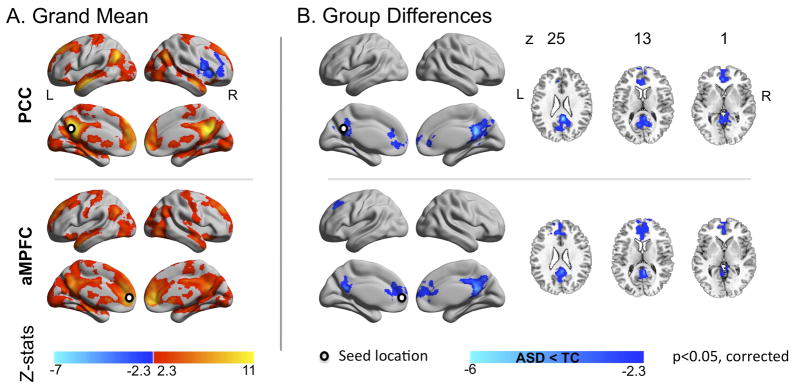
(A) Z maps of the grand means (i.e., across all 763 individuals) and (B) of the group differences between individuals with Autism Spectrum Disorders (ASD) and Typical Controls (TC) for the two midline core seed regions located in Posterior Cingulate Cortex (PCC) and Anterior Medial Prefrontal Cortex (aMPFC). Seeds were centered at Montreal Neurological Institute stereotaxic coordinates x=−8, y=−56, z=26 for PCC and x=−6, y=52, z=−2 for aMPFC, and are depicted as white dots on the surface maps. Gaussian random field theory was used to carry out cluster-level corrections for multiple comparisons (voxel-level Z>2.3; cluster significance: p<0.05, corrected). Significant clusters are overlaid on inflated surface maps generated using BrainNet Viewer (http://www.nitrc.org/projects/bnv/), as well as on axial images generated with REST Slice Viewer (http://www.restfmri.net). L= Left hemisphere; R= Right hemisphere.
Acknowledgments
We would like to thank the numerous contributors at each site (see Supplementary Table 2 and http://fcon_1000.projects.nitrc.org/indi/abide/), particularly Drs. Marlene Behrmann and Leonardo Cerliani for their efforts in the collection, organization and sharing of their datasets; the NITRC team www.nitrc.org team for providing the data sharing platform for the ABIDE initiative as well as the other informatics databases for providing the additional platforms (see http://fcon_1000.projects.nitrc.org/indi/abide). We also thank Ranjit Khanuja, and Sharad Sikka for programming support; Dr. R. Cameron Craddock for invaluable suggestions regarding data analysis, as well as oversight of the development of the Configurable Pipeline for the Analysis of Connectomes, and Drs. Zhen Yang and Clare Kelly for suggestions on earlier versions of this manuscript. Support for ABIDE coordination and data aggregation was partially provided by NIMH (K23MH087770, R03MH096321, and BRAINSRO1MH094639-01), the Leon Levy Foundation, and by gifts from Joseph P. Healy, the Stavros Niarchos Foundation.
Support for data collection at each site was provided by NIH (DC011095, MH084164, K01MH092288-Stanford; HD55748, KO1MH081191, MH67924-Pitt; K08MH092697, P50MH60450, R01NS34783, R01MH080826, T32DC008553-USM; K23MH087770, R01HD065282, R01MH081218, R21MH084126-NYU; MH066496, R21MH079871, U19HD035482-UM1&UM2; R00MH091238, R01MH086654, R01MH096773-OHSU; R01MH081023-SDSU; 1R01HD06528001-UCLA1&UCLA2; K01MH071284-Yale; R01MH080721-Caltech), Autism Speaks (KKI, NYU, Olin, UM1&2, Pitt, USM, Yale), NINDS (R01NS048527; KKI), NICHD (Yale, UCLA1&2, CMU), the Simons Foundation (OHSU, Yale, Caltech, CMU), the Belgian Interuniversity Attraction Poles Grant (P6/29;Leuven1&2), Ben B. and Iris M. Margolis Foundation (USM), European Commission, Marie Curie Excellence Grant (MEXT-CT-2005-023253; SBL), Flanders Fund for Scientific Research (1841313N, G.0354.06, G.0758.10; and postdoc grant; Leuven1&2), Hartford Hospital (Olin), John Merck Scholars Fund (Yale), Kyulan Family Foundation (Trinity), Michigan Institute for Clinical and Health Research (MICHR) Pre-doctoral Fellowship (UM1&2), National Children’s Hospital (AMNCH; Trinity), National Initiative for Brain and Cognition NIHC HCMI (056-13-014, 056-13-017; SBL), NWO (051.07.003, 452-04-305, 400-08-089; SBL) and Netherlands Brain Foundation (KS 2010(1)-29; SBL), NRSA Pre-doctoral Fellowship (F31DC010143; USM), Research Council of the University of Leuven (Leuven1&2), Stanford Institute for Neuro-Innovations & Translational Neurosciences (Stanford), Leon Levy Foundation (NYU), Meath Foundation, Adelaide and Meath Hospital (Trinity), Stavros Niarchos Foundation (NYU), UCLA Autism Center of Excellence (UCLA1&2), and University of Utah Multidisciplinary Research Seed Grant (USM).
Footnotes
Conflict of Interest
Catherine Lord receives royalties from the publication of the Autism Diagnostic Interview–Revised and the Autism Diagnostic Observation Schedule. All other authors declare no conflict of interest.
References
- 1.Centers for Disease Control and Prevention. Prevalence of Autism Spectrum Disorders — Autism and Developmental Disabilities Monitoring Network, 14 Sites, United States, 2008. MMWR Surveill Summ. 2012;61:1–19. [PubMed] [Google Scholar]
- 2.Kim YS, Leventhal BL, Koh YJ, Fombonne E, Laska E, Lim EC, et al. Prevalence of autism spectrum disorders in a total population sample. Am J Psychiatry. 2011;168(9):904–912. doi: 10.1176/appi.ajp.2011.10101532. [DOI] [PubMed] [Google Scholar]
- 3.Lord C, Petkova E, Hus V, Gan W, Lu F, Martin DM, et al. A multisite study of the clinical diagnosis of different autism spectrum disorders. Arch Gen Psychiatry. 2012;69(3):306–313. doi: 10.1001/archgenpsychiatry.2011.148. [DOI] [PMC free article] [PubMed] [Google Scholar]
- 4.Lord C, Risi S, Lambrecht L, Cook EH, Leventhal BL, DiLavore PC, et al. The Autism Diagnostic Observation Schedule-Generic: A standard measure of social and communication deficits associated with the spectrum of autism. Journal of Autism and Developmental Disorders. 2000;30(3):205–223. [PubMed] [Google Scholar]
- 5.Geschwind DH, Sowinski J, Lord C, Iversen P, Shestack J, Jones P, et al. The autism genetic resource exchange: a resource for the study of autism and related neuropsychiatric conditions. Am J Hum Genet. 2001;69(2):463–466. doi: 10.1086/321292. [DOI] [PMC free article] [PubMed] [Google Scholar]
- 6.Moreno-De-Luca D, Sanders SJ, Willsey AJ, Mulle JG, Lowe JK, Geschwind DH, et al. Using large clinical data sets to infer pathogenicity for rare copy number variants in autism cohorts. Mol Psychiatry. 2012 doi: 10.1038/mp.2012.138. Epub ahead of print. [DOI] [PMC free article] [PubMed] [Google Scholar]
- 7.Fischbach GD, Lord C. The Simons Simplex Collection: a resource for identification of autism genetic risk factors. Neuron. 2010;68(2):192–195. doi: 10.1016/j.neuron.2010.10.006. [DOI] [PubMed] [Google Scholar]
- 8.Szatmari P, Paterson AD, Zwaigenbaum L, Roberts W, Brian J, Liu XQ, et al. Mapping autism risk loci using genetic linkage and chromosomal rearrangements. Nature Genetics. 2007;39(3):319–328. doi: 10.1038/ng1985. [DOI] [PMC free article] [PubMed] [Google Scholar]
- 9.Minshew NJ, Williams DL. The new neurobiology of autism: cortex, connectivity, and neuronal organization. Archives of Neurology. 2007;64(7):945–950. doi: 10.1001/archneur.64.7.945. [DOI] [PMC free article] [PubMed] [Google Scholar]
- 10.Just MA, Cherkassky VL, Keller TA, Minshew NJ. Cortical activation and synchronization during sentence comprehension in high-functioning autism: evidence of underconnectivity. Brain. 2004;127(Pt 8):1811–1821. doi: 10.1093/brain/awh199. [DOI] [PubMed] [Google Scholar]
- 11.Vissers ME, Cohen MX, Geurts HM. Brain connectivity and high functioning autism: a promising path of research that needs refined models, methodological convergence, and stronger behavioral links. Neurosci Biobehav Rev. 2012;36(1):604–625. doi: 10.1016/j.neubiorev.2011.09.003. [DOI] [PubMed] [Google Scholar]
- 12.Shehzad Z, Kelly AM, Reiss PT, Gee DG, Gotimer K, Uddin LQ, et al. The resting brain: unconstrained yet reliable. Cereb Cortex. 2009;19(10):2209–2229. doi: 10.1093/cercor/bhn256. [DOI] [PMC free article] [PubMed] [Google Scholar]
- 13.Van Dijk KR, Hedden T, Venkataraman A, Evans KC, Lazar SW, Buckner RL. Intrinsic functional connectivity as a tool for human connectomics: theory, properties, and optimization. J Neurophysiol. 2010;103(1):297–321. doi: 10.1152/jn.00783.2009. [DOI] [PMC free article] [PubMed] [Google Scholar]
- 14.Kelly C, Biswal BB, Craddock RC, Castellanos FX, Milham MP. Characterizing variation in the functional connectome: promise and pitfalls. Trends Cogn Sci. 2012;16(3):181–188. doi: 10.1016/j.tics.2012.02.001. [DOI] [PMC free article] [PubMed] [Google Scholar]
- 15.Biswal BB, Mennes M, Zuo XN, Gohel S, Kelly C, Smith SM, et al. Toward discovery science of human brain function. Proc Natl Acad Sci U S A. 2010;107(10):4734–4739. doi: 10.1073/pnas.0911855107. [DOI] [PMC free article] [PubMed] [Google Scholar]
- 16.Mennes M, Biswal B, Castellanos FX, Milham MP. Making data sharing work: The FCP/INDI experience. Neuroimage. 2012 doi: 10.1016/j.neuroimage.2012.10.064. Epub ahead of print. [DOI] [PMC free article] [PubMed] [Google Scholar]
- 17.ADHD-200 Consortium. The ADHD-200 Consortium: a model to advance the translational potential of neuroimaging in clinical neuroscience. Front Syst Neurosci. 2012;6(62) doi: 10.3389/fnsys.2012.00062. [DOI] [PMC free article] [PubMed] [Google Scholar]
- 18.Fair DA, Nigg JT, Iyer S, Bathula D, Mills KL, Dosenbach NU, et al. Distinct neural signatures detected for ADHD subtypes after controlling for micro-movements in resting state functional connectivity MRI data. Front Syst Neurosci. 2012;6:80. doi: 10.3389/fnsys.2012.00080. [DOI] [PMC free article] [PubMed] [Google Scholar]
- 19.Tomasi D, Volkow ND. Abnormal functional connectivity in children with attention-deficit/hyperactivity disorder. Biol Psychiatry. 2012;71(5):443–450. doi: 10.1016/j.biopsych.2011.11.003. [DOI] [PMC free article] [PubMed] [Google Scholar]
- 20.Muller RA, Shih P, Keehn B, Deyoe JR, Leyden KM, Shukla DK. Underconnected, but how? A survey of functional connectivity MRI studies in autism spectrum disorders. Cereb Cortex. 2011;21(10):2233–2243. doi: 10.1093/cercor/bhq296. [DOI] [PMC free article] [PubMed] [Google Scholar]
- 21.Gotts SJ, Simmons WK, Milbury LA, Wallace GL, Cox RW, Martin A. Fractionation of social brain circuits in autism spectrum disorders. Brain. 2012;135(Pt 9):2711–2725. doi: 10.1093/brain/aws160. [DOI] [PMC free article] [PubMed] [Google Scholar]
- 22.Kennedy DP, Redcay E, Courchesne E. Failing to deactivate: resting functional abnormalities in autism. ProcNatlAcadSciUSA. 2006;103(21):8275–8280. doi: 10.1073/pnas.0600674103. [DOI] [PMC free article] [PubMed] [Google Scholar]
- 23.Assaf M, Jagannathan K, Calhoun VD, Miller L, Stevens MC, Sahl R, et al. Abnormal functional connectivity of default mode sub-networks in autism spectrum disorder patients. Neuroimage. 2010;53(1):247–256. doi: 10.1016/j.neuroimage.2010.05.067. [DOI] [PMC free article] [PubMed] [Google Scholar]
- 24.Monk CS, Peltier SJ, Wiggins JL, Weng SJ, Carrasco M, Risi S, et al. Abnormalities of intrinsic functional connectivity in autism spectrum disorders. Neuroimage. 2009;47(2):764–772. doi: 10.1016/j.neuroimage.2009.04.069. [DOI] [PMC free article] [PubMed] [Google Scholar]
- 25.Rudie JD, Shehzad Z, Hernandez LM, Colich NL, Bookheimer SY, Iacoboni M, et al. Reduced functional integration and segregation of distributed neural systems underlying social and emotional information processing in autism spectrum disorders. Cereb Cortex. 2012;22(5):1025–1037. doi: 10.1093/cercor/bhr171. [DOI] [PMC free article] [PubMed] [Google Scholar]
- 26.Andrews-Hanna JR, Reidler JS, Sepulcre J, Poulin R, Buckner RL. Functional-anatomic fractionation of the brain’s default network. Neuron. 2010;65(4):550–562. doi: 10.1016/j.neuron.2010.02.005. [DOI] [PMC free article] [PubMed] [Google Scholar]
- 27.Paakki JJ, Rahko J, Long X, Moilanen I, Tervonen O, Nikkinen J, et al. Alterations in regional homogeneity of resting-state brain activity in autism spectrum disorders. Brain Res. 2010;1321:169–179. doi: 10.1016/j.brainres.2009.12.081. [DOI] [PubMed] [Google Scholar]
- 28.Dinstein I, Pierce K, Eyler L, Solso S, Malach R, Behrmann M, et al. Disrupted neural synchronization in toddlers with autism. Neuron. 2011;70(6):1218–1225. doi: 10.1016/j.neuron.2011.04.018. [DOI] [PMC free article] [PubMed] [Google Scholar]
- 29.Anderson JS, Druzgal TJ, Froehlich A, DuBray MB, Lange N, Alexander AL, et al. Decreased interhemispheric functional connectivity in autism. Cereb Cortex. 2011;21(5):1134–1146. doi: 10.1093/cercor/bhq190. [DOI] [PMC free article] [PubMed] [Google Scholar]
- 30.Zuo XN, Ehmke R, Mennes M, Imperati D, Castellanos FX, Sporns O, et al. Network centrality in the human functional connectome. Cereb Cortex. 2012;22(8):1862–1875. doi: 10.1093/cercor/bhr269. [DOI] [PubMed] [Google Scholar]
- 31.Buckner RL, Sepulcre J, Talukdar T, Krienen FM, Liu H, Hedden T, et al. Cortical hubs revealed by intrinsic functional connectivity: mapping, assessment of stability, and relation to Alzheimer’s disease. J Neurosci. 2009;29(6):1860–1873. doi: 10.1523/JNEUROSCI.5062-08.2009. [DOI] [PMC free article] [PubMed] [Google Scholar]
- 32.Zuo XN, Di Martino A, Kelly C, Shehzad ZE, Gee DG, Klein DF, et al. The oscillating brain: complex and reliable. Neuroimage. 2010;49(2):1432–1445. doi: 10.1016/j.neuroimage.2009.09.037. [DOI] [PMC free article] [PubMed] [Google Scholar]
- 33.Power JD, Barnes KA, Snyder AZ, Schlaggar BL, Petersen SE. Spurious but systematic correlations in functional connectivity MRI networks arise from subject motion. Neuroimage. 2012;59(3):2142–2154. doi: 10.1016/j.neuroimage.2011.10.018. [DOI] [PMC free article] [PubMed] [Google Scholar]
- 34.Kennedy DN, Lange N, Makris N, Bates J, Meyer J, Caviness VS., Jr Gyri of the human neocortex: an MRI-based analysis of volume and variance. Cereb Cortex. 1998;8(4):372–384. doi: 10.1093/cercor/8.4.372. [DOI] [PubMed] [Google Scholar]
- 35.Craddock RC, James GA, Holtzheimer PE, 3rd, Hu XP, Mayberg HS. A whole brain fMRI atlas generated via spatially constrained spectral clustering. Hum Brain Mapp. 2012;33(8):1914–1928. doi: 10.1002/hbm.21333. [DOI] [PMC free article] [PubMed] [Google Scholar]
- 36.Zang Y, Jiang T, Lu Y, He Y, Tian L. Regional homogeneity approach to fMRI data analysis. Neuroimage. 2004;22(1):394–400. doi: 10.1016/j.neuroimage.2003.12.030. [DOI] [PubMed] [Google Scholar]
- 37.Zuo XN, Kelly C, Di Martino A, Mennes M, Margulies DS, Bangaru S, et al. Growing together and growing apart: regional and sex differences in the lifespan developmental trajectories of functional homotopy. J Neurosci. 2010;30(45):15034–15043. doi: 10.1523/JNEUROSCI.2612-10.2010. [DOI] [PMC free article] [PubMed] [Google Scholar]
- 38.Bullmore E, Sporns O. Complex brain networks: graph theoretical analysis of structural and functional systems. Nat Rev Neurosci. 2009;10(3):186–198. doi: 10.1038/nrn2575. [DOI] [PubMed] [Google Scholar]
- 39.Behzadi Y, Restom K, Liau J, Liu TT. A component based noise correction method (CompCor) for BOLD and perfusion based fMRI. Neuroimage. 2007;37(1):90–101. doi: 10.1016/j.neuroimage.2007.04.042. [DOI] [PMC free article] [PubMed] [Google Scholar]
- 40.Mesulam MM. From sensation to cognition. Brain. 1998;121( Pt 6):1013–1052. doi: 10.1093/brain/121.6.1013. [DOI] [PubMed] [Google Scholar]
- 41.Stark DE, Margulies DS, Shehzad ZE, Reiss P, Kelly AM, Uddin LQ, et al. Regional variation in interhemispheric coordination of intrinsic hemodynamic fluctuations. The Journal of Neuroscience. 2008;28(51):13754–13764. doi: 10.1523/JNEUROSCI.4544-08.2008. [DOI] [PMC free article] [PubMed] [Google Scholar]
- 42.Cherkassky VL, Kana RK, Keller TA, Just MA. Functional connectivity in a baseline resting-state network in autism. Neuroreport. 2006;17(16):1687–1690. doi: 10.1097/01.wnr.0000239956.45448.4c. [DOI] [PubMed] [Google Scholar]
- 43.Weng SJ, Wiggins JL, Peltier SJ, Carrasco M, Risi S, Lord C, et al. Alterations of resting state functional connectivity in the default network in adolescents with autism spectrum disorders. Brain Res. 2010;1313:202–214. doi: 10.1016/j.brainres.2009.11.057. [DOI] [PMC free article] [PubMed] [Google Scholar]
- 44.Jones TB, Bandettini PA, Kenworthy L, Case LK, Milleville SC, Martin A, et al. Sources of group differences in functional connectivity: an investigation applied to autism spectrum disorder. Neuroimage. 2010;49(1):401–414. doi: 10.1016/j.neuroimage.2009.07.051. [DOI] [PMC free article] [PubMed] [Google Scholar]
- 45.Yan C, ZY DPARSF: A MATLAB Toolbox for “Pipeline” Data Analysis of Resting-State fMRI. Front Syst Neurosci. 2010;4:13. doi: 10.3389/fnsys.2010.00013. [DOI] [PMC free article] [PubMed] [Google Scholar]
- 46.Genovese CR, Lazar NA, Nichols T. Thresholding of statistical maps in functional neuroimaging using the false discovery rate. Neuroimage. 2002;15(4):870–878. doi: 10.1006/nimg.2001.1037. [DOI] [PubMed] [Google Scholar]
- 47.Van Dijk KR, Sabuncu MR, Buckner RL. The influence of head motion on intrinsic functional connectivity MRI. Neuroimage. 2012;59(1):431–438. doi: 10.1016/j.neuroimage.2011.07.044. [DOI] [PMC free article] [PubMed] [Google Scholar]
- 48.Satterthwaite TD, Wolf DH, Loughead J, Ruparel K, Elliott MA, Hakonarson H, et al. Impact of in-scanner head motion on multiple measures of functional connectivity: Relevance for studies of neurodevelopment in youth. Neuroimage. 2012;60(1):623–632. doi: 10.1016/j.neuroimage.2011.12.063. [DOI] [PMC free article] [PubMed] [Google Scholar]
- 49.Yan C, Cheung B, Kelly C, Colcombe S, Craddock C, Di Martino A, et al. Comprehensive Assessment of Regional Variation in the Impact of Head Micromovements on Functional Connectomics. Neuroimage. 2013 doi: 10.1016/j.neuroimage.2013.03.004. Epub ahead of print. [DOI] [PMC free article] [PubMed] [Google Scholar]
- 50.Gotham K, Pickles A, Lord C. Standardizing ADOS scores for a measure of severity in autism spectrum disorders. J Autism Dev Disord. 2009;39(5):693–705. doi: 10.1007/s10803-008-0674-3. [DOI] [PMC free article] [PubMed] [Google Scholar]
- 51.Just MA, Keller TA, Malave VL, Kana RK, Varma S. Autism as a neural systems disorder: a theory of frontal-posterior underconnectivity. Neurosci Biobehav Rev. 2012;36(4):1292–1313. doi: 10.1016/j.neubiorev.2012.02.007. [DOI] [PMC free article] [PubMed] [Google Scholar]
- 52.Di Martino A, Kelly C, Grzadzinski R, Zuo XN, Mennes M, Mairena MA, et al. Aberrant striatal functional connectivity in children with autism. Biol Psychiatry. 2011;69(9):847–856. doi: 10.1016/j.biopsych.2010.10.029. [DOI] [PMC free article] [PubMed] [Google Scholar]
- 53.Schultz RT, Gauthier I, Klin A, Fulbright RK, Anderson AW, Volkmar F, et al. Abnormal ventral temporal cortical activity during face discrimination among individuals with autism and Asperger syndrome. Archives of General Psychiatry. 2000;57(4):331–340. doi: 10.1001/archpsyc.57.4.331. [DOI] [PubMed] [Google Scholar]
- 54.Kaiser MD, Hudac CM, Shultz S, Lee SM, Cheung C, Berken AM, et al. Neural signatures of autism. Proc Natl Acad Sci U S A. 2010;107(49):21223–21228. doi: 10.1073/pnas.1010412107. [DOI] [PMC free article] [PubMed] [Google Scholar]
- 55.Lewis JD, Theilmann RJ, Fonov V, Bellec P, Lincoln A, Evans AC, et al. Callosal fiber length and interhemispheric connectivity in adults with autism: Brain overgrowth and underconnectivity. Hum Brain Mapp. 2012 doi: 10.1002/hbm.22018. Epub ahead of print. [DOI] [PMC free article] [PubMed] [Google Scholar]
- 56.Hardan AY, Pabalan M, Gupta N, Bansal R, Melhem NM, Fedorov S, et al. Corpus callosum volume in children with autism. Psychiatry Research. 2009;174(1):57–61. doi: 10.1016/j.pscychresns.2009.03.005. [DOI] [PMC free article] [PubMed] [Google Scholar]
- 57.Piven J, Bailey J, Ranson BJ, Arndt S. An MRI study of the corpus callosum in autism. Am J Psychiatry. 1997;154(8):1051–1056. doi: 10.1176/ajp.154.8.1051. [DOI] [PubMed] [Google Scholar]
- 58.Cheon KA, Kim YS, Oh SH, Park SY, Yoon HW, Herrington J, et al. Involvement of the anterior thalamic radiation in boys with high functioning autism spectrum disorders: a Diffusion Tensor Imaging study. Brain Res. 2011;1417:77–86. doi: 10.1016/j.brainres.2011.08.020. [DOI] [PubMed] [Google Scholar]
- 59.Shukla DK, Keehn B, Lincoln AJ, Muller RA. White matter compromise of callosal and subcortical fiber tracts in children with autism spectrum disorder: a diffusion tensor imaging study. J Am Acad Child Adolesc Psychiatry. 2010;49(12):1269–1278. 1278 e1261–1262. doi: 10.1016/j.jaac.2010.08.018. [DOI] [PMC free article] [PubMed] [Google Scholar]
- 60.Hong S, Ke X, Tang T, Hang Y, Chu K, Huang H, et al. Detecting abnormalities of corpus callosum connectivity in autism using magnetic resonance imaging and diffusion tensor tractography. Psychiatry Res. 2011;194(3):333–339. doi: 10.1016/j.pscychresns.2011.03.009. [DOI] [PubMed] [Google Scholar]
- 61.Alexander AL, Lee JE, Lazar M, Boudos R, Dubray MB, Oakes TR, et al. Diffusion tensor imaging of the corpus callosum in Autism. Neuroimage. 2007;34(1):61–73. doi: 10.1016/j.neuroimage.2006.08.032. [DOI] [PubMed] [Google Scholar]
- 62.Banich MT. The missing link: the role of interhemispheric interaction in attentional processing. Brain Cogn. 1998;36(2):128–157. doi: 10.1006/brcg.1997.0950. [DOI] [PubMed] [Google Scholar]
- 63.Minshew NJ, Goldstein G, Siegel DJ. Neuropsychologic functioning in autism: profile of a complex information processing disorder. Journal of the International Neuropsychological Society. 1997;3(4):303–316. [PubMed] [Google Scholar]
- 64.Uddin LQ, Menon V. The anterior insula in autism: under-connected and under-examined. Neuroscience and Biobehavioral Reviews. 2009;33(8):1198–1203. doi: 10.1016/j.neubiorev.2009.06.002. [DOI] [PMC free article] [PubMed] [Google Scholar]
- 65.Ebisch SJ, Gallese V, Willems RM, Mantini D, Groen WB, Romani GL, et al. Altered intrinsic functional connectivity of anterior and posterior insula regions in high-functioning participants with autism spectrum disorder. Hum Brain Mapp. 2011;32(7):1013–1028. doi: 10.1002/hbm.21085. [DOI] [PMC free article] [PubMed] [Google Scholar]
- 66.Di Martino A, Shehzad Z, Kelly C, Roy AK, Gee DG, Uddin LQ, et al. Relationship between cingulo-insular functional connectivity and autistic traits in neurotypical adults. Am J Psychiatry. 2009;166(8):891–899. doi: 10.1176/appi.ajp.2009.08121894. [DOI] [PMC free article] [PubMed] [Google Scholar]
- 67.Kennedy DP, Courchesne E. Functional abnormalities of the default network during self- and other-reflection in autism. SocCogn AffectNeurosci. 2008;3(2):177–190. doi: 10.1093/scan/nsn011. [DOI] [PMC free article] [PubMed] [Google Scholar]
- 68.Kennedy DP, Courchesne E. The intrinsic functional organization of the brain is altered in autism. Neuroimage. 2008;39:1877–1885. doi: 10.1016/j.neuroimage.2007.10.052. [DOI] [PubMed] [Google Scholar]
- 69.Di Martino A, Ross K, Uddin LQ, Sklar AB, Castellanos FX, Milham MP. Functional brain correlates of social and nonsocial processes in autism spectrum disorders: an activation likelihood estimation meta-analysis. Biological Psychiatry. 2009;65(1):63–74. doi: 10.1016/j.biopsych.2008.09.022. [DOI] [PMC free article] [PubMed] [Google Scholar]
- 70.Mizuno A, Villalobos ME, Davies MM, Dahl BC, Muller RA. Partially enhanced thalamocortical functional connectivity in autism. Brain Res. 2006;1104(1):160–174. doi: 10.1016/j.brainres.2006.05.064. [DOI] [PubMed] [Google Scholar]
- 71.Lai MC, Lombardo MV, Chakrabarti B, Sadek SA, Pasco G, Wheelwright SJ, et al. A shift to randomness of brain oscillations in people with autism. Biol Psychiatry. 2010;68(12):1092–1099. doi: 10.1016/j.biopsych.2010.06.027. [DOI] [PubMed] [Google Scholar]
- 72.Dinstein I, Heeger DJ, Lorenzi L, Minshew NJ, Malach R, Behrmann M. Unreliable evoked responses in autism. Neuron. 2012;75(6):981–991. doi: 10.1016/j.neuron.2012.07.026. [DOI] [PMC free article] [PubMed] [Google Scholar]
- 73.Supekar K, Musen M, Menon V. Development of large-scale functional brain networks in children. PLoS Biology. 2009;7(7):e1000157. doi: 10.1371/journal.pbio.1000157. [DOI] [PMC free article] [PubMed] [Google Scholar]
- 74.Redcay E, Courchesne E. Deviant functional magnetic resonance imaging patterns of brain activity to speech in 2–3-year-old children with autism spectrum disorder. Biological Psychiatry. 2008;64(7):589–598. doi: 10.1016/j.biopsych.2008.05.020. [DOI] [PMC free article] [PubMed] [Google Scholar]
- 75.Hall D, Huerta MF, McAuliffe MJ, Farber GK. Sharing heterogeneous data: the national database for autism research. Neuroinformatics. 2012;10(4):331–339. doi: 10.1007/s12021-012-9151-4. [DOI] [PMC free article] [PubMed] [Google Scholar]
Associated Data
This section collects any data citations, data availability statements, or supplementary materials included in this article.
Supplementary Materials
(A) Mean framewise displacement and (B) percentage of scans with framewise displacement > .2mm are plotted for each subject’s functional dataset at each site (labeled alphabetically, see Supplementary Table 2 for label key) for the data of individuals with autism spectrum disorder (ASD; violet right side plots) and typical control (TC; green left side plots). The red dashed line in panel A represents the cutoff used for inclusion in neuroimaging analyses (=0.8 mm which corresponds to two standard deviations above the mean of the whole sample). The dashed line in panel B represents the cutoff (50%) for inclusion in secondary analyses conducted on scrubbed data (only sites with a minimum of 6 datasets per group with at least 50% frames < .2 mm were included in these analyses). Of note, 1111 functional data are plotted here as one functional dataset with four time points (site f) was discarded from any analyses. It is important to note that the ABIDE consortium, after substantial consideration, decided that data should be shared regardless of movement artifacts. As highlighted by Milham (2012)2, this decision was motivated by the lack of consensus regarding data quality standards, and potential differences in quality requirements based on individual user’s needs. Additionally, poor quality data may be useful for efforts to develop algorithms capable of correcting movement artifacts, and may one day prove useful for data analysis if more effective correction approaches emerge. As Supplementary Figure 1 shows, most shared data had limited micromovements. With regard to variations among sites, some sites only shared data that had been quality-controlled. To make users aware of such variations, we draw their attention to the ABIDE website (http://fcon_1000.projects.nitrc.org/indi/abide/), which states whether quality control was applied to select data to be shared, and provides information on the protocols utilized to prepare participants for scan sessions at each site.
The Tukey box-whiskers plots depict the distribution of total intracranial volume, total gray matter and total white matter, and cerebrospinal fluid (CSF) volumes for the datasets of individuals with autism spectrum disorder (ASD, violet) and typical controls (TC, green). For illustration purposes, we plotted fitted values by regressing out the covariates used for ANCOVAs group comparisons (i.e., age, FIQ, mean frame wise displacement, and site). The results of ANCOVA group comparisons showed that the two groups did not significantly differ in regard to these global measures. See Supplementary Information for details on volumetric analyses.
Whole-brain analyses were repeated using individual data censored for frames with movement >0.2mm (‘scrubbing’): only sites with at least six subjects per group remaining with at least 50% frames retained were included (184 with Autism Spectrum Disorders [ASD] and 253 Typical Controls [TC]). The glass brains display the pattern of significant group differences (i.e., ASD vs. TC) for iFC between each of the 112 parcellation units (56 per hemisphere) included in the structural Harvard-Oxford Atlas (HOA). Parcellations are represented with their centers of mass overlaid as spheres on glass brains. The upper panel shows the intrinsic functional connections (blue lines) that were significantly weaker in ASD vs. TC. The lower panel shows the intrinsic functional connections that were significantly stronger in ASD relative to TC (red lines). Each HOA unit is colored based on its membership in the six functional divisions per Mesulam et al.44 [yellow=primary sensorimotor (SM); green=unimodal association; blue=heteromodal association; orange=paralimbic; red=limbic; pink=subcortical]. Interhemispheric iFC is noted on dorsal and coronal views. Glass brains (left lateral, dorsal, and coronal views, shown from left to right) were generated using BrainNet Viewer (http://www.nitrc.org/projects/bnv/). Displayed results are corrected for multiple comparisons using false discovery rate (FDR) at p<0.05.
We repeated analyses on regional measures of intrinsic functional architecture as well as seed-based correlation of the core midline seeds of the default network (DN) with individual data censoring frames with movement >0.2mm (‘scrubbing’). Only datasets from sites remaining with at least six subjects per each diagnostic group (Autism Spectrum Disorders [ASD] and Typical Controls [TC]) presenting with at least 50% frames retained were included (184 with ASD and 253 TC). (A) Z maps of the grand means (i.e., across all 437 scrubbed individual data) and (B) significant group differences between individuals with ASD and TC for regional homogeneity (ReHo), voxel-mirrored homotopic connectivity (VMHC), degree centrality (DC), as well as seed-based correlation of posterior cingulate cortex (PCC) and anterior medial prefrontal cortex (aMPFC). Seeds were centered at Montreal Neurological Institute stereotaxic coordinates x=−8, y=−56, z=26 for PCC and x=−6, y=52, z=−2 for aMPFC, and are depicted as white dots on the surface maps. Fractional amplitude of low frequency fluctuations (fALFF) was not calculated with ‘scrubbed’ data as the removal of time points disrupts the temporal structure and thus limits standard Fourier transform-based approaches.14 We employed Gaussian random field theory to carry out cluster-level corrections for multiple comparisons (Z> 2.3, p<.05). Significant clusters are overlaid on inflated surface maps generated using BrainNet Viewer (http://www.nitrc.org/projects/bnv/), as well as on axial images generated with REST Slice Viewer (http://www.restfmri.net). L= Left hemisphere; R= Right hemisphere
Supplementary Figure 5 Site-related variation in group differences for the voxel mirrored homotopic connectivity (VMHC) of the left insula cluster identified based on convergent abnormalities across three regional measures in primary analyses (See Figure 4). Age, FIQ, and mean framewise displacement were regressed out from VMHC across subjects, thus the group means (± SEM) represent adjusted VMHC Z values. See Supplementary Information.
(Autism Spectrum Disorders [ASD] and Typical Controls [TC]) differences for voxel mirrored homotopic connectivity (VMHC) of the left insula cluster identified based on convergent abnormalities across three regional measures in primary analyses (see Figure 4). Shown in both plots is the Z value of the group differences ± 2 standard deviations (SD) computed with 1000 permutations as a function of sample size (increasing by 1 from 5 to 360 individuals per group). A dashed line is set at Z= −2.3. In panel A) each between-group calculation was conducted by randomly pairing ASD and TC selected within each site. In panel B) each between-group calculation was conducted by randomly pairing ASD and TC selected regardless of their site of provenance.
Maps of the voxel-wise statistical significance (indexed as a negative base 10 logarithm) of the Lilliefors normality test conducted on the 763 functional datasets included in analyses for the regional measures: examined in the study. These included fractional amplitude of low frequency fluctuations (fALFF), regional homogeneity (ReHo), voxel-mirrored homotopic connectivity (VMHC), degree centrality (DC), and intrinsic functional connectivity of the posterior cingulate (PCC) and of the anterior medial prefrontal cortex (aMPFC). The Lilliefors normality test was performed on the residuals acquired in the ANCOVA group analysis model, i.e., testing the normality of the error terms. Orange to dark red colors indicate rejection of the null hypothesis (p < 0.05). Statistical maps are overlaid on inflated surface maps generated using BrainNet Viewer (http://www.nitrc.org/projects/bnv/). L= Left hemisphere; R= Right hemisphere.
Z maps of the significant group differences between individuals with Autism Spectrum Disorders (ASD) and Typical Controls (TC) resulting from parametric testing used in primary analyses (ANCOVA; left columns per panel) and from non-parametric testing (FSL’s Randomize program; Right columns per panel). These tests were performed for each of the following regional measures: fractional amplitude of low frequency fluctuations (fALFF), regional homogeneity (ReHo), voxel-mirrored homotopic connectivity (VMHC), degree centrality (DC), and intrinsic functional connectivity (iFC) of the posterior cingulate cortex (PCC) and anterior medial prefrontal cortex (aMPFC). We employed Gaussian random field theory to carry out cluster-level corrections for multiple comparisons (voxel-level Z>2.3; cluster significance: p<0.05, corrected). Significant clusters are overlaid on inflated surface maps generated using BrainNet Viewer (http://www.nitrc.org/projects/bnv/). L= Left hemisphere; R= Right hemisphere.