Abstract
Applications of molecular imaging in cancer and other diseases frequently require combining in vivo imaging modalities, such as magnetic resonance and optical imaging, with ex vivo optical, fluorescence, histology, and immunohistochemical (IHC) imaging, to investigate and relate molecular and biological processes to imaging parameters within the same region of interest. We have developed a multimodal image reconstruction and fusion framework that accurately combines in vivo magnetic resonance imaging (MRI) and magnetic resonance spectroscopic imaging (MRSI), ex vivo brightfield and fluorescence microscopic imaging, and ex vivo histology imaging. Ex vivo brightfield microscopic imaging was used as an intermediate modality to facilitate the ultimate link between ex vivo histology and in vivo MRI/MRSI. Tissue sectioning necessary for optical and histology imaging required generation of a three-dimensional (3D) reconstruction module for 2D ex vivo optical and histology imaging data. We developed an external fiducial marker based 3D reconstruction method, which was able to fuse optical brightfield and fluorescence with histology imaging data. Registration of 3D tumor shape was pursued to combine in vivo MRI/MRSI and ex vivo optical brightfield and fluorescence imaging data. This registration strategy was applied to in vivo MRI/MRSI, ex vivo optical brightfield/fluorescence, as well as histology imaging data sets obtained from human breast tumor models. 3D human breast tumor data sets were successfully reconstructed and fused with this platform.
Keywords: molecular imaging, cancer, multimodal, magnetic resonance imaging, magnetic resonance spectroscopic imaging, fluorescence, histology, fiducial marker
1. Introduction
Investigating complex diseases like cancer often requires the combined use of different in vivo imaging modalities, such as magnetic resonance (MR) imaging (MRI), magnetic resonance spectroscopic imaging (MRSI), as well as optical imaging applications with ex vivo histological analyses obtained with optical microscopy. In most studies, a combined molecular–functional–anatomic imaging approach provides the maximum benefit, but requires a combination of multiple imaging modalities because each modality has strengths and weaknesses [1, 2].
MRI is useful to noninvasively measure the 3D anatomic structure of an organ or tissue of interest while performing characterization of regional pathology [3]. With the use of gadolinium-containing contrast agents of different sizes, such as clinically approved gadopentetate dimeglumine (Magnevist) or preclinically used albumin gadolinium diethylenetriamine pentaacetic acid (albumin-(Gd-DTPA)) [4], contrast-enhanced MRI can be performed to assess vascular volume, permeability of blood vessels, and contrast agent transport across the extracellular matrix [5] noninvasively in 3D. Such MRI techniques provide a wealth of functional information, but are limited by their relatively low sensitivity of detection and low spatial resolution compared to ex vivo techniques. In addition, molecular-targeted MRI-contrast agents for receptor imaging are often quite large, with a diameter between 30 nm and 200 nm, which can limit the delivery of these contrast agents to the tumor tissue [6]. MRSI is able to noninvasively detect the 3D spatial distribution of endogenous metabolites in vivo, however, its low sensitivity results in low spatial resolution [7]. Recent advances have expanded MRI/MRSI towards characterizing functional tumor parameters such as intra- and extracellular pH, as well as tissue levels of glucose, choline, lipid, and markers of energy metabolism, such as adenosine triphosphate (ATP) and phospocreatine (PCr) [7-11]. However, in studies that are geared towards elucidating molecular pathways, it is often necessary to obtain additional information from complementary imaging modalities, which are often performed ex vivo.
Ex vivo optical imaging, including fluorescence and bioluminescence imaging, plays a crucial role in modeling different human diseases due to its high specificity, sensitivity, and spatial resolution. Optical imaging can be used to image transcription factors such as hypoxia-inducible factor 1 (HIF-1) [12], receptors such as HER-2 or αvβ3 [13-15], different activated oncogenes such as p53 and myc [16], and activated enzymes with activatable probes for cathepsin D, cathepsin B, and matrix metalloproteinase 2 (MMP2) [17-19], as well as tracking of cells that express fluorescent proteins or luciferases in cancer invasion and metastasis [20]. The majority of optical imaging systems to date generate only two-dimensional (2D) images of the integrated light distribution emitted from the surface of the 3D tissue, which severely compromises the ability to quantify and accurately localize these optical signals due to their strong dependence on optical tissue properties and on depth [1]. There is great interest in developing fluorescence and bioluminescence imaging applications that generate volumetric images, such as diffuse optical tomography (DOT) and fluorescence laminar optical tomography (FLOT) that accurately localize signals and enable quantitative studies of fluorescent contrast agents and proteins [21-23]. Such developments in optical imaging instrumentation/applications will potentially result in higher temporal and spatial resolution [1]. However, many research applications to date use optical imaging of 2D tissue sections instead of technically challenging 3D optical imaging [22], which necessitates 3D reconstruction.
Immunohistochemical staining (IHC) analyses, such as staining of HER-2/neu, estrogen receptor (ER), progesterone receptor (PR), and histological staining of nuclei with hematoxylin and matrix with eosin are usually performed on 5-10 μm-thick tissue cryosections or formaldehyde/formalin-fixed paraffin-embedded (FFPE) sections to visualize receptor expression, and nuclear and tissue morphology [24]. Histology and IHC provide high sensitivity and high spatial resolution of detection in cancer diagnosis and treatment. However, like most other optical imaging modalities, histology and IHC imaging can only generate 2D images of stained thin tissue sections. As a result, samples typically need to be cryosectioned all the way through the tissue of interest, and multiple 2D images need to be examined to draw conclusions. Reconstruction in 3D of such histology and IHC images would aid in visualizing the spatial distribution of the stained molecular features in 3D, thereby avoiding the restriction of investigating only one 2D section at a time.
A recent study reported a Teflon fiducial template which allows the insertion of small hollow Teflon rods of ~0.71 mm diameter into the tumor [25, 26]. Using this approach, image registration was performed for MRI and digitized microscopy images of tissue histology based on the rigid Teflon rods. More recently, two iridescent acrylic paints, “bronze” and “stainless steel”, were evaluated to fuse 3D MRI and histology images, and a straight-line paint-track fiducial method was developed to assist in registration and 3D histopathology reconstruction [27]. These two methods propose different solutions towards fusing MRI and histology data sets, without providing the option of adding other optical imaging data sets of the same tumor, e.g. as an intermediate imaging modality. Breen et al [28] developed a 3D registration method of MRI data to histological sections of rabbit thigh by using macroscopic tissue as the reference. Fiducial markers embedded in surrounding tissue were employed in their method. However, breast tumor xenografts grown in the mammary fat pad of mice, similar to many other preclinical tumor models and some clinical tumors, do not contain large amounts of surrounding tissue, and therefore it would not be feasible to place fiducial markers in close proximity of the tumor in vivo without contaminating and injuring the tumor tissue. Injuring tissue close to a tumor can also have undesirable effects on tumor vascularization. The size of the surface coil, which is typically used for imaging mouse breast tumor in preclinical MRI scanners, also limits the space for placing fiducial markers in vivo.
Some other studies [29-33] about registration of histological slices and in vivo MRI for primate brain, which, unlike tumor xenograft tissue, provides ample anatomical features for co-registration, were also performed. The individual 2D deformation for each slice due to cutting and shrinkage was corrected by introducing an intermediate modality, which is obtained through blockface photographs. This series of blockface photographs consists of photographs of the brain surface taken at different steps during the sectioning process. Both global affine transform and non-linear transformation were done on the alignment of this series of 2D slices [34, 35]. Compared with primate brain tissue with skull, less rigid transformation occurred in the mouse breast tissue during sectioning. As a result, external fiducial markers are more feasible to provide accurate 3D reconstruction and registration of histology in breast tumor, in particular in tissues that do not contain distinct landmark structures such as tumors.
To address these 3D reconstruction and registration needs, we developed an external fiducial marker strategy that does not interfere with the tumor tissue and an image reconstruction and fusion framework for multimodal MRI/MRSI, brightfield/fluorescence imaging, and histology imaging.
2. Material and Methods
To illustrate the workflow and build up of our novel platform, we have performed in vivo MRI/MRSI, ex vivo optical brightfield and fluorescence imaging, as well as histology imaging of an orthotopic breast tumor xenograft model, which is derived from cells that express tdTomato fluorescent protein in hypoxic regions of the tumor as shown in Figure 1.
Figure 1.
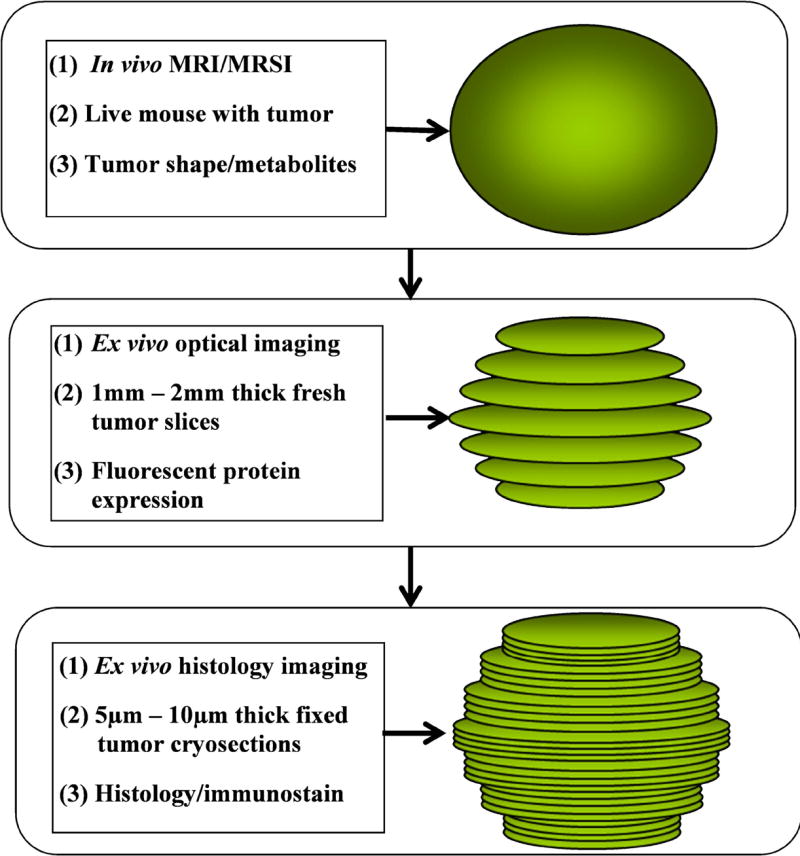
Schematic overview of the presented multimodal imaging approach using in vivo MRI/MRSI, ex vivo optical brightfield/fluorescence imaging, and histology imaging.
Breast tumor model
The MDA-MB-231 breast cancer cell line purchased from the American Type Culture Collection (ATCC, Manassas, VA) was used in this study. Cell culture of this cell line was performed as previously described [36]. MDA-MB-231 breast cancer cells were genetically modified to express tdTomato red fluorescent protein under the control of a promoter containing a tandem repeat of 5 hypoxia-response elements (MDA-MB-231-HRE-tdTomato) [37-39]. MDA-MB-231-HRE-tdTomato breast tumor xenografts were obtained by inoculating 2×10⁶ MDA-MB-231-HRE-tdTomato breast cancer cells in 0.05 ml Hank’s balanced salt solution (HBSS, Sigma, St. Louis, MO) into the upper left thoracic mammary fat pad of female athymic Nu/Nu nude mice (NCI-Frederick, Cat. 01B74). Mice weighed between 24 g and 28 g and tumor sizes were (8.0 ± 0.4 mm) × (8.0 ± 0.4 mm) × (8.0 ± 0.4 mm) when experiments were performed. All experimental animal protocols were approved by the Institutional Animal Care and Use Committee of the Johns Hopkins University School of Medicine.
3D in vivo T1-weighted MRI and MRSI
All mice were scanned in vivo on a 9.4T Bruker Avance Small Animal MR Scanner (Bruker, Billerica, MA) in the Broadway Research Building Molecular Imaging Center at the Johns Hopkins University School of Medicine. 3D MRSI images were obtained together with the corresponding high-resolution 3D T1-weighted MRI data, which served as high-resolution anatomic reference image data sets for the 3D MRSI data.
Tumor-bearing mice were anesthetized by intra-peritoneal injection of ketamine (25 mg/kg; Phoenix Scientific, Inc.) and acepromazine (2.5 mg/kg; Aveco, Phoenix Scientific) diluted in saline. The tumors of anesthetized mice were placed inside a home-built 1H cylinder surface coil of about 13 mm in diameter, and this set-up was mounted on a heated cradle to keep the animal warm. We used a 3D Rapid Acquisition with Relaxation Enhancement (RARE) spin echo fast imaging sequence to acquire 3D T1-weighted images. RARE acquires multiple spin echoes using the CPMG (Carr Purcell Meiboom Gill) sequence [40, 41] with slice selective RF pulses. 3D RARE was performed with the following parameters: echo time (TE) of 7.2 ms, repetition time (TR) of 500 ms, RARE factor of 4, flip angle of 900, field of view (FOV) of 1.0-cm by 1.0-cm by 1.0-cm, 64 phase encode steps (64 × 64 × 64 voxels), and number of averages (NA) of 4. Total acquisition time is 13 minutes. The reconstruction of MRI reference images was performed using ParaVision 5.0 software (Bruker, Billerica, MA), and magnitude 3D MRI reference images were imported into our novel multimodal molecular imaging reconstruction and fusion platform to generate a series of 2D images.
MRSI was achieved using a 3D spin echo chemical shift imaging (CSI) sequence [42]. Water-suppressed MRSI was performed using VAPOR [43] with the same geometry as used for the corresponding 3D RARE acquisition, with the following parameters: Gaussian excitation pulse with 0.25 ms length, 90 degree flip angle, TE of 82 ms, TR of 1000 ms, spectra resolution 3.9Hz/point, sweep width of 4000 Hz, FOV of 1.0-cm by 1.0-cm by 1.0-cm. The diameter of our cylinder surface coil is 13 mm, which is slightly larger than the mouse breast tumor xenograft sizes. Most part of the tumor was hung inside of the coil, which makes the B1 pulse profile of a Gaussian excitation pulse strong enough to reach a 90 degree flip angle. Rectangular k-space sampling was used with a matrix size of 8 × 8 ×8 (zero filled to 64 × 64 × 64), and NA of 4 resulting in a total measurement time of 33 minutes. An in-house IDL program was developed to reconstruct water-suppressed MR spectroscopic images. This software performed Fourier transformations (FT) both over the spatial axis and spectral axis of MRSI raw data, and automatically detected all metabolite peaks by applying a sliding window across the whole spectral range with a window width of 0.3 ppm and a step size of 0.3 ppm. A signal to noise ratio (SNR) threshold was applied to the water-suppressed MRSI data to detect metabolite peaks. The SNR threshold was set to 3 in this study. Following these MRI/MRSI studies, mice were sacrificed, and each tumor was fiducially marked and sectioned as described below.
Fiducial marker application
Prior to starting the tumor preparation, 4 g of gelatin Type A from porcine skin (Sigma, Cat. G-2500) was dissolved into 40 mL of distilled water warmed to 37°C to create a 10% gelatin solution. Five micrograms of Ponceau S Practical Grade (Sigma, Cat. P3504-10G) was dissolved into 1 mL of 10% gelatin solution to create the fiducial marker solution. Both solutions are liquid at 37°C and solidify to form a gel at room temperature.
Following in vivo MRI/MRSI, each mouse was sacrificed by the cervical dislocation method, and the tumor was immediately removed and placed in a Disposible Vinyl Specimen Cryomold (Tissue-Tek, Cat. 4566) that contained enough liquid gelatin to immerse the tumor. The original tumor orientation was preserved as indicated in Figure 2A. The top portion is defined as the upper region of the tumor located farthest away from the rib cage, the center region is defined as the middle region, and the body wall is the region located just adjacent to the rib cage. Three to four 25-mm pieces of 1.57-mm-thick Intramedic Non-Radiopaque Non-Toxic Polyethylene Tubing (Clay Adams, Becton Dickinson Co., Cat. 7431), were immediately placed in either a diagonal or vertical arrangement in the space surrounding the gelatin-immersed tumor (see Figure 2C). This step is essential in the creation of holes where the fiducial markers will later be inserted. The cryomold containing the 10%-gelatin-embedded tumor and tubing was placed on a 20 mL weigh boat (VWR International, Cat. 12577-005) over a bath of liquid nitrogen to solidify the gelatin while keeping the tubing in place. The embedded tissue was removed from cooling over liquid nitrogen just prior to the gelatin turning white. The tubing was then removed from the cryomold. A 1 mL latex free syringe (Becton Dickinson and Company, Cat. 309625) with 20G×1½ precision guide needle (Becton Dickinson, Cat. 305176) filled with the fiducial marker was warmed to 37°C and fiducial markers were injected into the holes left by the tubing (see Figure 2D), and re-cooled over liquid nitrogen to solidify the fiducial markers. The gelatin-embedded tumor with fiducial markers was then extracted from the cryomold (see Figure 2E) and placed in the tissue slicer. Two-mm-thick slices were cut and placed on ice-cold glass slides (Fisherbrand catalog number 12-550-34; Fisher Scientific, Pittsburg, PA) over ice in an arrangement that preserved orientation. These fresh tissue slices matched the 3D MRI/MRSI-image data sets in terms of geometry. This procedure from the time of tumor extraction to the time of microscopic imaging took no longer than 20 minutes and tissue was kept on ice to avoid tissue degradation.
Figure 2.
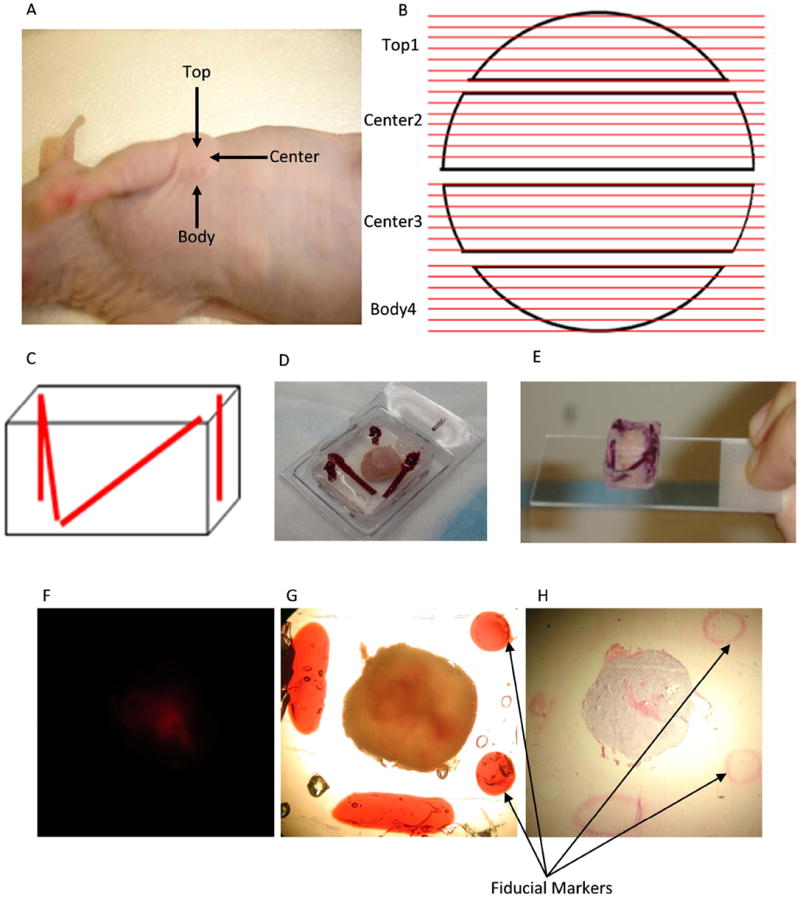
A, Definition of a mouse breast tumor xenograft top, center and body portions; B, Diagram describing the sectioning of the tumor from top to body. Black objects: top 1st slice, center 2nd slice, center 3rd slice and body 4th slice. Red lines: Each 2-mm slice was sectioned into 5 – 10 μm cryosections and H&E stained. C, Diagram depicting 2 diagonal markers and 2 straight markers. D, Extracted tumor embedded in gelatin with 2 diagonal markers and 2 straight markers in the cryomold. E, Extracted tumor embedded in gelatin with markers after taking away the cryomold placed on microscope slide. F, Fluorescence microscopic image (1× objective) from 2-mm thick MDA-MB-231-HRE-tdTomato breast tumor tissue slice. G, Brightfield microscopic images (1× magnification ) of the same FOV from 2-mm thick MDA-MB-231-HRE-tdTomato breast tumor tissue slice with two straight circular shape and two diagonal elliptic shape fiducial markers. H, Corresponding microscopic H&E histology image (1× objective) from a 10-μm thick MDA-MB-231-HRE-tdTomato breast tumor tissue section with two straight circular shape and one diagonal elliptic shape fiducial markers.
Ex vivo brightfield and fluorescence microscopic imaging
For microscopic measurements, a given slide holding an embedded, fiducially marked fresh tumor slice was taken out of the icebox and placed under the microscope for imaging. Each slice was carefully positioned so that the entire tumor and all of the adjacent fiducial markers were included in the image. In between microscopic measurements, the fresh tumor slices were returned to the icebox to keep the tissue at 4°C, and they were periodically moistened with saline to avoid dehydration of the tissue. Fluorescence microscopy images were obtained using a 1× objective attached to a Nikon microscope, equipped with a filter set for 528 to 553 nm excitation and 600 to 660 nm emission and a Nikon Coolpix digital camera (Nikon Instruments, Inc.). Brightfield images of the same FOV were acquired by the same microscope to obtain the tumor slice shape and fiducial markers. The fiducial markers were clearly visible in the brightfield images, which were inherently registered with the corresponding fluorescence images (Figure 2F, G). Following microscopy, the embedded samples where cooled over liquid nitrogen until the gelatin turned white. Samples were stored in a -80°C freezer until cryosectioning was performed.
Histology imaging
The frozen gelatin-embedded tumor slices were cryosectioned on a Microm HM550 cryostat microtome (Microm International GmbH, Walldorf, Germany). Sets of contiguous 10-μm thick cryosections were cut across the tumor from top to body wall throughout all 2-mm thick gelatin-embedded slices (see Figure 2B) with 500-μm distance in between, and the first and last 100-μm thick cryosections being discarded. Sections were attached to Superfrost Slides (VWR International, Cat. 48311-600), washed with 1X PBS, and fixed immediately in 3% paraformaldehyde for 30 min. Fixed tissue sections were placed in a glass Coplin jar containing 40 mL of distilled water (dH2O) and then in a separate Coplin Jar of Mayer’s hematoxylin (Sigma, Cat. 51275) for 30 min. Sections were gently washed in dH2O five times. To avoid drying, sections were immediately immersed in a jar containing 40 mL Eosin Y, aqueous, 1% PDC (EMD Chemicals Inc., Cat. 592-75) for 30 min, followed by five washes with dH2O. Fixed and stained tissue sections were dehydrated by submersion in 200 Proof Ethyl Alcohol (The Warner-Graham Company, Cat. 64-17-5) twice for 3 min each. Sections were immersed in a jar containing 40 mL of Histo-Clear II (National Diagnostics, Cat. HS 202) twice for two minutes each, followed by mounting with Richard–Allen Cytoseal 60 Mounting Medium (Thermo Scientific, Cat. 8310-4). A coverslip was immediately applied and sections were dried at room temperature for 24 h prior to imaging. Brightfield images were obtained using a 1× objective attached to a Nikon microscope, equipped with a Nikon Coolpix digital camera (Nikon Instruments, Inc.). The fiducial markers were clearly visible in the hematoxylin and eosin (H&E)-stained sections as shown in Figure 2H. Based on the H&E staining, dark purple tumor regions with intact nuclei were identified as viable tumor regions, and pink areas without nuclei were identified as necrotic tumor regions.
Platform of combined MRI/MRSI and multiparametric optical imaging
The workflow of our software platform, which combines MRI/MRSI and optical imaging (brightfield, fluorescence, and histology imaging), is illustrated in Figure 3. This software workflow was developed in Matlab 2009a (Natick, MA). It has two modules of 3D reconstruction, including optical imaging reconstruction (Figure 3-A) and histology imaging reconstruction (Figure 3-B), and two modules of 3D hierarchical registration, including registration of MRI/MRSI with optical brightfield and fluorescence imaging (Figure 3-C), and registration of optical brightfield and fluorescence imaging with histology imaging (Figure 3-D). In the 3D reconstruction module, a fiducial marker based 3D reconstruction method was utilized. The 3D hierarchical registration modules included two steps. Firstly, a fiducial marker based rigid registration strategy was performed to fuse ex vivo optical brightfield and fluorescence images with ex vivo histology images. Secondly, a combined 3D tumor shape based rigid and nonrigid registration strategy by considering both global translations and scaling as well as local deformations of tumor sections was developed to combine in vivo MRI/MRSI images with ex vivo optical brightfield and fluorescence images and histology images.
Figure 3.
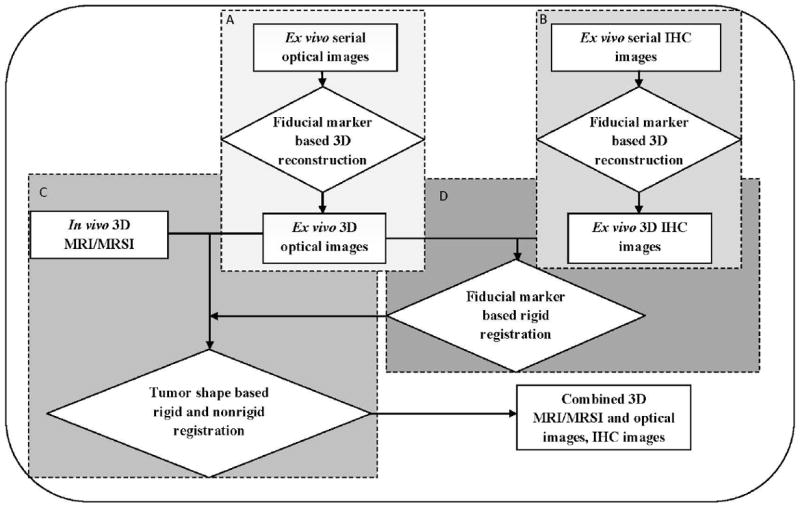
Workflow of combined 3D in vivo MRI/MRSI and ex vivo optical and histology imaging, which consists of several modules: A, optical imaging reconstruction; B, histology imaging reconstruction; C, 3D hierarchical registration of MRI/MRSI with optical brightfield and fluorescence imaging; D, 3D hierarchical registration of optical brightfield and fluorescence imaging with histology imaging. All modules from A to D are labeled in color from light gray to dark gray in order. Rectangular boxes represent different imaging modality data, diamond shaped boxes represent different image processing steps.
Fiducial marker based 3D reconstruction of optical images
The straight markers were used to align the microscopic images, and the diagonal markers were applied to check the order of the slices from top portion to body wall. Figure 4 illustrates the procedure of this fiducial marker based 3D reconstruction of optical images. It was performed as follows: First, a rigid affine transformation derived from the centroid of each straight fiducial marker was applied to align the top, center, and body sections (Figure 4-A). An affine transformation is composed of linear transformations (rotation and scaling) and a translation (or “shift”). The top slice was used as a reference map, and then the affine transformation was generated by measuring the centroid coordinates of the corresponding straight fiducial markers on both top and center slices. An aligned center section relative to the top slice was generated by applying this affine transformation to the original center section. The same method was utilized for additional center sections and the body section. The centroid of each straight fiducial marker was picked manually in this software platform.
Figure 4.
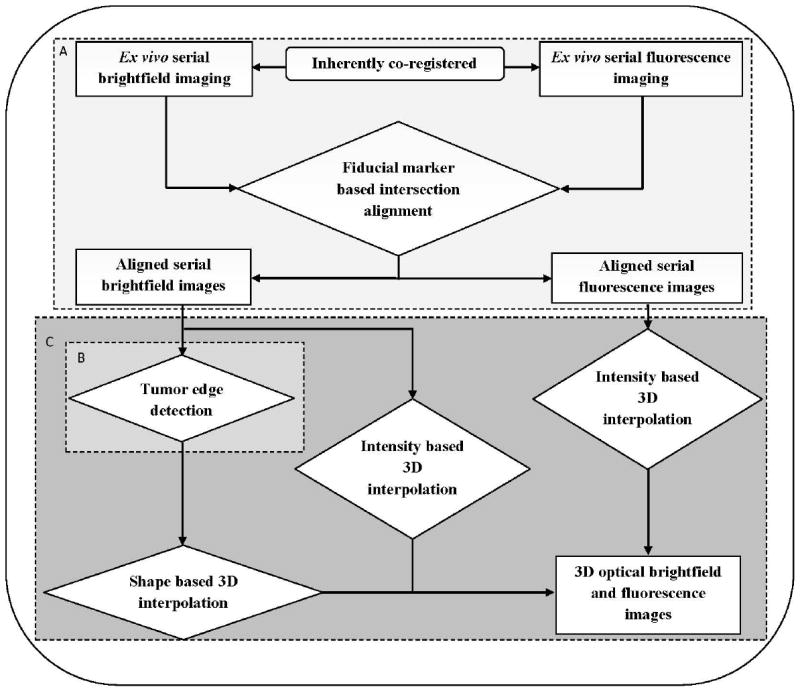
Workflow diagram of fiducial marker based 3D reconstruction of ex vivo optical brightfield and fluorescence imaging, which consists of several modules: A, alignment of tumor sections; B, tumor edge detection; C, 3D combined shape and intensity based interpolation. All modules from A to C are labeled in color from light gray to dark gray in order. Rectangular boxes represent different imaging modalities data, diamond shaped boxes represent different image processing steps.
Second, an active shape model (‘snake’ or ASM model) was utilized to detect the tumor edge in the aligned sections [44-46] (Figure 4-B). ASM is a statistical model of the shape of objects that iteratively deform to fit to the shape of the object in a new image. The shape of the tumor is represented by a set of points controlled by the shape model. The snake model in the Gradient Vector Flow Active Contour Toolbox [47] written in Matlab was used in this step. The parameters setting of our snake model were as follows: elasticity = 0.05, rigidity = 0, viscosity = 2.5, external force weight = 1.5, pressure force weight = 0.1 and maximum number of iterations = 50. The initial tumor boundary points were manually selected for the ASM model calculation.
Finally, a 3D combined shape and intensity based interpolation was performed to render the 3D data of the tumor slices [48, 49] (Figure 4-C). A tessellation-based 3D linear interpolation method was used for the shape-based interpolation. This method performs Delaunay 3D tessellation [50, 51] to find values between neighboring points to be used for interpolation, which can help speed up the search for neighboring points. 3D linear interpolation was also applied to the image intensity, and the shape interpolation was used as a mask for the intensity interpolation to generate the 3D volume of the tumor in brightfield images and 3D spatial fluorescence intensity distribution in fluorescence images.
Co-registration procedure for MRI/MRSI, optical and histological data
Histological image sections were registered to the optical microscopic image sections by aligning the fiducial markers that were visible in both types of images, and rendered to give 3D registered histology images. The centroid of each fiducial marker in each corresponding histology and optical image section was manually selected in this platform. Figure 5 illustrates our workflow of fusing these three different imaging data sets – MRI/MRSI images, optical brightfield and fluorescence images and histological images of the breast tumor sections. The corresponding tumor boundary points were manually selected in the detected MRI tumor edge excluding skin, which were detected by the ASM model with the following parameters: elasticity = 0.02, rigidity = 0.01, viscosity = 2, external force weight = 1.8, pressure force weight = 0.1, and maximum number of iterations = 50. The corresponding microscopic tumor edge images were both detected by the ASM model [44-46]. An affine transform was applied based on the boundary points to obtain rigid registered 3D microscopic brightfield images and MRI images. As outlined in Figure 5, b-spline based warping [52-54] was performed between rigid registered 3D microscopic brightfield images and 3D MRI images to obtain warped 3D microscopic brightfield images. It is necessary to warp the rigid registered microscopic images because tissue may experience shear force and local deformation during sectioning. Since the brightfield and fluorescence images were inherently co-registered, and they were co-registered with histology images by our fiducial marker scheme, the same spatial affine transformations and the same b-spline based nonrigid transformations as for the 3D microscopic brightfield images were applied to these 3D microscopic fluorescence and histology images. As the position of the mouse was kept the same during MRI/MRSI acquisition, and the geometry parameters of MRI RARE images and MRSI images were the same, the MRSI and MRI RARE images were co-registered. By comparing the relatively low spatial resolution of MRSI (8×8×8) with the high spatial resolution of MRI (64×64×64), 8 voxels × 8 voxels × 8 voxels shifting was observed in a phantom with unique geometry due to asymmetric sampling in k-space, and this shift was corrected in the MRSI images. The registered optical brightfield, fluorescence, and histology images were co-registered with MRSI automatically after the fusion of MRI, optical imaging, and histology was completed. The software Amira 5.2.1 (Mercury Computer Systems, Chelmsford, MA) was used for 3D image display in this study.
Figure 5.
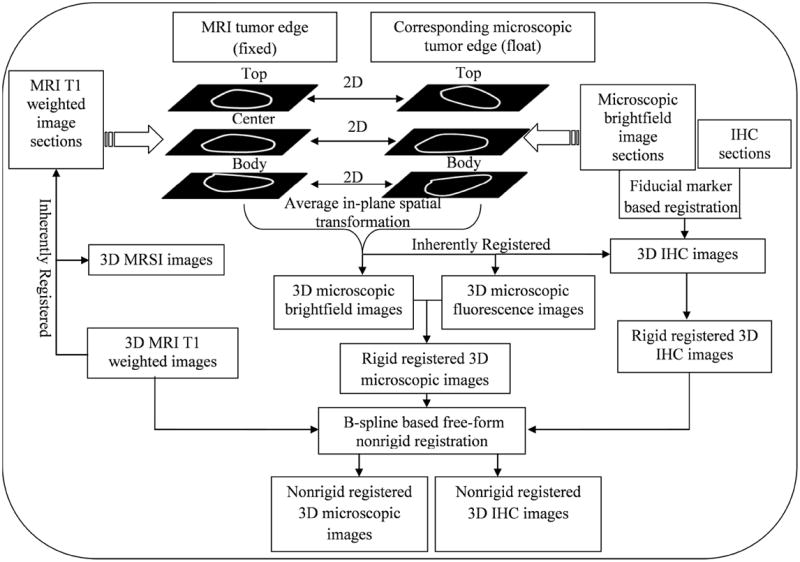
Schematic map of 3D co-registration of optical fresh tissue brightfield/fluorescence imaging, and histology to MRI/MRSI imaging data.
Normalized mutual information [55] was used as a metric to measure the image difference in this study. The measurement of normalized mutual information, originating from information theory, is a measure of the statistical dependency between two data sets, which is particularly suitable for the registration of images from different modalities. The images’ difference error between MRI image M and optical image O used in this measurement was defined as follows:
| (1) |
Where H(.) = − Σ(p(.) • log p(.)), H(M), H(O) are the entropies of the MRI images M and the optical images O, while H(M,O) is the joint entropy between these two image types. p(.) is the normalized histogram of the MRI images M, optical images O or the normalized joint histogram of the MRI images M and optical images O. As the joint entropy decreases, the distance error will be minimized. The common measurement unit of entropy in information theory is ‘bit’. However, the normalized mutual information based image distance error has no unit because of the cancelation of this unit in denominator and numerator in the equation.
3. Results
The application of our multimodal image reconstruction, registration, and fusion platform worked well for 2-mm thick fresh tumor slices that were imaged with brighfield and fluorescence microscopy as shown in Figure 6. The original brightfield images with fiducial markers are shown in Figure 6A from the top of the tumor to bodywall. Each slice was 2-mm thick. Figure 6B demonstrates that the three serial slices from the top of the tumor to body wall were aligned well by the fiducial markers. In Figure 6C, tumor edge detection was successfully performed using the ASM model as described in Material and Methods. The 3D tumor shape was interpolated to fill in values in between the 2-mm thick slices, and the fluorescence intensity indicating hypoxic regions was interpolated accordingly using intensity interpolation (Figure 6D). The serial slices with both tumor boundary and fluorescence intensity information were rendered after performing the combined 3D shape and intensity interpolation. Figure 6E shows the final 3D-reconstructed tumor boundary as a yellow grid, with the hypoxic volume obtained from the red fluorescence signal shown in red.
Figure 6.
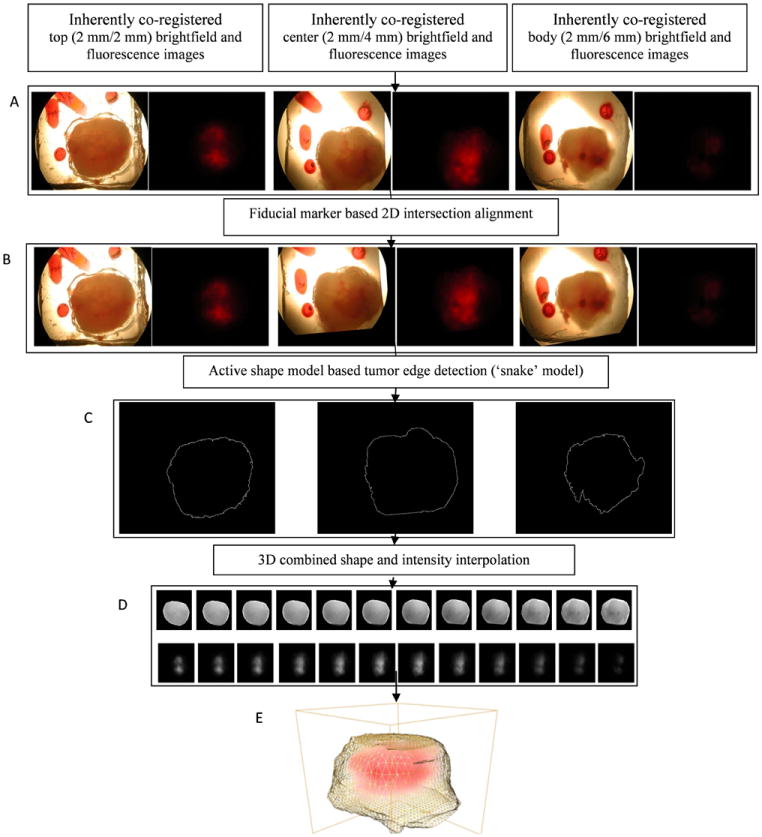
Results of 3D reconstruction of optical brightfield and fluorescence images of 2-mm thick tumor slices. A, Original brightfield and fluorescence serial sections; B, Brightfield and fluorescence serial sections after fiducial marker based intersectional alignment; C, Detected edges of serial intersectionally aligned brightfield sections; D (top row), 3D combined shape and intensity interpolated brightfield images; D (bottom row), 3D intensity interpolated fluorescence images; E, 3D display of tumor boundary obtained from D (top row) and fluorescence intensities obtained from D (bottom row). Yellow grid: tumor boundary, red: fluorescence intensities.
The 3D reconstruction of H&E stained histology images including the corresponding intermediate results are displayed in Figure 7. The 3D reconstruction of histology images was performed analogous to that of the brightfield and fluorescence images shown in Figure 6. Figure 7A presents the aligned fiducial markers and the corresponding 10-μm thick tissue cryosections of H&E staining. Figure 7B shows the boundary of necrotic regions detected by ASM. Figure 7C demonstrates the rendered volume of necrotic tumor regions. Figure 7D shows the final 3D display of the reconstructed tumor shape (yellow grids) and necrotic regions (bright yellow color).
Figure 7.
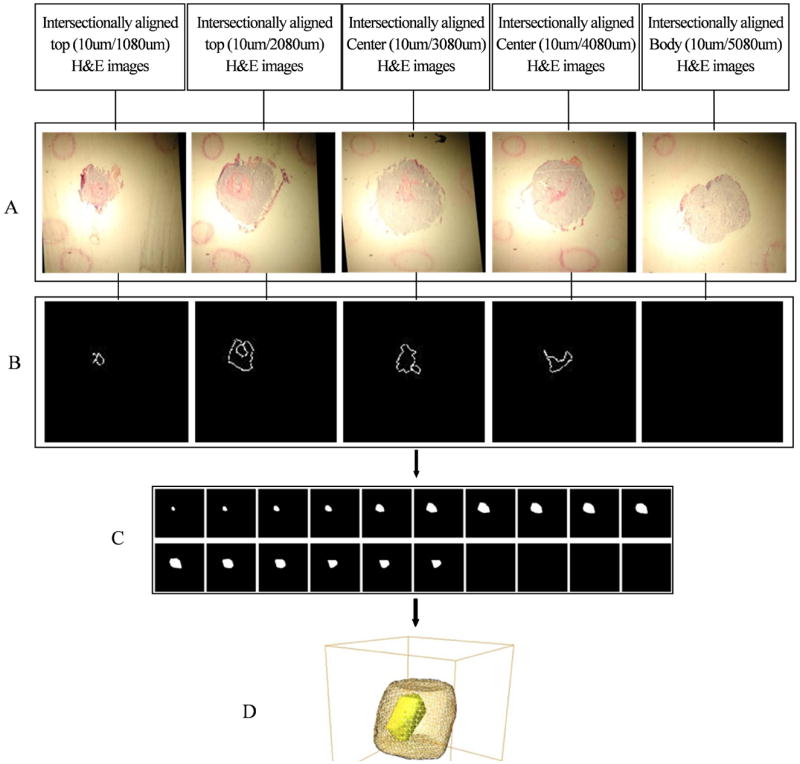
Results of 3D reconstruction of H&E stained histology images of 10-μm thick tumor sections. A, Histological serial sections after fiducial marker based intersectional alignment; B, Detected edges of necrotic regions from intersectionally aligned histological serial sections; C, 3D shape interpolated images of necrotic region; D, 3D display of tumor boundary from Figure 6D (top row) and necrotic regions from 7C. Yellow grid: tumor boundary, bright yellow: isosurface of the necrotic region.
Figure 8 shows a representative example of 2D registered MRI/MRSI, optical brightfield, fluorescence, and H&E stained images. Figure 8A shows a T1-weighted MRI slice through the tumor, which was used to register the corresponding optical brightfield/fluorescence image to it. The segmented brightfield image with two fiducial markers by ASM is shown in Figure 8B. Figure 8C displays the tumor shape based rigid registered brightfield image with fiducial markers, and Figure 8D shows the tumor shape based warped brightfield image with fiducial markers. Figure 8E diplays the corresponding warped H&E stained necrotic core with registered straight fiducial markers segmented by ASM modeling. Figure 8F shows an overlay of Figure 8A (red channel), Figure 8D (green channel), and Figure 8E (blue channel), displaying yellow color where MRI and brightfield images are overlaid, cyan color where brightfield and H&E stained images are overlaid, and white color where all three images are overlaid. The fiducial markers of optical brightfield images and H&E stained images were registered well. Tumor shape obtained from the brightfield images, which was registered to the tumor shape obtained from the corresponding MRI slice, matched well visually. The overhanging MRI boundary of the tumor shown in red in Figure 8F originates from skin, surrounding the tumor in the in vivo MRI scans. Figure 8G shows the non-rigid registered fluorescence image with the tumor boundary and Figure 8H the MRSI intensity map generated from the tCho signal.
Figure 8.
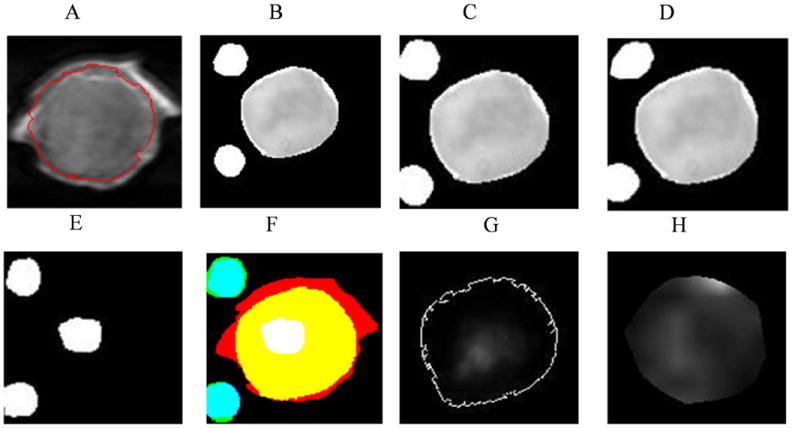
2D registered MRI/MRSI and optical brightfield, fluorescence and H&E images. A, MRI T1 weighted image with tumor edge detected by ASM model; B, segmented optical brightfield image with fiducial markers; C, rigid registered optical brightfield image with fiducial markers; D, combined rigid and nonrigid registered optical brightfield image with fiducial markers; E, registered H&E images with fiducial markers and the necrotic region; F, overlay of registered MRI, brightfield images, H&E images with fiducial markers (red channel: MRI; green channel: registered brightfield images; blue channel: registered H&E images; white: necrotic region from H&E image; yellow: overlay of MRI and brightfield images; cyan: overlay of brightfield image and H&E image); G, registered fluorescence image with tumor boundary; H, tCho intensity map, the ROI of tumor in the tCho MRSI is generated by thresholding the water-unsuppressed MRSI water signal.
Figure 9 shows an example of 3D registered MRI/MRSI, optical brightfield/fluorescence, and H&E stained histology images with fiducial markers, which was generated using our multimodal image reconstruction, registration, and fusion platform. The boundary of a 3D T1-weighted MRI data set of a representative tumor is displayed as yellow grid in Figure 9A. Figure 9B shows the boundary of the tumor and fiducial markers of the corresponding MRI-registered optical brightfield imaging data set as blue isosurface. Figure 9C shows the corresponding H&E stained necrotic core with registered straight fiducial markers displayed in green as 3D isosurface. Figure 9D shows an overlay of Figures 9A, 9B, and 9C. The fiducial markers of optical brightfield images and H&E stained images were registered well. The tumor shape in the brightfield images was registered to the tumor part of the corresponding MRI data set (excluding the skin), and the two tumor shapes matched well visually as is shown in Figure 9D. The boundary of the tumor obtained from the 3D MRI data set, which is shown as yellow grid in Figure 9D, represents the surrounding skin of the tumor and is therefore larger than the tumor boundary obtained from optical images as these were obtained ex vivo after removal of the skin from the tumor. Figure 9E shows the tCho intensity map with tumor boundary. The registered fluorescence distribution is shown as red voltex inside the tumor boundary in Figure 9F. Figure 9G shows the fused tCho, fluorescence (hypoxic) and necrotic regions with fiducial markers and tumor boundary.
Figure 9.
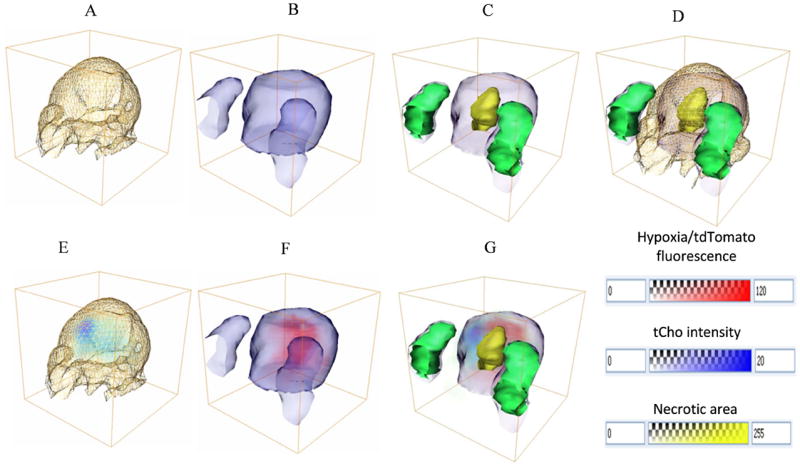
3D registered MRI/MRSI, optical brightfield, fluorescence, and H&E images. A, Tumor boundary with skin obtained from 3D MRI T1 weighted images (yellow grid); B, Tumor boundary (blue isosurface) and fiducial markers (blue isosurface) from registered optical brightfield images; C, Overlay of necrotic region from registered corresponding H&E-stained images (yellow transparent isosurface), registered straight fiducial markers displayed in 3D isosurface (green isosurface), registered optical tumor boundary (blue isosurface) and fiducial markers (blue isosurface) from brightfield images; D, Overlay of A, B, and C; E, 3D registered tCho map in blue voltex with tumor boundary from MRI in yellow gridline; F, Registered fluorescence distribution in red voltex with tumor boundary (blue isosurface) ; G, Fused tCho (light blue voltex), fluorescence (red voltex), and necrotic regions (yellow transparent isosurface) with fiducial markers from H&E-stained images (green isosurface) and tumor boundary (blue isosurface).
In preclinical cancer research performed in animal models, no gold standard imaging data are available to assess the accuracy of this method. However, mutual information is a standard method to measure the accuracy between different imaging modalities. The mutual information based registration errors between MRI and optical brightfield images measured in four different tumors is shown in Figure 10. The image difference error between MRI and original optical brightfield images was the highest. This difference error decreased after shape based affine transformation was applied to the brightfield images. During the iterative warping of the brightfield images, this error continued to decrease and converged after several iterations. Each tumor shows a similar trend in this study, which demonstrates that this multimodal fusion strategy is feasible, robust, and performs well.
Figure 10.
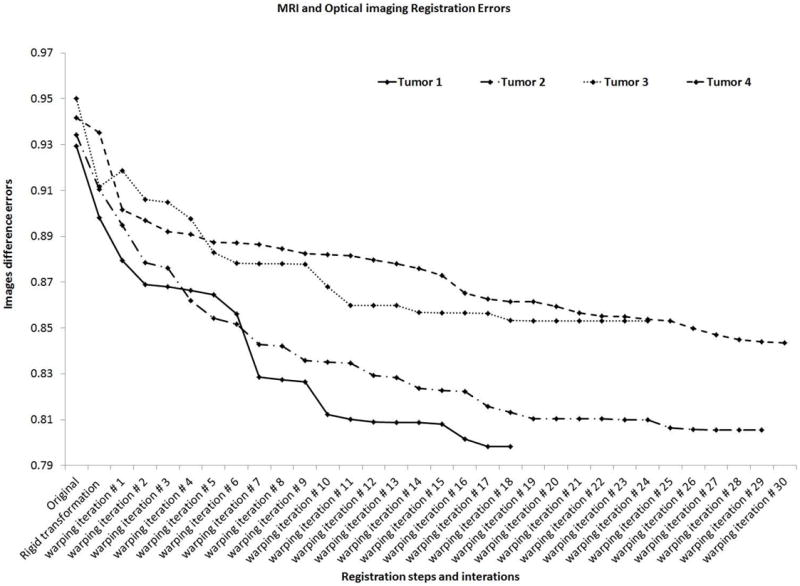
Convergence properties of registration of MRI and optical image distances in each registration step of 4 different tumors. The image difference error is the mutual information error between two imaging modalities, and after each registration step, this mutual information error was minimized.
4. Discussion
We have developed a versatile multimodal image reconstruction and fusion platform, which can be applied to a wide range of combined in vivo and ex vivo imaging modalities in preclinical cancer research, and potentially in clinical applications as well. We have successfully demonstrated the performance of this software platform in an example of combined MRI/MRSI, brightfield/fluorescence, and histology imaging of a human breast tumor xenograft model, which expressed tdTomato fluorescent protein in hypoxic tumor regions. The workflow of this 3D reconstruction and fusion platform includes a fiducial marker system that helps register and reconstruct different ex vivo imaging data sets. Following successful image reconstruction, registration, and fusion with our software platform, co-localization or correlation analysis, such as principal component analysis (PCA) and canonical correlation analysis (CCA) of metabolites, fluorescent proteins, and necrotic or IHC positive regions can be performed to extract the spatial features of the probed molecular processes. In the future, we will use this platform to investigate effects of the tumor microenvironment on MRS-detectable metabolites and the underlying molecular pathways in human breast tumor xenograft models.
To the best of our knowledge, it is impossible that the presented 3D reconstruction and registration can reliably be done without fiducial markers. As tumor slices are typically moved inconsistently from section to section during sectioning procedures, the 3D volume of a tumor or features inside the tumor in optical and histological images will be inaccurate without fiducial markers. Unlike previously described fiducial marker systems in small rodents [25-27], an external non-destructive fiducial marker strategy was developed in this study. Our marker system was embedded into gelatin, and not directly into the tissue of interest itself as previously suggested [25-27], which avoids contamination and deformation of the tissue under investigation. Since gelatin, compared with the wax used in [28], is of comparable solidity and consistence as tumors, shear forces and local deformation of tissue and markers during sectioning are similar. These fiducial markers were applied in both ex vivo brightfield/fluorescence imaging and ex vivo histology imaging, but not in MRI/MRSI because gelatin-embedding of a skin-covered tumor in a live mouse throughout a 1-2 hour MRI/MRSI acquisition was not feasible due to the limited size of RF coil in the animal MRI scanner and drying-out of gelatin occurring during this time period. We therefore performed a tumor shape based 3D registration of the MRI/MRSI data sets with the brightfield/fluorescence and histology imaging data sets.
The segmentation of each marker and tumor boundary was performed semi-automatically by using the ASM model and manually setting a series of initial boundary points on each 2D slice. The average segmentation time of each 2D slice was around 40 seconds including the manual selection of the boundary points. Tumor shape varies greatly, thus fully automated segmentation, such as thresholding or histogram based methods may increase the registration error, which is why this semi-automated segmentation approach fits this application well. Also, the addition of b-spline based warping further reduced the registration errors. This method can visualize single volumes of necrosis inside the tumor. It is also possible to semi-manually use the same method to perform 3D reconstruction of separate small necrotic regions in the tumor, and then add them together. The number of slices for interpolation is still justifiable for such an approach.
Shrinking of tumor tissue following cryosectioning and histological or IHC staining is a common problem when comparing histological or IHC sections with in vivo MRI data of the same tumor [56], therefore, the tumor boundary in our histology data sets cannot be directly used for registration. To avoid this problem, we used the fiducial markers to register histology with MRI via the fresh 2-mm thick sections imaged with brightfield microscopy as an intermediate modality. Since these 2-mm thick sections are fresh tissue without fixation and they are thicker compared with histology sections (10-μm), they preserve the tumor original geometric information very well with the embedded fiducial markers after sectioning.
We performed an average in-plane spatial transformation between corresponding MRI and 3D microscopic image slices to obtain 3D registered microscopic brightfield and fluorescence images. The difference in the angulation of MRI slices and the cutting plane of 2-mm thick sections could potentially lead to a matching problem. However, the positioning of tumor-bearing mice during our MR measurements was kept the same as in the sectioning process, which dramatically reduced the registration error.
Recently, Chappelow et al [57] demonstrated an elastic registration of multiparametric prostate MRI and histology by multi-attribute combined mutual information (MACMI) in human prostate cancer. Multiprotocol MRI data obtained from clinical prostate cancers were used in their method. While the MACMI algorithm provides an automated approach for registering multiparametric MRI data with histology, this approach cannot be extended to incorporating additional imaging modalities such as fluorescence imaging, and it relies on the availability of multiparametric data sets from MRI. In other applications, such as diffusion or permeability studies of tumors, a contrast agent can be used during the MRI acquisition to provide additional spatially resolved information on structures such as for example vascular structures, which could be obtained from inside the tumor. The registration of MRI and optical images could be completed by using this additional structural information, and not only the tumor boundary information, which may lead to a more accurate registration.
Our framework is not limited to preclinical breast cancer research and the presented imaging modalities, and it can be adapted to clinical breast cancer applications that can involve any type of multimodal imaging approach combined with histology and/or IHC. Clinically, residual tumor after excisional biopsy has been reported in 32–63% of breast cancer cases [58-60]. These patients undergo contrast-enhanced MRI before reexcision lumpectomy or mastectomy is performed, followed by histopathological evaluation of the excised tissue. The information obtained from both MRI and histopathological images is important in guiding the reexcision surgery. As a result, combining in vivo MRI, ex vivo optical histology and/or IHC imaging and extracting information from both modalities becomes necessary, and could benefit from our 3D reconstruction and fusion platform. Human biopsy samples can be much larger than preclinical mouse samples. Using the concept of 2-mm thick optical images as an intermediate imaging step could lead to more accurate 3D reconstruction and registration of MRI and histological data. More automated tumor boundary detection methods may be necessary to speed up the processing, imaging, and validation time for clinical applications.
Our multi-modal multiscale molecular imaging platform is not limited to in vivo MRI/MRSI, ex vivo optical brightfield/fluorescence imaging, and histology and/or IHC imaging. Another promising ex vivo modality that could be included in the presented 3D imaging work-flow is mass spectrometric imaging (MSI) of tumors to additionally detect the spatial distribution of a wide variety of biomolecules [61]. Gelatin was also shown to facilitate the MSI imaging of breast cancer tissue [61]. MSI data can be obtained from adjacent sections of histology or IHC data, and this presented multi-modal multiscale molecular imaging platform can be expanded to include MSI.
Acknowledgments
We thank Dr. Vaddapuram P. Chacko for expert technical support with the MRI studies on the Bruker 9.4T Small Animal Scanner. We thank Dr. Zaver M. Bhujwalla for useful discussions.
This work was supported by the National Institutes of Health (NIH) grant R01 CA134695.
Abbreviations
- 2D
two-dimensional
- 3D
three-dimensional
- CSI
chemical shift imaging
- Cho
free choline
- GPC
glycerophosphocholine
- HBSS
Hank’s balanced salt solution
- MR
magnetic resonance
- MRI
magnetic resonance imaging
- MRSI
magnetic resonance spectroscopic imaging
- MRS
magnetic resonance spectroscopy
- ATP
adenosine triphosphate
- PCr
phospocreatine
- IHC
immunohistochemical
- PC
phosphocholine
- tCho
total choline-containing metabolites
- PCA
principal component analysis
- CCA
canonical correlation analysis
- albumin-(Gd-DTPA)
albumin gadolinium diethylenetriamine pentaacetic acid
- HIF-1
hypoxia-inducible factor 1
- MMP2
matrix metalloprotease 2
- DOT
diffuse optical tomography
- FLOT
fluorescence laminar optical tomography
- ER
estrogen receptor
- PR
progesterone receptor
- FFPE
formaldehyde-fixed paraffin-embedded
- HREs
hypoxia-response elements
- RARE
rapid acquisition with relaxation enhancemen
- CPMG
Carr Purcell Meiboom Gill
- TE
echo time
- TR
repetition time
- FOV
field of view
- NA
number of averages
- FT
Fourier transformations
- SNR
signal to noise ratio
- H&E
hematoxylin and eosin
- ASM
active shape model
References
- 1.Glunde K, Pathak AP, Bhujwalla ZM. Molecular-functional imaging of cancer: to image and imagine. Trends Mol Med. 2007;13:287–297. doi: 10.1016/j.molmed.2007.05.002. [DOI] [PubMed] [Google Scholar]
- 2.Penet MF, Mikhaylova M, Li C, Krishnamachary B, Glunde K, Pathak AP, Bhujwalla ZM. Applications of molecular MRI and optical imaging in cancer. Future Med Chem. 2010;2:975–988. doi: 10.4155/fmc.10.25. [DOI] [PMC free article] [PubMed] [Google Scholar]
- 3.Lauterbu Pc. Image Formation by Induced Local Interactions - Examples Employing Nuclear Magnetic-Resonance. Nature. 1973;242:190–191. [PubMed] [Google Scholar]
- 4.Ronald JA, Chen YX, Belisle AJL, Hamilton AM, Rogers KA, Hegele RA, Misselwitz B, Rutt BK. Comparison of Gadofluorine-M and Gd-DTPA for Noninvasive Staging of Atherosclerotic Plaque Stability Using MRI. Circulation-Cardiovascular Imaging. 2009;2:226–234. doi: 10.1161/CIRCIMAGING.108.826826. [DOI] [PMC free article] [PubMed] [Google Scholar]
- 5.Partridge SC, Gibbs JE, Lu Y, Esserman LJ, Tripathy D, Wolverton DS, Rugo HS, Hwang ES, Ewing CA, Hylton NM. MRI measurements of breast tumor volume predict response to neoadjuvant chemotherapy and recurrence-free survival. AJR Am J Roentgenol. 2005;184:1774–1781. doi: 10.2214/ajr.184.6.01841774. [DOI] [PubMed] [Google Scholar]
- 6.Brigger I, Dubernet C, Couvreur P. Nanoparticles in cancer therapy and diagnosis. Adv Drug Deliv Rev. 2002;54:631–651. doi: 10.1016/s0169-409x(02)00044-3. [DOI] [PubMed] [Google Scholar]
- 7.Glunde K, Artemov D, Penet MF, Jacobs MA, Bhujwalla ZM. Magnetic resonance spectroscopy in metabolic and molecular imaging and diagnosis of cancer. Chem Rev. 2010;110:3043–3059. doi: 10.1021/cr9004007. [DOI] [PMC free article] [PubMed] [Google Scholar]
- 8.Penet MF, Pathak AP, Raman V, Ballesteros P, Artemov D, Bhujwalla ZM. Noninvasive multiparametric imaging of metastasis-permissive microenvironments in a human prostate cancer xenograft. Cancer Res. 2009;69:8822–8829. doi: 10.1158/0008-5472.CAN-09-1782. [DOI] [PMC free article] [PubMed] [Google Scholar]
- 9.Nielsen FU, Daugaard P, Bentzen L, Stodkilde-Jorgensen H, Overgaard J, Horsman MR, Maxwell RJ. Effect of changing tumor oxygenation on glycolytic metabolism in a murine C3H mammary carcinoma assessed by in vivo nuclear magnetic resonance spectroscopy. Cancer Res. 2001;61:5318–5325. [PubMed] [Google Scholar]
- 10.Aboagye EO, Bhujwalla ZM. Malignant transformation alters membrane choline phospholipid metabolism of human mammary epithelial cells. Cancer Res. 1999;59:80–84. [PubMed] [Google Scholar]
- 11.Opstad KS, Bell BA, Griffiths JR, Howe FA. An investigation of human brain tumour lipids by high-resolution magic angle spinning 1H MRS and histological analysis. NMR Biomed. 2008;21:677–685. doi: 10.1002/nbm.1239. [DOI] [PubMed] [Google Scholar]
- 12.Greijer AE, van der Groep P, Kemming D, Shvarts A, Semenza GL, Meijer GA, van de Wiel MA, Belien JA, van Diest PJ, van der Wall E. Up-regulation of gene expression by hypoxia is mediated predominantly by hypoxia-inducible factor 1 (HIF-1) J Pathol. 2005;206:291–304. doi: 10.1002/path.1778. [DOI] [PubMed] [Google Scholar]
- 13.Burnett CA, Xie J, Quijano J, Shen Z, Hunter F, Bur M, Li KC, Danthi SN. Synthesis, in vitro, and in vivo characterization of an integrin alpha(v)beta(3)-targeted molecular probe for optical imaging of tumor. Bioorg Med Chem. 2005;13:3763–3771. doi: 10.1016/j.bmc.2005.03.024. [DOI] [PubMed] [Google Scholar]
- 14.Jin ZH, Josserand V, Foillard S, Boturyn D, Dumy P, Favrot MC, Coll JL. In vivo optical imaging of integrin alphaV-beta3 in mice using multivalent or monovalent cRGD targeting vectors. Mol Cancer. 2007;6:41. doi: 10.1186/1476-4598-6-41. [DOI] [PMC free article] [PubMed] [Google Scholar]
- 15.Smith-Jones PM, Solit DB, Akhurst T, Afroze F, Rosen N, Larson SM. Imaging the pharmacodynamics of HER2 degradation in response to Hsp90 inhibitors. Nat Biotechnol. 2004;22:701–706. doi: 10.1038/nbt968. [DOI] [PubMed] [Google Scholar]
- 16.Yeung SJ, Pan J, Lee MH. Roles of p53, MYC and HIF-1 in regulating glycolysis - the seventh hallmark of cancer. Cell Mol Life Sci. 2008;65:3981–3999. doi: 10.1007/s00018-008-8224-x. [DOI] [PMC free article] [PubMed] [Google Scholar]
- 17.Gocheva V, Joyce JA. Cysteine cathepsins and the cutting edge of cancer invasion. Cell Cycle. 2007;6:60–64. doi: 10.4161/cc.6.1.3669. [DOI] [PubMed] [Google Scholar]
- 18.Federman S, Miller LM, Sagi I. Following matrix metalloproteinases activity near the cell boundary by infrared micro-spectroscopy. Matrix Biol. 2002;21:567–577. doi: 10.1016/s0945-053x(02)00089-6. [DOI] [PubMed] [Google Scholar]
- 19.Bremer C, Bredow S, Mahmood U, Weissleder R, Tung CH. Optical imaging of matrix metalloproteinase-2 activity in tumors: feasibility study in a mouse model. Radiology. 2001;221:523–529. doi: 10.1148/radiol.2212010368. [DOI] [PubMed] [Google Scholar]
- 20.Dadiani M, Kalchenko V, Yosepovich A, Margalit R, Hassid Y, Degani H, Seger D. Real-time imaging of lymphogenic metastasis in orthotopic human breast cancer. Cancer Res. 2006;66:8037–8041. doi: 10.1158/0008-5472.CAN-06-0728. [DOI] [PubMed] [Google Scholar]
- 21.Hsiung PL, Phatak DR, Chen Y, Aguirre AD, Fujimoto JG, Connolly JL. Benign and malignant lesions in the human breast depicted with ultrahigh resolution and three-dimensional optical coherence tomography. Radiology. 2007;244:865–874. doi: 10.1148/radiol.2443061536. [DOI] [PubMed] [Google Scholar]
- 22.Wang J, Jiang S, Li Z, diFlorio-Alexander RM, Barth RJ, Kaufman PA, Pogue BW, Paulsen KD. In vivo quantitative imaging of normal and cancerous breast tissue using broadband diffuse optical tomography. Med Phys. 2010;37:3715–3724. doi: 10.1118/1.3455702. [DOI] [PMC free article] [PubMed] [Google Scholar]
- 23.Chen Y, Yuan SA, Wierwille J, Naphas R, Li QA, Blackwell TR, Winnard PT, Raman V, Glunde K. Integrated Optical Coherence Tomography (OCT) and Fluorescence Laminar Optical Tomography (FLOT) Ieee Journal of Selected Topics in Quantum Electronics. 2010;16:755–766. [Google Scholar]
- 24.Coons AH, Creech HJ, Jones RN. Immunological properties of an antibody containing a fluorescent group. Proceedings of the Society for Experimental Biology and Medicine. 1941;47:200–202. [Google Scholar]
- 25.Humm JL, Ballon D, Hu YC, Ruan S, Chui C, Tulipano PK, Erdi A, Koutcher J, Zakian K, Urano M, Zanzonico P, Mattis C, Dyke J, Chen Y, Harrington P, O’Donoghue JA, Ling CC. A stereotactic method for the three-dimensional registration of multi-modality biologic images in animals: NMR, PET, histology, and autoradiography. Med Phys. 2003;30:2303–2314. doi: 10.1118/1.1600738. [DOI] [PubMed] [Google Scholar]
- 26.Cho H, Ackerstaff E, Carlin S, Lupu ME, Wang Y, Rizwan A, O’Donoghue J, Ling CC, Humm JL, Zanzonico PB, Koutcher JA. Noninvasive multimodality imaging of the tumor microenvironment: registered dynamic magnetic resonance imaging and positron emission tomography studies of a preclinical tumor model of tumor hypoxia. Neoplasia. 2009;11:247–259. doi: 10.1593/neo.81360. 242p following 259. [DOI] [PMC free article] [PubMed] [Google Scholar]
- 27.McGrath DM, Vlad RM, Foltz WD, Brock KK. Technical note: fiducial markers for correlation of whole-specimen histopathology with MR imaging at 7 tesla. Med Phys. 2010;37:2321–2328. doi: 10.1118/1.3395575. [DOI] [PubMed] [Google Scholar]
- 28.Breen MS, Lazebnik RS, Wilson DL. Three-dimensional registration of magnetic resonance image data to histological sections with model-based evaluation. Annals of Biomedical Engineering. 2005;33:1100–1112. doi: 10.1007/s10439-005-5778-8. [DOI] [PubMed] [Google Scholar]
- 29.Dauguet J, Delzescaux T, Conde F, Mangin JF, Ayache N, Hantraye P, Frouin V. Three-dimensional reconstruction of stained histological slices and 3D non-linear registration with in-vivo MRI for whole baboon brain. J Neurosci Methods. 2007;164:191–204. doi: 10.1016/j.jneumeth.2007.04.017. [DOI] [PubMed] [Google Scholar]
- 30.Kim B, Boes JL, Frey KA, Meyer CR. Mutual information for automated unwarping of rat brain autoradiographs. Neuroimage. 1997;5:31–40. doi: 10.1006/nimg.1996.0251. [DOI] [PubMed] [Google Scholar]
- 31.Mega MS, Chen SS, Thompson PM, Woods RP, Karaca TJ, Tiwari A, Vinters HV, Small GW, Toga AW. Mapping histology to metabolism: coregistration of stained whole-brain sections to premortem PET in Alzheimer’s disease. Neuroimage. 1997;5:147–153. doi: 10.1006/nimg.1996.0255. [DOI] [PubMed] [Google Scholar]
- 32.Ourselin S, Roche A, Subsol G, Pennec X, Ayache N. Reconstructing a 3D structure from serial histological sections. Image and Vision Computing. 2001;19:25–31. [Google Scholar]
- 33.Toga AW, Ambach KL, Schluender S. High-resolution anatomy from in situ human brain. Neuroimage. 1994;1:334–344. doi: 10.1006/nimg.1994.1018. [DOI] [PubMed] [Google Scholar]
- 34.Chakravarty MM, Bertrand G, Hodge CP, Sadikot AF, Collins DL. The creation of a brain atlas for image guided neurosurgery using serial histological data. Neuroimage. 2006;30:359–376. doi: 10.1016/j.neuroimage.2005.09.041. [DOI] [PubMed] [Google Scholar]
- 35.Malandain G, Bardinet E, Nelissen K, Vanduffel W. Fusion of autoradiographs with an MR volume using 2-D and 3-D linear transformations. Neuroimage. 2004;23:111–127. doi: 10.1016/j.neuroimage.2004.04.038. [DOI] [PubMed] [Google Scholar]
- 36.Glunde K, Guggino SE, Solaiyappan M, Pathak AP, Ichikawa Y, Bhujwalla ZM. Extracellular acidification alters lysosomal trafficking in human breast cancer cells. Neoplasia. 2003;5:533–545. doi: 10.1016/s1476-5586(03)80037-4. [DOI] [PMC free article] [PubMed] [Google Scholar]
- 37.Raman V, Artemov D, Pathak AP, Winnard PT, Jr, McNutt S, Yudina A, Bogdanov A, Jr, Bhujwalla ZM. Characterizing vascular parameters in hypoxic regions: a combined magnetic resonance and optical imaging study of a human prostate cancer model. Cancer Res. 2006;66:9929–9936. doi: 10.1158/0008-5472.CAN-06-0886. [DOI] [PubMed] [Google Scholar]
- 38.Krishnamachary B, Penet MF, Nimmagadda S, Mironchik Y, Raman V, Solaiyappan M, Semenza GL, Pomper M, Bhujwalla ZM. Hypoxia regulates CD44 and its variant isoforms through HIF-1α in MDA-MB-231 human breast cancer cells and tumors. 2011 doi: 10.1371/journal.pone.0044078. [DOI] [PMC free article] [PubMed] [Google Scholar]
- 39.Glunde K, Shah T, Winnard PT, Jr, Raman V, Takagi T, Vesuna F, Artemov D, Bhujwalla ZM. Hypoxia regulates choline kinase expression through hypoxia-inducible factor-1 alpha signaling in a human prostate cancer model. Cancer Res. 2008;68:172–180. doi: 10.1158/0008-5472.CAN-07-2678. [DOI] [PMC free article] [PubMed] [Google Scholar]
- 40.Goelman G, Prammer MG. The Cpmg Pulse Sequence in Strong Magnetic-Field Gradients with Applications to Oil-Well Logging. Journal of Magnetic Resonance Series A. 1995;113:11–18. [Google Scholar]
- 41.Hurlimann MD, Griffin DD. Spin dynamics of Carr-Purcell-Meiboom-Gill-like sequences in grossly inhomogeneous B-0 and B-1 fields and application to NMR well logging. Journal of Magnetic Resonance. 2000;143:120–135. doi: 10.1006/jmre.1999.1967. [DOI] [PubMed] [Google Scholar]
- 42.Brown TR, Kincaid BM, Ugurbil K. NMR chemical shift imaging in three dimensions. Proc Natl Acad Sci U S A. 1982;79:3523–3526. doi: 10.1073/pnas.79.11.3523. [DOI] [PMC free article] [PubMed] [Google Scholar]
- 43.Tkac I, Starcuk Z, Choi IY, Gruetter R. In vivo 1H NMR spectroscopy of rat brain at 1 ms echo time. Magn Reson Med. 1999;41:649–656. doi: 10.1002/(sici)1522-2594(199904)41:4<649::aid-mrm2>3.0.co;2-g. [DOI] [PubMed] [Google Scholar]
- 44.Cootes TF, Taylor CJ, Cooper DH, Graham J. Active Shape Models - Their Training and Application. Computer Vision and Image Understanding. 1995;61:38–59. [Google Scholar]
- 45.Cootes TF, Edwards GJ, Taylor CJ. Active appearance models. Ieee Transactions on Pattern Analysis and Machine Intelligence. 2001;23:681–685. [Google Scholar]
- 46.Cootes TF, Taylor CJ. Constrained active appearance models. Eighth Ieee International Conference on Computer Vision, Proceedings; 2001. pp. 748–754. [Google Scholar]
- 47.Xu C, Prince JL. Snakes, shapes, and gradient vector flow. IEEE Trans Image Process. 1998;7:359–369. doi: 10.1109/83.661186. [DOI] [PubMed] [Google Scholar]
- 48.Frenkel KA. Volume Rendering. Communications of the Acm. 1989;32:426–435. [Google Scholar]
- 49.Udupa JK, Herman GT. Volume Rendering Versus Surface Rendering. Communications of the Acm. 1989;32:1364–1366. [Google Scholar]
- 50.Du Q, Wang XQ. Centroidal Voronoi tessellation based algorithms for vector fields visualization and segmentation. Ieee Visualization 2004, Proceedings. 2004:43–50. [Google Scholar]
- 51.Romano-Diaz E, van de Weygaert R. Delaunay Tessellation Field Estimator analysis of the PSCz local Universe: density field and cosmic flow. Monthly Notices of the Royal Astronomical Society. 2007;382:2–28. [Google Scholar]
- 52.Lee S, Wolberg G, Shin SY. Scattered data interpolation with multilevel B-splines. Ieee Transactions on Visualization and Computer Graphics. 1997;3:228–244. [Google Scholar]
- 53.Rueckert D, Sonoda LI, Hayes C, Hill DLG, Leach MO, Hawkes DJ. Nonrigid registration using free-form deformations: Application to breast MR images. Ieee Transactions on Medical Imaging. 1999;18:712–721. doi: 10.1109/42.796284. [DOI] [PubMed] [Google Scholar]
- 54.Oguro S, Tokuda J, Elhawary H, Haker S, Kikinis R, Temparly CMC, Hata N. MRI Signal Intensity Based B-Spline Nonrigid Registration for Pre- and Intraoperative Imaging During Prostate Brachytherapy. Journal of Magnetic Resonance Imaging. 2009;30:1052–1058. doi: 10.1002/jmri.21955. [DOI] [PMC free article] [PubMed] [Google Scholar]
- 55.Studholme C, Hill DLG, Hawkes DJ. An overlap invariant entropy measure of 3D medical image alignment. Pattern Recognition. 1999;32:71–86. [Google Scholar]
- 56.Jacobs MA, Windham JP, Soltanian-Zadeh H, Peck DJ, Knight RA. Registration and warping of magnetic resonance images to histological sections. Med Phys. 1999;26:1568–1578. doi: 10.1118/1.598671. [DOI] [PubMed] [Google Scholar]
- 57.Chappelow J, Bloch BN, Rofsky N, Genega E, Lenkinski R, DeWolf W, Madabhushi A. Elastic registration of multimodal prostate MRI and histology via multiattribute combined mutual information. Medical Physics. 2011;38:2005–2018. doi: 10.1118/1.3560879. [DOI] [PMC free article] [PubMed] [Google Scholar]
- 58.Lee JM, Orel SG, Czerniecki BJ, Solin LJ, Schnall MD. MRI before reexcision surgery in patients with breast cancer. American Journal of Roentgenology. 2004;182:473–480. doi: 10.2214/ajr.182.2.1820473. [DOI] [PubMed] [Google Scholar]
- 59.Orel SG, Rosen M, Mies C, Schnall MD. MR imaging-guided 9-gauge vacuum-assisted core-needle breast biopsy: Initial experience. Radiology. 2006;238:54–61. doi: 10.1148/radiol.2381050050. [DOI] [PubMed] [Google Scholar]
- 60.Kim JA, Son EJ, Kim EK, Kim MJ, Kwak JY, Jeong J. Postexcisional Breast Magnetic Resonance Imaging in Patients With Breast Cancer: Predictable Findings of Residual Cancer. Journal of Computer Assisted Tomography. 2009;33:940–945. doi: 10.1097/RCT.0b013e3181a6b719. [DOI] [PubMed] [Google Scholar]
- 61.Amstalden van Hove ER, Blackwell R, Klinkert I, Eijkel GB, Heeren RM, Glunde K. Multimodal mass spectrometric imaging of small molecules reveals distinct spatio-molecular signatures in differentially metastatic breast tumor models. Cancer Res. 2010;70:9012–9021. doi: 10.1158/0008-5472.CAN-10-0360. [DOI] [PMC free article] [PubMed] [Google Scholar]


