

Supplemental Digital Content is available in the text.
Abstract
Background:
Few epidemiologic studies have investigated associations of air pollution with cognition in older adults, and none has specifically compared associations across particle sources. We investigated whether exposure to particulate air pollution, characterized by size and source, was associated with cognitive function and decline in cognitive function.
Methods:
We included participants of the Whitehall II cohort who were residents of greater London and who attended the medical examination in study wave 2007–2009 (n = 2867). Annual average concentrations of particulate matter (PM) (PM10 and PM2.5 from all sources and from traffic exhaust) were modeled at resolution of 20 × 20 m for 2003–2009. We investigated the relationship between exposure to particles and a cognitive battery composed of tests of reasoning, memory, and phonemic and semantic fluency. We also investigated exposure in relation to decline in these tests over 5 years.
Results:
Mean age of participants was 66 (standard deviation = 6) years. All particle metrics were associated with lower scores in reasoning and memory measured in the 2007–2009 wave but not with lower verbal fluency. Higher PM2.5 of 1.1 μg/m3 (lag 4) was associated with a 0.03 (95% confidence interval = −0.06 to 0.002) 5-year decline in standardized memory score and a 0.04 (−0.07 to −0.01) decline when restricted to participants remaining in London between study waves.
Conclusions:
This study provides support for an association between particulate air pollution and some measures of cognitive function, as well as decline over time in cognition; however, it does not support the hypothesis that traffic-related particles are more strongly associated with cognitive function than particles from all sources.
Life expectancy has doubled in the last century, leading to considerable aging of populations.1,2 Contemporary theories view aging as the result of a gradual, lifelong accumulation of subtle damage to cells and tissues over time,3 resulting in a finely graded inverse association between age and cognitive performance.4,5 Poor cognitive status is perhaps the single most disabling condition at older ages. The large heterogeneity in the cognitive status of older adults4 suggests that identifying modifiable risk factors that shape cognitive aging trajectories has considerable potential for prevention.
There is limited, but growing, epidemiologic evidence of an association between exposure to particulate air pollution and cognitive function.6–9 Epidemiologic studies showing a relationship between distance to high-traffic roadways and cognition suggest that particles from traffic sources, due either to their size or composition, may be particularly harmful.10,11 Similarly, toxicological studies provide evidence that ultrafine particles (diameter of 100 nm or less), which are primarily from traffic exhaust in urban areas, can directly access the central nervous system.12 Relatively few epidemiologic studies investigating air pollution and cognition or decline over time in cognition have been conducted in older adults, and none has specifically compared associations across particle sources.9
We investigated whether long-term exposure to particulate air pollution at residence was associated with cognitive function and decline in cognitive function. We hypothesized that particles from traffic exhaust would have stronger associations than particles from all sources combined.
METHODS
Study Population
Our analysis included a subset of participants of the Whitehall II longitudinal cohort study, which enrolled 10,308 London-based civil servants between 1985 and 1988 to investigate psychosocial and biologic risk factors of coronary disease.13 Participants are invited to a medical examination every 5 years, and a postal questionnaire is sent between clinic phases. We included participants who were residents of greater London (within the M25 motorway) at the 2002–2004 assessment and whose postcodes could be linked to modeled air pollution (n = 3414). Of these, 2867 underwent the medical examination in 2007–2009. There was no difference with respect to age or exposure between participants living in greater London who attended the medical screening and those with linked air pollution; however, participants who were included in the analysis were more likely to have high employment grade and higher cognitive functions scores at the 2002–2004 wave (eTable 1, http://links.lww.com/EDE/A805). Participants gave written consent to participate in the Whitehall II study, and the University College London and London School of Hygiene and Tropical Medicine ethics committees approved the study.
Exposure to Air Pollution
Annual average concentrations for the years 2003–2009 were modeled at resolution of 20 × 20 m using an approach described in detail elsewhere.14,15 Particulate matter (PM) was modeled according to size and source, including PM10 (PM with diameter ≤ 10 μm), PM10 from traffic exhaust only, PM2.5 (PM with diameter ≤ 2.5 μm), and PM2.5 from traffic exhaust only. Briefly, KCLurban is a dispersion modeling system based on ADMS dispersion model v.4 and road source model v.2.3,16 which incorporates meteorologic data measured hourly, empirically derived NO–NO2–O3 and PM relationships, and emissions from the London Atmospheric Emissions Inventory.17 Model evaluation statistics indicate good agreement between the model and measurements: r = 0.78 for PM10 (year 2008, 76 measurement sites) and r = 0.74 for PM2.5 (year 2008, 15 sites).
Exposure at residence was based on the average concentration at model grid points within 25 m of the residential postcode center. For participants who moved within London between study waves (n = 389), we did not know the date of the move; exposure was assigned as follows. Exposure for years 2003–2006 was based on the address at the 2002–2004 study wave and for years 2007–2009, the address at the 2007–2009 wave (39% moved less than 100 m). Participants who moved outside of greater London between the study waves (n = 213) were assigned exposure based on their address at the 2002–2004 study wave. Various averaging periods were constructed, including a 1-year average (concentration during the year of the 2007–2009 cognition assessment; yearly lag 0; similarly, yearly lags 1–4 correspond to 1–4 years prior to 2007–2009 assessment; 3-year average (3 years preceding the 2007–2009 assessment: average of yearly lags 1–3) and 5-year average (year of 2007–2009 measurements plus 4 preceding: average of yearly lags 0–4). For example, if a participant’s 2007–2009 cognition assessment took place in 2007, modeled concentrations for the year 2007 were assigned to yearly lag 0, concentrations for the year 2006 were assigned to yearly lag 1, year 2005 assigned to yearly lag 2, and so on. For this person, the 3-year average exposure would be the average of modeled concentrations for 2006, 2005, and 2004, and the 5-year average exposure would be the average of modeled concentrations for 2007, 2006, 2005, 2004, and 2003.
Cognition Measurements
The set of cognitive function tests was chosen to provide a comprehensive assessment of cognition and to be appropriate for the age range in the study population. The tests were administered as part of a medical examination in 2002–2004 and 2007–2009. The tests included in the analysis had good test–retest reliability (range 0.60–0.89)18 and included the following. Reasoning was measured using the Alice Heim 4-I test, which is composed of a series of 65 verbal and mathematical reasoning items of increasing difficulty. The test measures inductive reasoning, the ability to identify patterns and infer principles and rules. Short-term verbal memory was measured with a 20-word free-recall test in which participants were presented a list of 20 1 or 2 syllable words at 2-second intervals and were then asked to recall them in writing (in any order, within 2 minutes). Two measures of verbal fluency were assessed: semantic and phonemic. To measure semantic fluency, participants were asked to recall in writing as many animal names as they could within 1 minute. To measure phonemic fluency, participants were similarly asked to recall words beginning with “S.” We did not include neurodegenerative diseases in the analysis because numbers are very small given the relatively young age of the cohort at the last follow-up (mean age = 66 years).
Covariates
Data on sociodemographic characteristics, socioeconomic position, and medical conditions were recorded via questionnaire. The following set of covariates based on the 2007–2009 assessment was considered in the analysis. Sociodemographic variables included age (continuous in years), sex, ethnicity (white or nonwhite), marital status (married/cohabiting, single, divorced/separated/widowed), educational achievement (none or lower primary school, lower secondary school, higher secondary school, university, or higher degree), socioeconomic position (using the British civil service grades of employment, high, intermediate, low). Health behaviors included: smoking status (current, past, never); alcohol use (none, moderate, heavy use derived from the number of drinks consumed in the past week); frequency of fruit and vegetable consumption; physical activity categorized as active (≥2.5 hours/week of moderate or 1 hour/week of vigorous physical activity), inactive (<1 hour/week of either moderate or vigorous physical activity), or moderately active (if not active or inactive).19 Health measures included systolic and diastolic blood pressure, serum cholesterol levels, prevalence of stroke, coronary heart disease and diabetes, and frequency of depressive symptoms measured using the Center for Epidemiological Studies Depression Scale.20 In the analysis of cognitive data from 2007 to 2009, models included age, sex, year of screening, and any other covariates that were independent predictors of at least one of the cognition tests and also associated with PM2.5. In the analysis of cognitive decline, models included age, sex, age-by-time interaction, and any other covariates that were predictive of change in at least one of the cognition tests over time and also associated with PM2.5.
Statistical Analysis
To allow comparability across cognitive tests, all scores were converted to z-scores (mean = 0, standard deviation = 1), such that a positive score represents better performance. For the analysis of cognitive data assessed in 2007–2009, scores were standardized using distributions at that wave. For the analysis of cognitive decline between 2002–2004 and 2007–2009, scores were standardized using the 2002–2004 distributions. Only participants with complete covariate data were included in the models.
For the analysis of cognitive data from 2007 to 2009, we used linear regression models to estimate the association between pollutants and standardized cognitive scores. To allow comparability across pollutants, associations are reported per interquartile range (IQR) change in 5-year average exposure. The functional form of the exposures and each continuous covariate was explored by fitting a smooth function in a generalized additive model. We then used an analysis-of-deviance approach to test whether a nonlinear function improved the model fit compared with a linear term. Analyses were conducting using R software (2.15.2, R Foundation for Statistical Computing, Vienna, Austria). In sensitivity analyses, participants who moved outside of London between study waves were excluded (n = 213).
For the analysis of cognitive decline, linear mixed models were used to estimate the association between exposure to pollutants and cognitive decline between the 2002–2004 and 2007–2009 assessments. We included 2 exposure windows: (1) 5-year average exposure and (2) 4 years prior to the 2007–2009 assessment (yearly lag 4), which was included because residential address was most certain for all participants at that time. We found that the average exposure effect was different across the 4 tests in a model fit with an exposure-by-test interaction term. This suggested our data did not support combining the 4 tests into a single score for global cognition, as has been done in other studies, which can improve statistical power and reduce multiple testing.8 We therefore modeled each test separately. The models included a random intercept for each subject and random slope for time, allowing for differences across individuals in cognition in 2002–2004 and rate of decline. The linear mixed model included terms for time (difference between screening dates in years, divided by 5); age, sex, ethnicity, socioeconomic position, physical activity level, alcohol use, age-by-time interaction, air pollution, and air pollution-by-time interaction. The air pollution-by-time interaction term represents the mean difference in cognition over a 5-year period per IQR change in air pollution. Mixed models were run using SAS software (9.3, SAS Institute, Cary, NC). In sensitivity analyses, we (1) excluded participants who moved outside of London between study waves; (2) adjusted the models for area-level income; and (3) adjusted for education scores from the Index of Multiple Deprivation at the Lower Layer Super Output Area level.21
RESULTS
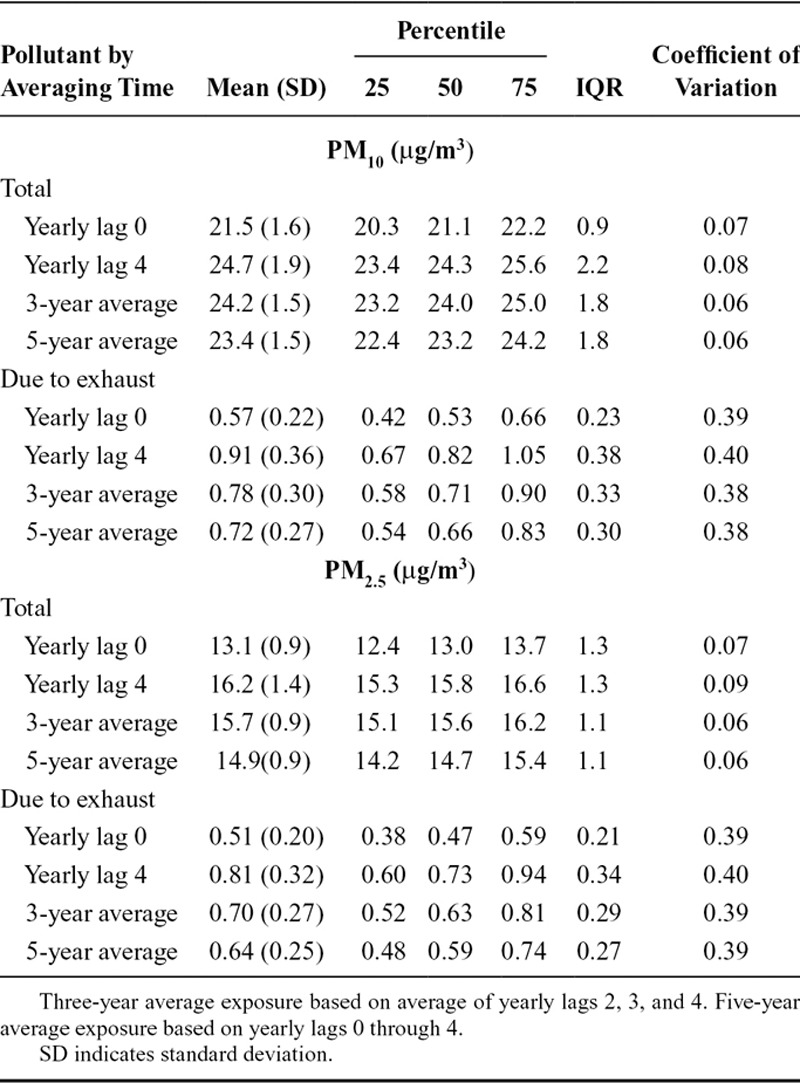
Participants were predominantly white men retired from work (Table 1); their mean age was 66 years. During the 5 years between 2002–2004 and 2007–2009, average exposure to total PM10 was 23.4 μg/m3 and to total PM2.5, 14.9 μg/m3; average exposures from vehicle exhaust were 0.72 μg/m3 for PM10 and 0.64 μg/m3 for PM2.5 (Table 2). Correlations between pollutants for the same averaging period were very high (0.90–0.99) (eTable 2, http://links.lww.com/EDE/A805). Correlations between averaging periods for the same pollutant were more varied (0.30–0.99) (eTable 3, http://links.lww.com/EDE/A805).
TABLE 1.
Sociodemographic and Clinical Characteristicsa of Participants in 2007–2009, Plus Cognitive Function Scores in 2002–2004 and 2007–2009
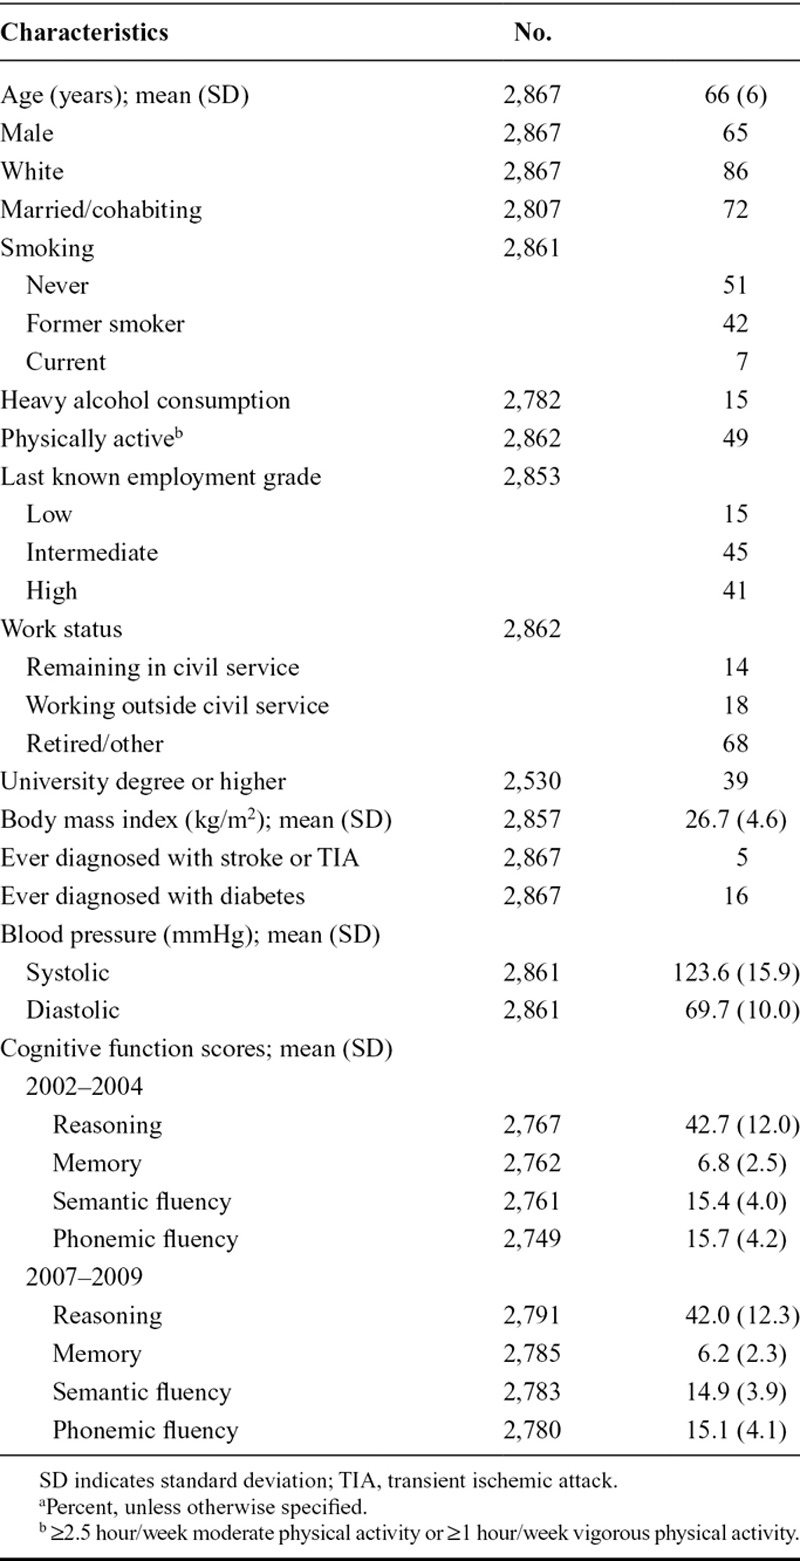
TABLE 2.
Distribution of Exposure to Pollutants over Various Averaging Times (n = 2,867)
Association Between Air Pollution and 2007/2009 Cognition
All particle metrics and all averaging times were associated with lower scores on reasoning (Figure). The strongest associations were observed for total PM2.5 for yearly lag 2 (coefficient −0.045 [95% confidence interval (CI) = −0.090 to 0.000]), yearly lag 3 (−0.046 [95% CI = −0.088 to −0.005]), and yearly lag 4 (−0.043 [−0.082 to −0.004]). For comparison, the effect of a 1-year increase in age on reasoning was −0.033 (−0.038 to −0.028). Compared with the other tests, precision was highest for the reasoning test. A similar pattern was observed for memory, where each particle metric and averaging time was consistently associated with lower memory score, with the strongest associations for total PM2.5 yearly lags 3 and 4. However, the precision in the estimates was low. For both measures of verbal fluency, there was an imprecise but consistent association between exposure and higher verbal fluency. There was no evidence from any cognitive test that associations were stronger for particles from vehicle exhaust than for total particle mass concentration. When participants who moved out of greater London were excluded, the overall pattern of associations was similar, although CIs were wider (eFigure, http://links.lww.com/EDE/A805).
FIGURE.

Regression coefficients and 95% CIs for cognitive function at the 2007–2009 assessment per IQR change in air pollution: (A) Reasoning; (B) Memory; (C) Semantic fluency; and (D) Phonemic fluency. Results are given for PM2.5 exhaust, PM2.5 total, PM10 exhaust, and PM10 total for lags 0–4, as well as for 3-year and 5-year averages. Associations adjusted for age, sex, ethnicity, employment grade, education, marital status, smoking status, alcohol use, year of screening, frequency of depression symptoms, and physical activity level.
Association Between Air Pollution and 5-Year Decline in Cognition
Five-year average exposure and exposure 4 years preceding the second assessment were consistently associated with a decline in cognition for all particle metrics for reasoning and memory (Table 3); however, the effects were relatively imprecise. PM2.5 and PM10 were associated with the largest declines. For both measures of verbal fluency, PM2.5 was associated with a small decline, whereas the PM exhaust metrics had a small positive association with changes in cognition over time. When participants who moved out of greater London between study waves were excluded, the point estimates for memory were notably larger in magnitude for all exposure metrics (Table 4). Results in models adjusted for area-level income and education deprivation were very similar and nearly identical to results in the main analysis (eTable 4, http://links.lww.com/EDE/A805).
TABLE 3.
Five-Year Change in Cognitive Function Per IQR Change in Pollution

TABLE 4.
Five-Year Change in Cognitive Function Per IQR Change in Pollution Excluding Participants Who Moved Out of Greater London Between Study Waves

DISCUSSION
Our analysis of within-city variation in particulate air pollution in relation to 4 tests of cognition resulted in 3 key findings. First, air pollution was associated with lower scores on reasoning, with stronger associations for the years more distant in time compared with the year of or year before the cognitive assessment. Associations with other cognitive tests were less clear. Second, counter to our hypothesis, there was no indication that particles from traffic exhaust were more strongly associated with cognition compared with total particle mass concentration. Third, when participants who had moved out of greater London between study waves were excluded, we observed associations for decline in memory with exposure 4 years preceding the second assessment. The stronger association after excluding movers is likely due to reduced exposure misclassification. Similar to the results from 2007 to 2009 cognition, PM from all sources combined was associated with the largest decline in cognition.
This analysis included a relatively large population (n = 2867, 94% of whom contributed cognitive data at both waves) residing in Europe’s largest city. Nonetheless, the spatial variation in exposure in this population was relatively limited and resulted in generally imprecise effect estimates. The standard deviation in PM2.5 over 5 years was 0.9 μg/m3, considerably lower than in a similar study with participants in multiple US cities (2.8 μg/m3).6 The coefficient of variation was much higher for PM2.5 from exhaust sources compared with total PM2.5, which resulted in better precision for the estimates related to PM from exhaust (Figure). However, the point estimates for total PM2.5 were consistently larger in magnitude compared with those for PM2.5 from exhaust sources. One possible explanation for the larger associations for total PM than for PM from exhaust sources is larger error in the modeled concentrations for traffic exhaust. No direct evaluation statistics are available for PM by specific sources, but emissions inventories by source type are likely to be more uncertain than for PM mass concentration. Similarly, exposure misclassification may be greater for exhaust PM if penetration indoors is lower than for total PM, or if error from assigning exposure based on postcode rather than address is greater for more spatially variable components of PM. This finding may also be due to chance.
Despite our efforts to adjust for confounding, the pattern of positive associations between particle exposure and verbal fluency measured in the 2007–2009 wave are unlikely to be causal and may be due to residual confounding. The analysis of change in cognitive function over time associated with particle exposure shows a decline in verbal fluency for PM2.5 and yearly lag 4 exposure to PM10, although small positive associations remain for the traffic exhaust metrics. (eTable 5, http://links.lww.com/EDE/A805, shows minimally and fully adjusted effect estimates for comparison).
Direct comparisons of our results with those from other epidemiologic studies in older adults are complicated by the use of different cognitive tests, reported on different scales, and for different pollutants. Our results for PM2.5 exhaust are broadly comparable with findings from other studies investigating the relationship between black carbon (predominantly from traffic sources) at residence and cognition. Power et al8 observed 0.054 lower global cognition as a z-score (95% CI = −0.103 to −0.006) for a doubling in black carbon in 680 men included in the Normative Aging Study. Our results for a doubling of 5-year average PM2.5 exhaust correspond to 0.054 lower reasoning (95% CI = −0.189 to 0.082). Wellenius and colleagues10 observed an association between black carbon and lower performance on the Hopkins Verbal Learning Test of immediate recall in 756 older adults; however, there were no clear associations with other tests, including semantic and phonemic fluency. In this same study, closer proximity of residence to major roadways was associated with poorer performance on several cognitive tests, including those measuring executive function and memory, suggesting a link with traffic sources either through air pollution or noise. Similarly, in a cohort of 400 women in the Ruhr area of Germany, a 1 μg/m3 increase in 5-year average PM10 was associated with 0.6 lower (95% CI = −1.4 to 0.02) total CERAD-Plus score (includes 18 items covering verbal fluency, phonemic fluency, memory, among others). The association for residence 50 m or less from a high traffic roadway was more pronounced: −3.8 (95% CI = −7.8 to 0.1), corresponding to an effect of about one-third the standard deviation of the score.11 In a large study of long-term exposure to PM2.5 on decline in cognition in older women in the United States, a 10 μg/m3 increase in PM2.5 was associated with a 0.014 decline (95% CI = −0.035 to 0.007) in z-score for verbal memory; 0.002 decline (−0.027 to 0.023) in verbal fluency, and 0.032 decline (−0.056 to −0.007) for the digit-span-backwards test over 2 years.6 These associations are comparable with those we observed for a 1.1 μg/m3 increase in 5-year average PM2.5 and decline over 5 years. A rough comparison can also be made to the effect of persistent active smoking compared with never smokers in the Whitehall II population. Persistent smokers had a decline of 0.075 in z-score for memory and 0.055 in executive function (reasoning combined with verbal fluency) over 5 years compared with never smokers, which corresponds to about 2–4 times the magnitude of our observed effects for PM2.5 on memory and reasoning, respectively.19
A relationship between PM and cognitive function may be based on several proposed biological mechanisms, involving cerebral vascular damage, neuroinflammation, and neurodegeneration. Particulate air pollution or exposure to traffic has been associated with measures of arterial structure and function that are inversely associated with cognitive function22 including carotid intima media thickness23–25 and arterial stiffness.26 Particulate air pollution has also been associated with a number of cardiovascular risk factors that may mediate the relationship with cognitive impairment,22 including homocysteine,27 blood pressure,28 and diabetes.29 Particle exposure has also been linked to increased systemic inflammation,30 which may lead to cellular damage and modification of the reactive oxygen species/cytokine balance in the brain.31 Systemic inflammation from air pollution may also contribute to the deterioration of olfactory, respiratory, and blood–brain barriers, enhancing access of particles to the central nervous system.32 Toxicological studies indicate that inhaled ultrafine particles and transition metals translocate from the respiratory system directly into the central nervous system via the olfactory nerve.12,32 Ultrafine particles have been identified in the brains of highly exposed dogs and humans.33,34 However, the precise mechanism of toxicity of particles once they have reached the central nervous system remains unclear.32
The strengths of this study include a relatively large cohort with comprehensive data on socioeconomic position and education, which are important confounders of the relationship between air pollution exposure and cognitive function. The detailed exposure information is another strength. Exposure was based on high-spatial resolution data from an established emissions–dispersion model that allowed for breakdown of particles by size and source. Nonetheless, limitations to our exposure assessment should be considered in interpreting the results. Exposure was based at residence and therefore does not take into account the influence of specific activities (eg, commuting) or other locations (eg, workplace) on exposure. Residential stability, penetration of outdoor PM and other pollutants indoors, and indoor sources were also not explicitly accounted for. Nonetheless, the majority of participants did not move in the 5 years prior to the 2002–2004 assessment: for 81% the postcode centre was identical, and for 88% the postcode centre moved less than 100 m. Also, the role of air conditioning in exposure misclassification is likely to be negligible given that less than 3% of residences in England have air conditioning units.35 Most of the variability in long-term exposure in this cohort should be from residential exposure, given that the cohort consists of office-based workers, with no significant occupational particle exposures and most worked in central London locations with similar pollution levels. Despite the fine resolution of the exposure model, the gradient in exposures across London was limited, resulting in limited precision in our estimated associations. A further limitation is that we did not have data on exposure to traffic noise, which could have resulted in some residual confounding, particularly for the PM exhaust metrics. Less residual confounding is expected for PM2.5, which is not likely to be as highly correlated with traffic noise. Finally, the analysis of decline in cognitive function was based on 2 assessments roughly 5 years apart. Future analyses using an additional wave of data may be able to improve the precision of our estimates.
In conclusion, this study provides support for an association between particulate air pollution and reasoning and decline over time in memory. The findings in relation to verbal fluency were less conclusive. These results do not support the hypothesis that traffic-related particles are more strongly associated with cognitive function compared with particles from all sources combined. However, the role of particle size and source should be explored in further research with better statistical power to investigate highly correlated exposure metrics. If the relationship between air pollution and cognitive function is causal, interventions to reduce exposure could deliver substantial health benefits given the relatively high global levels and ubiquitous nature of the exposure.
ACKNOWLEDGMENTS
We thank all participants of the Whitehall II Study, as well as all Whitehall II research scientists, study and data managers, and clinical and administrative staff who make the study possible. The UK Medical Research Council, British Heart Foundation, and the US National Institutes of Health have supported collection of data in the Whitehall II Study.
Footnotes
C.T. was funded by the Economic and Social Research Council (RES-064-27-0026). Exposure modeling was funding through grant NE/I008039/1 as part of the Environmental Exposures and Health Initiative. A.S.M. is supported by the US National Institutes of Health (R01AG013196, R01AG034454).
The authors report no conflicts of interest.
Supplemental digital content is available through direct URL citations in the HTML and PDF versions of this article (www.epidem.com). This content is not peer-reviewed or copy-edited; it is the sole responsibility of the authors.
REFERENCES
- 1.Lutz W, Sanderson W, Scherbov S. The coming acceleration of global population ageing. Nature. 2008;451:716–719. doi: 10.1038/nature06516. [DOI] [PubMed] [Google Scholar]
- 2.Oeppen J, Vaupel JW. Demography. Broken limits to life expectancy. Science. 2002;296:1029–1031. doi: 10.1126/science.1069675. [DOI] [PubMed] [Google Scholar]
- 3.Kirkwood TBL. A systematic look at an old problem. Nature. 2008;451:644–647. doi: 10.1038/451644a. [DOI] [PubMed] [Google Scholar]
- 4.Brayne C. The elephant in the room - healthy brains in later life, epidemiology and public health. Nat Rev Neurosci. 2007;8:233–239. doi: 10.1038/nrn2091. [DOI] [PubMed] [Google Scholar]
- 5.Salthouse TA. When does age-related cognitive decline begin? Neurobiol Aging. 2009;30:507–514. doi: 10.1016/j.neurobiolaging.2008.09.023. [DOI] [PMC free article] [PubMed] [Google Scholar]
- 6.Weuve J, Puett RC, Schwartz J, Yanosky JD, Laden F, Grodstein F. Exposure to particulate air pollution and cognitive decline in older women. Arch Intern Med. 2012;172:219–227. doi: 10.1001/archinternmed.2011.683. [DOI] [PMC free article] [PubMed] [Google Scholar]
- 7.Suglia SF, Gryparis A, Wright RO, Schwartz J, Wright RJ. Association of black carbon with cognition among children in a prospective birth cohort study. Am J Epidemiol. 2008;167:280–286. doi: 10.1093/aje/kwm308. [DOI] [PubMed] [Google Scholar]
- 8.Power MC, Weisskopf MG, Alexeeff SE, Coull BA, Spiro A, 3rd, Schwartz J. Traffic-related air pollution and cognitive function in a cohort of older men. Environ Health Perspect. 2011;119:682–687. doi: 10.1289/ehp.1002767. [DOI] [PMC free article] [PubMed] [Google Scholar]
- 9.Guxens M, Sunyer J. A review of epidemiological studies on neuropsychological effects of air pollution. Swiss Med Wkly. 2012;141:w13322. doi: 10.57187/smw.2012.13322. [DOI] [PubMed] [Google Scholar]
- 10.Wellenius GA, Boyle LD, Coull BA, et al. Residential proximity to nearest major roadway and cognitive function in community-dwelling seniors: results from the MOBILIZE Boston Study. J Am Geriatr Soc. 2012;60:2075–2080. doi: 10.1111/j.1532-5415.2012.04195.x. [DOI] [PMC free article] [PubMed] [Google Scholar]
- 11.Ranft U, Schikowski T, Sugiri D, Krutmann J, Krämer U. Long-term exposure to traffic-related particulate matter impairs cognitive function in the elderly. Environ Res. 2009;109:1004–1011. doi: 10.1016/j.envres.2009.08.003. [DOI] [PubMed] [Google Scholar]
- 12.Genc S, Zadeoglulari Z, Fuss SH, Genc K. The adverse effects of air pollution on the nervous system. J Toxicol. 2012;2012:782462. doi: 10.1155/2012/782462. [DOI] [PMC free article] [PubMed] [Google Scholar]
- 13.Marmot M, Brunner E. Cohort Profile: the Whitehall II study. Int J Epidemiol. 2005;34:251–256. doi: 10.1093/ije/dyh372. [DOI] [PubMed] [Google Scholar]
- 14.Beevers SD, Kitwiroon N, Williams ML, Kelly FJ, Ross Anderson H, Carslaw DC. Air pollution dispersion models for human exposure predictions in London. J Expo Sci Environ Epidemiol. 2013;23:647–653. doi: 10.1038/jes.2013.6. [DOI] [PubMed] [Google Scholar]
- 15.Kelly F, Anderson RH, Armstrong B, et al. The Impact of the Congestion Charging Scheme on Air Quality in London: Part 1. Health Effects Institute Research Report 155. 2011. [PubMed] [Google Scholar]
- 16.Cambridge Environmental Research Consultants. 2006. http://www.cerc.co.uk/environmental-software/assets/data/doc_userguides/CERC_ADMS-RoadsExtra3.1_User_Guide.pdf. Accessed 15 April 2012.
- 17.Greater London Authority. 2008. http://data.london.gov.uk/laei-2008. Accessed 15 April 2012.
- 18.Singh-Manoux A, Kivimaki M, Glymour MM, et al. Timing of onset of cognitive decline: results from Whitehall II prospective cohort study. BMJ. 2012;344:d7622. doi: 10.1136/bmj.d7622. [DOI] [PMC free article] [PubMed] [Google Scholar]
- 19.Sabia S, Elbaz A, Dugravot A, et al. Impact of smoking on cognitive decline in early old age: the Whitehall II cohort study. Arch Gen Psychiatry. 2012;69:627–635. doi: 10.1001/archgenpsychiatry.2011.2016. [DOI] [PMC free article] [PubMed] [Google Scholar]
- 20.Radloff SL. The CES-D: a self-report depression scale for research in the general population. Appl Psycholo Measure. 1977;1:385–401. [Google Scholar]
- 21.Department for Communities and Local Government. 2012. https://www.gov.uk/government/organisations/department-for-communities-and-local-government/series/english-indices-of-deprivation. Accessed 1 May 2011.
- 22.Gorelick PB, Scuteri A, Black SE, et al. American Heart Association Stroke Council, Council on Epidemiology and Prevention, Council on Cardiovascular Nursing, Council on Cardiovascular Radiology and Intervention, and Council on Cardiovascular Surgery and Anesthesia. Vascular contributions to cognitive impairment and dementia: a statement for healthcare professionals from the american heart association/american stroke association. Stroke. 2011;42:2672–2713. doi: 10.1161/STR.0b013e3182299496. [DOI] [PMC free article] [PubMed] [Google Scholar]
- 23.Künzli N, Jerrett M, Mack WJ, et al. Ambient air pollution and atherosclerosis in Los Angeles. Environ Health Perspect. 2005;113:201–206. doi: 10.1289/ehp.7523. [DOI] [PMC free article] [PubMed] [Google Scholar]
- 24.Tonne C, Yanosky JD, Beevers S, Wilkinson P, Kelly FJ. PM mass concentration and PM oxidative potential in relation to carotid intima-media thickness. Epidemiology. 2012;23:486–494. doi: 10.1097/EDE.0b013e31824e613e. [DOI] [PubMed] [Google Scholar]
- 25.Wilker EH, Mittleman MA, Coull BA, et al. Long-term exposure to black carbon and carotid intima-media thickness: the normative aging study. Environ Health Perspect. 2013;121:1061–1067. doi: 10.1289/ehp.1104845. [DOI] [PMC free article] [PubMed] [Google Scholar]
- 26.Wu CF, Kuo IC, Su TC, et al. Effects of personal exposure to particulate matter and ozone on arterial stiffness and heart rate variability in healthy adults. Am J Epidemiol. 2010;171:1299–1309. doi: 10.1093/aje/kwq060. [DOI] [PubMed] [Google Scholar]
- 27.Park SK, O’Neill MS, Vokonas PS, et al. Traffic-related particles are associated with elevated homocysteine: the VA normative aging study. Am J Respir Crit Care Med. 2008;178:283–289. doi: 10.1164/rccm.200708-1286OC. [DOI] [PMC free article] [PubMed] [Google Scholar]
- 28.Auchincloss AH, Diez Roux AV, Dvonch JT, et al. Associations between recent exposure to ambient fine particulate matter and blood pressure in the Multi-ethnic Study of Atherosclerosis (MESA). Environ Health Perspect. 2008;116:486–491. doi: 10.1289/ehp.10899. [DOI] [PMC free article] [PubMed] [Google Scholar]
- 29.Krämer U, Herder C, Sugiri D, et al. Traffic-related air pollution and incident type 2 diabetes: results from the SALIA cohort study. Environ Health Perspect. 2010;118:1273–1279. doi: 10.1289/ehp.0901689. [DOI] [PMC free article] [PubMed] [Google Scholar]
- 30.Delfino RJ, Staimer N, Tjoa T, et al. Circulating biomarkers of inflammation, antioxidant activity, and platelet activation are associated with primary combustion aerosols in subjects with coronary artery disease. Environ Health Perspect. 2008;116:898–906. doi: 10.1289/ehp.11189. [DOI] [PMC free article] [PubMed] [Google Scholar]
- 31.Rückerl R, Schneider A, Breitner S, Cyrys J, Peters A. Health effects of particulate air pollution: a review of epidemiological evidence. Inhal Toxicol. 2011;23:555–592. doi: 10.3109/08958378.2011.593587. [DOI] [PubMed] [Google Scholar]
- 32.Block ML, Calderón-Garcidueñas L. Air pollution: mechanisms of neuroinflammation and CNS disease. Trends Neurosci. 2009;32:506–516. doi: 10.1016/j.tins.2009.05.009. [DOI] [PMC free article] [PubMed] [Google Scholar]
- 33.Calderón-Garcidueñas L, Mora-Tiscareño A, Ontiveros E, et al. Air pollution, cognitive deficits and brain abnormalities: a pilot study with children and dogs. Brain Cogn. 2008;68:117–127. doi: 10.1016/j.bandc.2008.04.008. [DOI] [PubMed] [Google Scholar]
- 34.Calderón-Garcidueñas L, Solt AC, Henríquez-Roldán C, et al. Long-term air pollution exposure is associated with neuroinflammation, an altered innate immune response, disruption of the blood-brain barrier, ultrafine particulate deposition, and accumulation of amyloid beta-42 and alpha-synuclein in children and young adults. Toxicol Pathol. 2008;36:289–310. doi: 10.1177/0192623307313011. [DOI] [PubMed] [Google Scholar]
- 35.Energy Follow-up Survey 2011. Report 9: Domestic appliances, cooking and cooling equipment. UK Department of Energy and Climate Change. 2013. Available from: https://www.gov.uk/government/uploads/system/uploads/attachment_data/file/274778/9_Domestic_appliances__cooking_and_cooling_equipment.pdf. Accessed 10 February 2014.