Abstract
Venous thromboembolism (VTE) is a common and important cause of death in hospital patients. We therefore investigated possible associations between the introduction of the compulsory national VTE risk assessment tool in England in 2010 and patient outcomes. A retrospective database study, using data from the Health and Social Care Information Centre and Office of National Statistics, was undertaken. The main outcome measures were VTE-related secondary diagnosis rates, 30-day and 90-day readmission rates and mortality rates. The observed mean VTE-related secondary diagnosis rate for 2011–2012 was 91% of the rate estimated from a linear regression model of the data for 2006–2007 to 2010–2011 (P = 0.001). Similarly, the observed mean 30-day VTE-related readmission rate for 2011 was 96% of the estimated rate (P = 0.067) and the observed mean 90-day VTE-related readmission rate for 2011 was 96% of the estimated rate (P = 0.022). The observed annual VTE-related national mortality rate was 91% of the estimated rate for 2011 and 92% of the estimated rate for 2012. This study shows a reduction in VTE-related secondary diagnoses and readmissions among adults admitted to hospital, and a reduction in VTE-related population mortality, since the introduction of a national VTE risk assessment screening tool in England. Despite some study limitations, this suggests that the concerted effort made by NHS England to improve prevention of hospital-acquired VTE has been successful.
Keywords: deep vein thrombosis, prophylaxis, pulmonary embolism, risk assessment, venous thromboembolism
Introduction
Venous thromboembolism (VTE) consists of two related conditions, deep vein thrombosis and pulmonary embolism. Hospital-acquired VTE is a common and important cause of death [1,2] and is associated with considerable cost [1,3]. Diagnosis is complicated by the fact that VTE is often asymptomatic, a large proportion of deep vein thrombosis displaying no symptoms and death often being the first sign of a pulmonary embolism. In addition, nonfatal symptomatic VTEs occur more frequently than fatal VTEs and are associated with significant morbidity, long-term complications and increased consumption of healthcare resources [1,2,4,5]. Appropriate use of thromboprophylaxis in hospitalized patients at risk for VTE significantly reduces its incidence [6–8], and therefore has the potential to deliver cost savings and a reduction in morbidity and mortality.
A series of national policy initiatives has been launched in England to reduce the burden of VTE. In 2009, the Department of Health launched a National VTE Prevention Programme with the goal of reducing avoidable death, disability and chronic ill health from hospital-acquired VTE. At its heart is VTE risk assessment of adult patients upon hospital admission, coupled with appropriate prophylaxis of those at risk. The Department of Health national VTE risk assessment tool was updated and rolled out to all National Health Service (NHS) Service Providers in England simultaneously in 2010 with the National Institute for Health and Care Excellence (NICE) recommending that: ‘All patients, on admission, receive an assessment of VTE and bleeding risk using the clinical risk assessment criteria described in the national tool’ [9,10]. To encourage compliance mandatory risk assessment data collection was introduced, with all providers of NHS-funded acute care being required to return data, collected locally and reported centrally, to the Department of Health. This was linked to the national Commissioning for Quality and Innovation payment framework for 2010–2011 to financially incentivize hospital trusts to meet the VTE risk assessment screening target of 90% of hospitalized patients. These measures were continued into 2011–2012 and appear to have achieved the desired effect, as 93.4% of adult patients admitted to NHS-funded care between April and June 2012 received a VTE risk assessment, compared with 52.5% between July and September 2010 [11]. To date, however, no detailed assessment of the impact of introduction of the national VTE risk assessment tool has been carried out to establish whether this increased rate of risk assessment has impacted on patient outcomes.
Therefore, we investigated possible relationships between increased levels of VTE risk assessment screening and relevant patient outcomes. Secondary diagnosis rates can be used as an indicator of in-hospital complications and to focus quality improvement efforts [12]. They may therefore measure the impact that risk assessment is having, not only in the identification of at-risk patients but also on their management. Similarly, we were also interested in readmission rates, as these are generally indicative of poor patient management and are a common measure of hospital quality of care [13]. Finally, as VTE is an important cause of death, mortality rates were of interest. Our analysis therefore focused on the impact of the national VTE risk assessment tool on VTE-related secondary diagnosis rates, readmission rates and mortality rates.
Materials and methods
Methodological approach
It was not possible to evaluate the effect of VTE risk assessment screening by comparing ‘treatment and control’ groups as the tool was introduced to all hospital trusts in England simultaneously. We therefore needed an approach that would assess the impact of a change over time on an entire population. Accordingly, a literature review was conducted to identify suitable methodological approaches. We identified an analysis that was used to assess whether the high levels of quality of primary care in England attained after the introduction of pay-for-performance (P4P) reflected improvements that were already underway or whether the P4P scheme had accelerated improvement [14]. As the P4P financial incentives were introduced simultaneously across the whole country, no control group was available and scores for observed quality in 2005 were compared statistically with those estimated on the basis of the trend observed between 1998 and 2003. A similar approach could be used to assess the impact of VTE risk assessment screening as secondary diagnoses, readmissions and mortality data were available before and after the introduction of the nationwide tool.
Definition of venous thromboembolism
For analysis of readmissions and secondary diagnoses we defined VTE according to the subset of International Classification of Diseases 10th revision (ICD-10) codes used by the UK All Party Parliamentary Thrombosis Group to question hospitals about VTE incidence [15], both for consistency and to capture all possible effects. For analysis of VTE-related mortality, VTE was defined according to the standard subset of ICD-10 codes used by the Office of National Statistics (ONS) [16].
We obtained monthly secondary diagnoses, 30-day, 60-day and 90-day readmissions, and admissions data from the Health and Social Care Information Centre as Hospital Episode Statistics at NHS hospital trust level, from financial years 2006–2007 to 2011–2012. Readmission and secondary diagnosis analyses were based on data from 152 hospital trusts in England, which constitutes the majority of these NHS Service Providers. A small number of trusts were omitted owing to insufficient data being available to allow for meaningful estimations and wherever the admission numbers were low, leading to highly variable numbers of readmissions and secondary diagnoses.
We obtained general mortality and population data from the ONS [17,18]. Mid-year population estimates were used for 2006–2012. Underlying VTE mortality data were obtained from the ONS at a national level from 2007 to 2012.
Secondary diagnoses, readmissions and mortality data were screened for the appropriately defined ICD-10 codes.
For the calculation of VTE-related secondary diagnosis rates, it was assumed that any secondary diagnoses occurred in the same month as admission. Monthly VTE-related secondary diagnosis values were combined to obtain annual VTE-related secondary diagnosis values for 2006–2007 to 2011–2012 for each hospital trust. VTE-related secondary diagnosis rates (per 100 000 admissions) for each year were calculated using annual admissions data for each hospital trust. We estimated the VTE-related secondary diagnosis rates expected in 2011–2012 for each hospital trust, based on a linear regression model of the data from 2006–2007 to 2010–20/11 against time. We compared the mean estimated 2011–2012 rate with the mean observed data using a matched-pair, two-tailed t test.
The calculation of VTE-related readmission rates posed a challenge, as the 30-day and 90-day readmissions in any particular month would not relate to the admissions that month. Furthermore, readmission values for any particular month are cumulative, so the 30-day value is contained within the 90-day value. It was therefore assumed that total monthly admissions and readmissions occurred at the end of each month. For example, the 30-day readmissions relating to admissions in April 2006 are those 30-day readmissions in May 2006. In the same way, the 90-day readmissions relating to admissions in April 2006 are those 30-day readmissions in May 2006 + (those 60-day readmissions in June 2006 – those 30-day readmissions in June 2006) + (those 90-day readmissions in July – those 60-day readmissions in July). We applied these calculations to VTE-related readmissions data for each hospital trust for the years 2006–2007 to 2011–2012.
Monthly VTE-related readmissions values were combined to obtain annual VTE-related readmissions values for each year for each hospital trust. VTE-related readmission rates (per 100 000 admissions) for each calendar year were calculated using annual admissions data for each hospital trust. The change from NHS financial year to calendar year is a consequence of the data adjustment described above, which negates data points between January and March 2012. We estimated the VTE-related readmission rates expected in 2011 for each hospital trust, based on a linear regression model of the data from 2007 to 2010 against time. We compared the mean estimated 2011 rate with the mean observed data using a matched-pair, two-tailed t test.
VTE-related mortality rates were calculated from VTE-related mortality and general population data. As ICD-10 coded mortality data were only obtained from the ONS at a national level, it was not possible to conduct a mean difference analysis. A simple time trend analysis was therefore undertaken. The annual VTE-related mortality rate (per 100 000 of the population) was calculated by applying the annual population estimates provided by the ONS to the annual VTE recorded deaths, defined as those where the underlying cause of death reported on the death certificate corresponded to one of the predefined ICD-10 codes. Estimation of the expected VTE-related mortality rates for 2011 and 2012, based on a linear regression model of the annual mortality rate data for 2007 to 2010 against time, was calculated for comparison with the observed data. Summary statistics of the 2007 to 2010 annual data set were produced and the observed 2011 and 2012 VTE-related mortality rates were compared with the 95% confidence interval (CI) around the estimated 2011 and 2012 rates.
Statistical analysis
Statistical analyses were undertaken using STATA v11.0. In general, statistical significance is assumed at the 5% level (P < 0.05), although weak statistical significance is assumed at the 10% level (P < 0.10).
Results
Secondary diagnoses
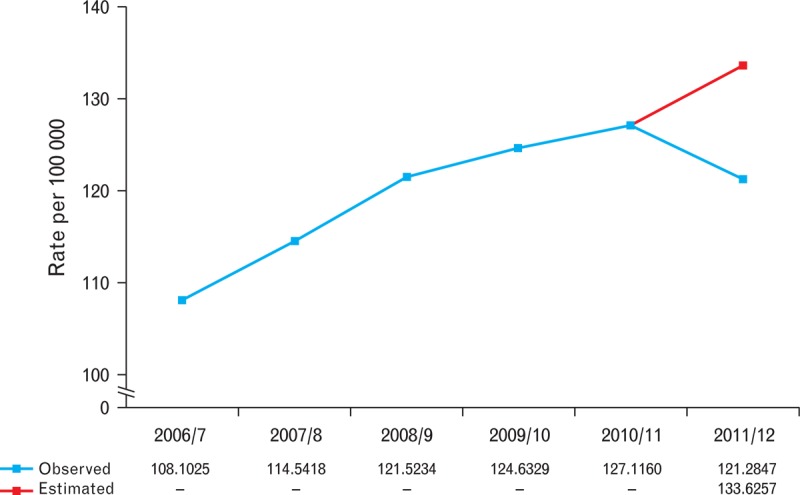
The observed mean VTE-related secondary diagnosis rate for 2011–2012 was lower than estimated, at 91% of the estimated rate (Fig. 1, Table 1) and the difference between the observed and estimated rates was statistically significant (P = 0.001).
Fig. 1.

Estimated versus observed mean venous thromboembolism-related secondary diagnosis rates.
Table 1.
Estimated and observed mean venous thromboembolism-related secondary diagnosis (2011-2012) and 30-day and 90-day readmission (2011) rates (per 100 000 admissions)
| VTE-related | Estimated mean rate | Observed mean rate | Mean difference (95% CI) | P |
| Secondary diagnosis | 133.626 | 121.285 | 12.341 (5.173 to 19.509) | 0.001 |
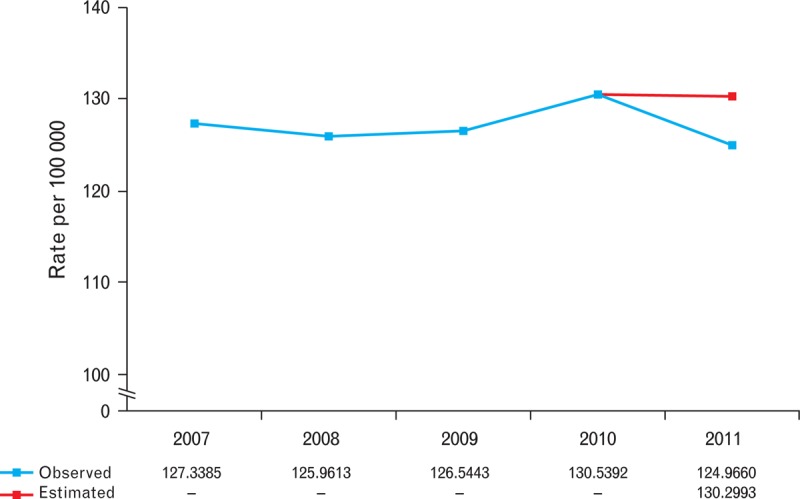
| 30-day readmission | 130.299 | 124.966 | 5.333 (−0.377 to 11.043) | 0.067 |
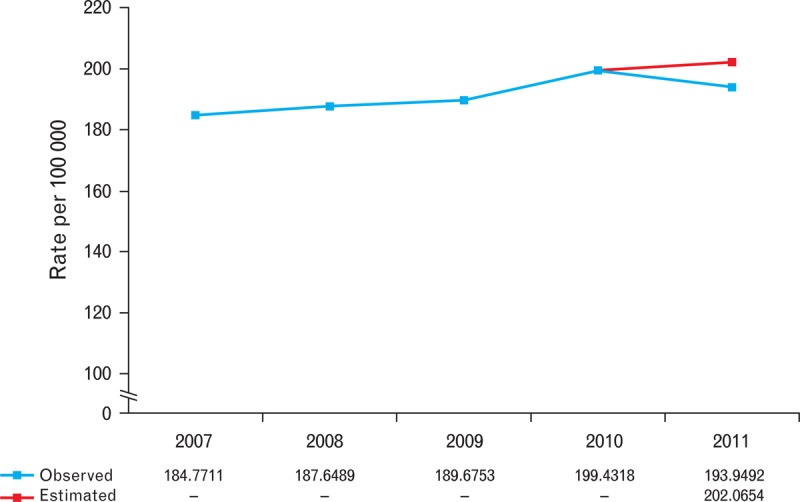
| 90-day readmission | 202.065 | 193.949 | 8.116 (1.194 to 15.039) | 0.022 |
CI, confidence interval; VTE, venous thromboembolism.
Readmissions
The observed mean 30-day VTE-related readmission rate for 2011 was lower than estimated, at 96% of the estimated rate (P = 0.067; Fig. 2, Table 1). The observed mean 90-day VTE-related readmission rate for 2011 was also 96% of the estimated rate (Fig. 3, Table 1) and the difference between the observed and estimated rates was statistically significant (P = 0.022).
Fig. 2.

Estimated versus observed mean 30-day venous thromboembolism-related readmission rates.
Fig. 3.

Estimated versus observed mean 90-day venous thromboembolism-related readmission rates.
Mortality
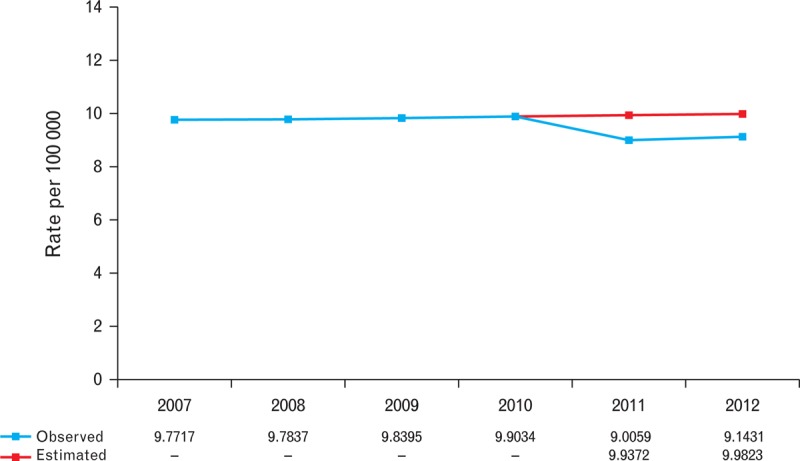
The observed annual VTE-related mortality rate for 2011 was 91% of the estimated rate and for 2012 was 92% of the estimated rate (Fig. 4). The mean (standard deviation) VTE-related annual mortality rate for the years 2007 to 2010 was 9.825 (0.060) per 100 000 of the population. Based on a simple linear regression of these data against time, the estimated VTE-related annual mortality rate for 2011 was 9.937 per 100 000 with a 95% CI of 9.753 to 10.122 per 100 000 and the estimated VTE-related annual mortality rate for 2012 was 9.982 per 100 000 with a 95% CI of 9.761 to 10.204 per 100 000 (Table 2). The observed annual VTE-related mortality rates for 2011 and 2012 (9.006 and 9.134 deaths per 100 000 of the population, respectively) fall well below both the corresponding estimated rates and the lower 95% CI limits of the estimated ranges.
Fig. 4.

Estimated versus observed annual venous thromboembolism-related mortality rates.
Table 2.
Linear regression of venous thromboembolism-related mortality rate (per 100 000 of the population) versus time
| Variable | Coefficient (95% CI) | 2011 MR Est. (95% CI) | 2011 MR Obs. | 2012 MR Est. (95% CI) | 2012 MR Obs. |
| Time | 0.0451 (0.008 to 0.082) | 9.937 (9.753 to 10.122) | 9.006 | 9.982 (9.761 to 10.204) | 9.143 |
CI, confidence interval; Est, estimated; MR, mortality rate; Obs, observed.
Discussion
The general trend over the years preceding the introduction of the national VTE risk assessment tool in 2010 was one of an increasing proportion of adults receiving a secondary diagnosis of VTE after hospital admission, together with higher VTE-related readmission rates. In the first full year after the introduction of the national screening tool, reductions were observed in both secondary diagnosis and readmission rates. The differences between the observed and estimated secondary diagnosis and 90-day readmission rates were statistically significant. Mortality with VTE as an underlying cause increased slowly between 2007 and 2010. There was a reduction in VTE-related mortality in 2011, both compared with the estimated rate for 2011 and the actual rates between 2007 and 2010. Indeed, the observed mortality rate for 2011 lay well below the lower 95% CI limit associated with the mortality rate estimation. This reduction was then essentially maintained in 2012.
Based on the results of this analysis, with approximately 15 million hospital admissions across England in 2011, we estimate that around 2000 secondary diagnoses and 1 200 90-day readmissions have been avoided. Similarly, with a population of over 53 million in England in 2011 and 2012, around 940 deaths owing to VTE have been avoided. Clearly though, an important question is whether these improvements in patient outcomes can be attributed solely to the introduction of the national VTE risk assessment tool or whether there are other factors at play. In particular, the study is unable to determine whether a reduction in the mortality rate, in such a short space of time, can be solely because of the introduction of the screening tool. In support of a positive impact of screening, it is known that administration of appropriate thromboprophylaxis will significantly reduce the incidence of VTE events in patients identified as being at risk [6–8]. As VTE is a common and important cause of mortality in hospital patients [1,2], it is possible that rapid mortality rate reductions may be achievable if appropriate prophylaxis is administered. It is also interesting to note that there was a consistent and sizeable reduction between estimated and observed VTE-related mortality rates in both 2011 and 2012 and that the reductions observed were higher than those noted in the age standardized population as a whole [17]. In addition, after the policy initiatives of 2010, there were no further significant changes in recommendations for identification and treatment of patients at risk of VTE throughout the analysis period. Therefore, it is likely that our data show the effectiveness of the national VTE risk assessment screening tool.
This study has a number of strengths, including the use of national databases and a large sample size. We also identified methodology that was designed to compare observed data with estimations based on observed trends over time. However, this study also has some limitations. First, owing to the way in which the VTE risk assessment tool was introduced simultaneously in 2010 across all NHS service providers in England, it was not possible to assess the impact of its introduction in comparison with a suitable control group. This restricted analyses to a comparison of estimated versus observed rates based on trends over time. Secondly, because of the nature of the data obtained from the ONS, it was not possible to compare the observed and estimated mortality rates by statistical analysis of mean differences, further restricting the analysis to a more naive assessment. Finally, the mortality data obtained were at a national level. This will include both hospital and nonhospital VTE-related mortality and therefore may not fully reflect the impact that introduction of the VTE risk assessment tool within the NHS in England has had.
Conclusion
This study shows reductions in VTE-related secondary diagnoses and readmissions among adults admitted to hospital, and a reduction in VTE-related mortality, since the introduction of a national VTE risk assessment screening tool in England. Despite some study limitations, the findings suggest that the concerted effort that has been made by NHS England to improve prevention of hospital-acquired VTE has been successful and indicates that introduction of compulsory VTE risk assessment in hospitals positively impacts patient outcomes.
Acknowledgements
D.C. would like to thank Victoria Serra-Sastre of City University, London, and Charlie Nicholls and Carl Tilling of Sanofi for helpful discussions and advice. Jennifer Stewart, MSc (QXV Communications, UK) provided editorial support.
Hospital Episode Statistics data were provided under reuse licence by Harvey Walsh Limited, Copyright 2012, and were reused with the permission from the Health and Social Care Information Centre. All rights reserved.
D.C. has subsequently become a permanent employee of Sanofi.
Ethical approval was not required.
Due to the nature of this study there are no recognized checklists that were applicable.
Data sets and technical details are available from the corresponding author at David.Catterick@sanofi.com
Conflicts of interest
D.C. held a paid student internship at Sanofi, UK, during the study period (This study was conducted in part fulfilment of an MSc in Economic Evaluation in Healthcare from City University, London, and was supported by Sanofi as part of the author's education. Sanofi provided assistance in access to statistical tools, detailed Hospital Episode Statistics data, and editorial support; however, they had no direct role in the study design, analysis, or reporting of the study. D.C. had final responsibility for the decision to submit for publication.) B.J.H. reported that no potential conflicts of interest exist with any companies/organisations whose products or services may be discussed in this article.
References
- 1.House of Commons Health Committee Report. The prevention of venous thromboembolism in hospitalised patients, 2005. http://www.publications.parliament.uk/pa/cm200405/cmselect/cmhealth/99/99.pdf [Accessed 31 May 2013] [Google Scholar]
- 2.Nutescu E. Assessing, preventing, and treating venous thromboembolism: evidence-based approaches. Am J Health Syst Pharm 2007; 64 Suppl 7:S5–S13 [DOI] [PubMed] [Google Scholar]
- 3.National Institute of Clinical Excellence. Venous thromboembolism: reducing the risk of venous thromboembolism (deep vein thrombosis and pulmonary embolism) in in-patients. Clinical Guideline 92, 2010. http://guidance.nice.org.uk/CG92 [Accessed 31 May 2013] [Google Scholar]
- 4.Kearon C. Natural history of venous thromboembolism. Circulation 2003; 107 (23 Suppl 1):I22–I30 [DOI] [PubMed] [Google Scholar]
- 5.Pengo V, Lensing A, Prins M, Marchiori A, Davidson BL, Tiozzo F, et al. Incidence of chronic thromboembolic pulmonary hypertension after pulmonary embolism. N Engl J Med 2004; 350:2257–2264 [DOI] [PubMed] [Google Scholar]
- 6.Prevention of fatal postoperative pulmonary embolism by low doses of heparin. An international multicentre trial. Lancet 1975; 306:45–51 [PubMed] [Google Scholar]
- 7.Cohen A, Edmondson R, Phillips MJ, Ward VP, Kakkar VV. The changing pattern of venous thromboembolic disease. Haemostasis 1996; 26:65–71 [DOI] [PubMed] [Google Scholar]
- 8.Samama MM, Cohen AT, Darmon JY, Desjardins L, Eldor A, Janbon C, et al. A comparison of enoxaparin with placebo for the prevention of venous thromboembolism in acutely ill medical patients. N Engl J Med 1999; 341:793–800 [DOI] [PubMed] [Google Scholar]
- 9.Department of Health. Venous thromboembolism (VTE) risk assessment. Publications policy and guidance, 2010. http://webarchive.nationalarchives.gov.uk/20130107105354/http://www.dh.gov.uk/en/Publicationsandstatistics/Publications/PublicationsPolicyAndGuidance/DH_088215 [Accessed 31 May 2013] [Google Scholar]
- 10.National Institute of Clinical Excellence. VTE prevention quality standard. Quality Standards QS3, 2010. http://publications.nice.org.uk/venous-thromboembolism-prevention-quality-standard-qs3 [Accessed 31 May 2013] [Google Scholar]
- 11.Department of Health. VTE data tables. Data statistics and transparency, 2013. http://transparency.dh.gov.uk/2011/04/01/vte-data/ [Accessed 31 May 2013] [Google Scholar]
- 12.Hughes JS, Averill RF, Goldfield NI, Gay JC, Muldoon J, McCullough E, et al. Identifying potentially preventable complications using a present on admission indicator. Healthcare Financ Rev 2006; 27:63–82 [PMC free article] [PubMed] [Google Scholar]
- 13.van Walraven C, Jennings A, Forster AJ. A meta-analysis of hospital 30-day avoidable readmission rates. J Eval Clin Pract 2012; 18:1211–1218 [DOI] [PubMed] [Google Scholar]
- 14.Campbell S, Reeves D, Kontopantelis E, Middleton E, Sibbald B, Roland M. Quality of primary care in England with the introduction of pay for performance. N Engl J Med 2007; 357:181–190 [DOI] [PubMed] [Google Scholar]
- 15.All-Party Parliamentary Thrombosis Group. APPTG Research Report, November 2011: Fifth annual audit of acute NHS trusts VTE policies. APPTG Research Reports. http://apptg.org.uk/?page_id=58 [Accessed 31 May 2013] [Google Scholar]
- 16.Office for National Statistics: Pulmonary embolism defined as I26.0 and I26.9; Deep vein thrombosis defined as I80.1, I80.2, I80.3, I80.9 and I82.9. [Google Scholar]
- 17.Office for National Statistics. Quarterly births and deaths data, Vital statistics: population and health reference tables, winter 2012 update. http://www.ons.gov.uk/ons/publications/re-reference-tables.html?edition=tcm%3A77-283563 [Accessed 31 May 2013] [Google Scholar]
- 18.Office for National Statistics. Population. http://www.ons.gov.uk/ons/taxonomy/index.html?nscl=Population [Accessed 31 May 2013] [Google Scholar]


