Abstract
There is an inherent trade-off between transverse resolution and depth of field (DOF) in optical coherence tomography (OCT) which becomes a limiting factor for certain applications. Multifocal OCT and interferometric synthetic aperture microscopy (ISAM) each provide a distinct solution to the trade-off through modification to the experiment or via post-processing, respectively. In this paper, we have solved the inverse problem of multifocal OCT and present a general algorithm for combining multiple ISAM datasets. Multifocal ISAM (MISAM) uses a regularized combination of the resampled datasets to bring advantages of both multifocal OCT and ISAM to achieve optimal transverse resolution, extended effective DOF and improved signal-to-noise ratio. We present theory, simulation and experimental results.
OCIS codes: (110.4500) Optical coherence tomography, (110.1758) Computational imaging, (100.3190) Inverse problems, (100.6890) Three-dimensional image processing
1. Introduction
Optical coherence tomography (OCT), is an optical imaging method that reveals the 3D structure of semitransparent samples with micron-resolution [1–6]. OCT has proved useful in many fields including ophthalmology [7–12], dermatology [13–15], and cardiology [16], among many others. We present a method of 3-D optical imaging that combines multifocal OCT and interferometeric synthetic aperture microscopy (ISAM).
In OCT, two of the more important figures of merit are DOF and transverse resolution. However, using Gaussian beam optics, it is impossible to improve both at the same time. For a given OCT system, the transverse resolution at each depth is equivalent to the width of the scanning beam at that depth. The transverse resolution is best on the focal plane, where the scanning beam has minimum beam width. For given free space wavelength λ0, free space numerical aperture NA0 and media refractive index n, the beam waist radius is w0 = λ0/(nπNA0). The transverse resolution degrades as the position of reconstruction is further away from focal plane, where the scanning beam diverges in width. For a Gaussian beam propagating in the z direction, with focal plane at z0, the beam radius can be expressed as
| (1) |
Because of the beam-spreading, the reconstructed image becomes defocused at positions far away from the focal plane. Therefore, the DOF of the OCT system is usually taken to be within a Rayleigh range (ZR) of the focal plane on both sides. The Rayleigh range is defined as the distance from the focal plane to the plane where . It can be expressed as
| (2) |
which is proportional to the square of the transverse resolution.
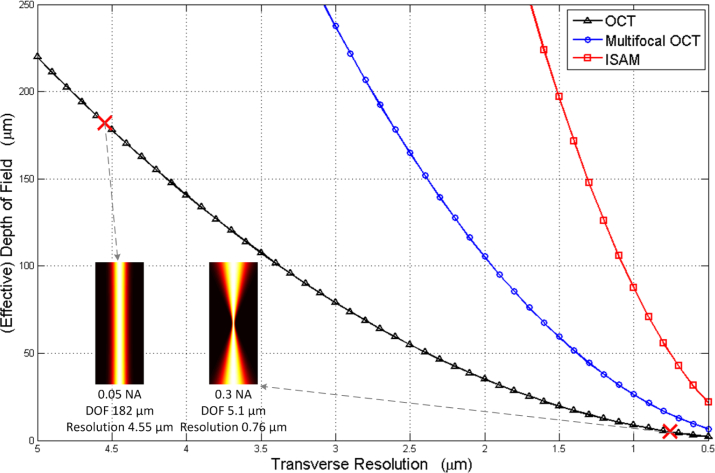
Thus, the DOF is a function of resolution as shown in Fig. 1, where the wavelength is taken to be 1 μm and the sample refractive index is 1.4. For example, if the desired transverse resolution is 0.76 μm on the above mentioned condition, which can be achieved by using a 0.3 NA scanning beam, the achievable DOF is 5.1 μm, as can be seen at the lower sample point in Fig. 1. On the other hand, if the DOF is increased to 182 μm, which can be implemented using a 0.05 NA scanning beam, the best possible transverse resolution degrades to 4.55 μm, as can be seen at the upper sample point.
Fig. 1.
Trade-off between the (effective) DOF and transverse resolution in OCT, multifocal OCT and ISAM, at wavelength of 1 μm and with refractive index of 1.4.
Although OCT is limited by the above-mentioned trade-off, it is possible to mitigate the trade-off by improving either the physical setup or the reconstruction algorithm. Recent solutions include Bessel beam OCT, interferometric synthetic aperture microscopy (ISAM), and multifocal OCT, each have their own advantages and challenges.
Bessel beam OCT [17,18] uses Bessel beam for illuminating the sample to achieve all-optical DOF extension. The Bessel beam is generated using an axicon lens. The scattered signal is collected using either the axicon lens or a conventional objective lens. This method trades for larger DOF at the cost of higher side lobes.
Multifocal OCT, also called multibeam OCT or multichannel OCT [19, 20], is a version of OCT where multiple apertures are used simultaneously in scanning. Each aperture is focused at a different depth during the scan. One set of OCT data is collected from each aperture. An image stitching method is used to combine each set of data, where the part with the best transverse resolution from each set of data are stitched into the final reconstruction. Compared with each set of OCT data, the multifocal OCT image shows an improved resolution over the whole depth, or from another point of view, enables a larger DOF. Consider the case of a multifocal OCT system with 3 identical apertures. The distance between two adjacent focal planes is taken to be 2 Rayleigh ranges. The blue curve in Fig. 1 plots the trade-off curve of multifocal OCT. As three stacked apertures are used, for any value of transverse resolution, multifocal OCT provides 3 times the DOF compared with OCT; or on the other hand, for the same desired DOF, multifocal OCT can achieve improved transverse resolution compared to OCT. Even more apertures can be used at the cost of additional setup complexity. Multifocal OCT also faces challenges such as intensity discontinuities along stitching edges in the reconstructed image [19, 20]. Although artificial blending can be used to mitigate this effect [21], it is not physically derived and thus does not always provide accurate image reconstruction.
The ISAM experiment is similar to that of OCT. ISAM takes the OCT data and corrects for the spreading of the beam using the solution to the inverse problem of OCT [22–27]. The algorithm can be efficiently implemented using a frequency domain resampling technique [25, 28], which can be expressed by
| (3) |
where r is the space coordinate; k is the wavevector; k‖ and r‖ are the vector projection onto the plane normal to the z axis, i.e. the beam axis; and β is the longitudinal spatial frequency. The expression 〈k‖, k0|S〉 is the 2-D Fourier transform of 〈r‖, k0|S〉. 〈r‖, k0|S〉 represents the OCT data |S〉 collected at transverse position r‖ and wavenumber k0. In the equation, k0 is replaced with , which represents a set of calculated grid points to be resampled onto each β. The inner product 〈r‖|k‖〉 = (2π)−1exp(−ik‖ · r‖), and 〈z| − β〉 = (2π)−1/2exp(izβ). 〈r|η〉 is the sample susceptibility at position r. The expression w(z − z0) is the beam radius at depth z with the focal plane at z = z0, as is defined in Eq. (1). The factor H depends on k‖, k0, and position of the focal plane zn of the nth beam focus. This equation is similar to Eq. (19.32) in [28] except that the expression |z − z0| in [28] are replaced by w(z − z0), which generalizes the asymptotic results at both near focus and far from focus, and provides a smooth transition in between.
Because the DOF of OCT is infinitely extended by applying the algorithm, ISAM is able to provide spatially invariant resolution, as opposed to the decaying transverse resolution of OCT along depth axis. ISAM has been validated and is proved to provide accurate reconstruction with focal-plane resolution [24, 29].
However, ISAM faces the challenge of signal-to-noise ratio (SNR) decreasing with 1/z as does for standard OCT, which limits its effective DOF [24]. Assuming the SNR at the focal plane is SNR0 (linear), and the lowest tolerable SNR is SNRL, the effective DOF can be expressed as
| (4) |
The red curve in Fig. 1 plots the trade-off curve of ISAM when SNR0/SNRL = 10 as an example. The curve would shift upward or downward linearly with the ratio of SNR0/SNRL for SNR0/SNRL ≫ 1. Compared with multifocal OCT, ISAM further shifts the curve to the upper-right quadrant of the plot, mitigating the trade-off.
2. Multifocal interferometric synthetic aperture microscopy
Seeing the trade-off OCT is facing and the advantages and challenges of ISAM and multifocal OCT, we have developed a new imaging technique which combines the advantages of both multifocal OCT and ISAM. By applying a coherent combination of the reconstruction of each channel with appropriate regularization, higher lateral resolution and signal-to-noise ratio can be achieved without artifacts from the synthesis of the data sets. The experiment is similar to conventional OCT, except multiple channels, each with a different focus, are used.
2.1. Forward model
The sample is again described by a susceptibility |η〉, and the data set by |S〉, but |S〉 is now in a larger Hilbert space. The position of the nth focal spot is denoted rn. Transverse wavevector states are denoted |k‖〉 so that . We start from Eq. (19.26) in [28], which describes the multifocal OCT signal component acquired with illumination focal spot at rm and detection focal spot at rn with wavenumber k0, that is
| (5) |
where again 〈r|η〉 is the sample susceptibility at position r; 〈k0|U0〉 is the field amplitude as a function of wavenumber; is the Fourier transform of the beam waist of the illumination and the detection aperture; K and G are the field propagator and Green’s function operator respectively.
We then assume the transverse-scanning position of the illumination aperture is infinitely close to that of the detection aperture and have the same NA. Therefore, we can set r‖m = r‖n = r‖, g̃m = g̃n = g̃, so that the problem is converted to the single static case with transverse-scanning position r‖, illumination focal plane at depth of zm and detection focal plane at zn. The datum at transverse-scanning position r‖, wavenumber k0, illumination focal plane zm and detection focal plane zn is denoted 〈r‖, k0, zm, zn|S〉. By performing a change of basis and expressing the received signal as the superposition of the contribution from each illumination aperture, the multi-foci version of Eq. (19.29) in [28] can be derived. The signal received at aperture n can be expressed as
| (6) |
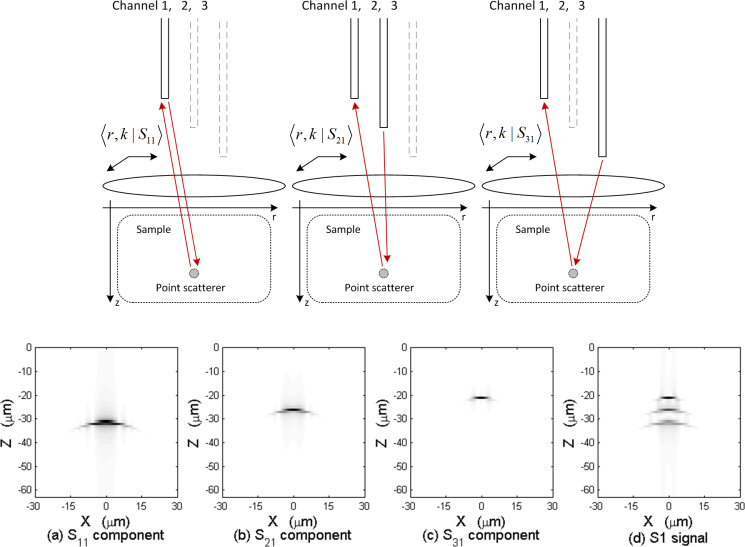
where 〈k‖, z|η〉 is the Fourier transform of 〈r|η〉 with respect to the transverse coordinates. Here , which is the two dimensional Fourier transform of the point spread function of the system, which consists of M stacked components, as can be visualized in Fig. 2.
Fig. 2.
Illustration of the different components of the detected signal and the stacked PSF in multifocal three-channel OCT.
In order to eliminate the stacked point spread function which is computationally too expensive to deconvolve, we assume that the path-length difference between channels is much larger than the source coherence length so that cross-talk components 〈k‖, k0, zm, zn|S〉 where m ≠ n may be neglected. This can be achieved experimentally by inserting different lengths of fiber before each aperture [30]. With this assumption, the signal detected from the nth aperture only consists of the back-scattering caused by the illumination from itself, resulting a simplified point spread function, as is described by
| (7) |
where
| (8) |
Since only the signals with the same illumination and detection apertures will be considered, 〈k‖, k, zn, zn|S〉 will be denoted as 〈k‖, k, zn|S〉 from now on for brevity. The method of stationary phase can be applied when |zn − z| is large compared to Rayleigh range, where the phase is stationary around [28], resulting in an simplified asymptotics result. The near-focus case can also evaluated by expanding the integral around the k′‖ = k‖/2 [28]. Generalizing both asymptotics results in the far-from-focus regime and the near-focus regime, the forward problem can be expressed as,
| (9) |
where
| (10) |
and wr(z − zn) is defined as the relative beam radius compared to w0,
| (11) |
2.2. Regularized inverse
At this stage we have formed a complete forward model of multifocal OCT which relates the susceptibility distribution |η〉 of the sample to the signal |S〉 detected from the aperture. The next step is to derive its inverse based on the forward problem, which enables us to reconstruct the susceptibility distribution from the detected signal. We start from Eq. (12) below, which is equivalent to Eq. (9),
| (12) |
The detected signal |S〉 can be seen as the result of two operators P and Z acting on the sample susceptibility |η〉, so that |S〉 = PZ|η〉. As is described by Eq. (13), the P operator takes the data and remaps them on to a different grid,
| (13) |
The Z operator takes data from |η〉 and applies a depth-dependent weighting of wr(z − zn)−1 in magnitude in the z dimension, that is
| (14) |
To reconstruct |η〉, we need to derive P+ and Z+, the pseudoinverses of the two operators P and Z, respectively. The reconstructed |η〉 then can be expressed as |η〉 = Z+P+ |S〉.
The pseudoinverse of P can be derived using P+ = (P*P)−1P*, which is of the same form as the inverse operator in ISAM,
| (15) |
Using similar method, the exact inverse of operator Z can also be derived, that is
| (16) |
When noise is considered, the exact inverse does not give the optimum results. For different noise models, the corresponding regularization can be applied by replacing wr(z − zn) with its function, so that
| (17) |
to achieve the least square minimum norm solution.
Thus the general regularized solution to the inverse problem is
| (18) |
Here specifically for the multiplicative noise, Tikhonov regularization promises the least square minimum norm solution of the problem. The regularizer of Tikhonov regularization is
| (19) |
where λ is the regularization parameter. Thus, the Tikhonov regularized solution of the inverse problem is then
| (20) |
where the factor H−1 depends on k‖ and β.
2.3. Implementation
Equation (20) can be implemented based on a conventional ISAM code. Table 1 presents a step-by-step list to aid the implementation. To start with, multiple sets of OCT data should be acquired and pre-processed to compensate for dispersion and to remove the complex conjugate image. The later part of Eq. (20) in the square brackets can be seen as the ISAM reconstruction of each channel, corresponding to steps 2 through 6 in Table 1. Optional aberration compensation using computational adaptive optics (CAO) can be performed at this stage (not included in Eq. (20), and details will be covered in Section 2.5). The MISAM reconstruction is then the weighted sum of the ISAM reconstructions, with the weighting being 1/ [1 +λwr(z − zn)2], corresponding to step 7 and 8 in Table 1.
Table 1.
A step-by-step guide for implementing MISAM.
| 1 | Acquire OCT data with various focal plane depth {z1, z2,..., zN} and preprocess, 〈r‖, k0, zn|S〉 = 〈r‖, k0|Sn〉. |
| 2 | For each dataset, take the 2-D Fourier transform with respect to transverse coordinates, . |
| 3 | For each dataset, apply the inverse filter (optional), 〈k‖, k0|S̃′n〉 = H−1 (k‖, k0) 〈k‖, k0|S̃n〉. |
| 4 | For each dataset, perform the resampling, . |
| 5 | For each dataset, take the 3-D inverse Fourier transform with respect to k‖ and −β, 〈r‖, z| 〉 = (2π)−3/2 ∫ d2k‖dβ exp(−ik‖ · r‖ + iβz) 〈k‖, −β| 〉. |
| 6 | For each dataset, multiply with the relative beam radius function, 〈r‖, z|ηn〉 = wr(z − zn) 〈r‖, z| 〉. |
| 7 | For each dataset, multiply with the weighting, . |
| 8 | Take the sum of all datasets, . |
2.4. Simulation
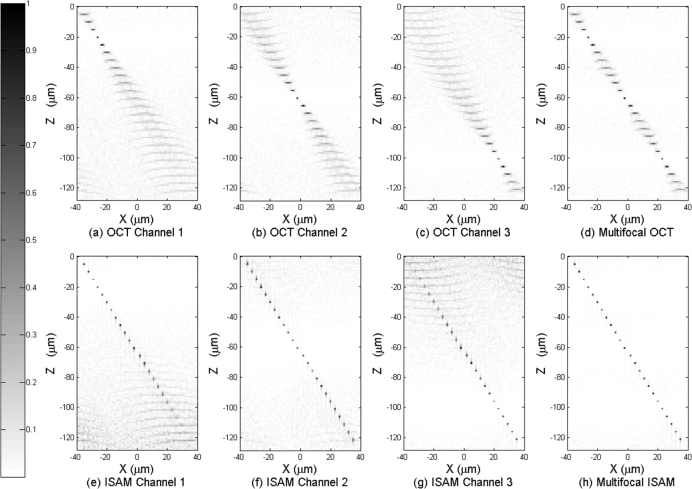
A computer simulation demonstrates the MISAM algorithm in Fig. 3. The sample used in the simulation consists of a series of point-scatterers on the x–z plane with 5 μm separation in depth between neighboring point-scatterers. An OCT system with an NA of 0.75, refractive index of 1, and wavelength of 800 nm to 1000 nm was used, resulting in a transverse resolution of 0.38 μm and a DOF of 1.02 μm in air.
Fig. 3.
Panels (a)–(c) are three channels of OCT data, each focused at −20 μm, −60 μm, and −100 μm respectively, (the contrast has been lowered to show the signal far from focus). Panel (d) is the multifocal OCT reconstruction based on (a)–(c). Panels (e)–(g) are three channels of ISAM reconstruction based on (a)–(c) respectively. Panel (h) is the MISAM reconstruction based on (e)–(g). The MISAM image shows spatially invariant resolution and superior SNR.
The results in Figs. 3(a)–3(c) show how the spreading in the OCT image acquired with focal plane at different depth becomes more severe at large distances from focus. Figure 3(d) shows the stitched image multifocal OCT synthetized from data in Figs. 3(a)–3(c). Although Fig. 3(d) sees an immediate improvement over Figs. 3(a)–3(c), the transverse resolution achieved by multifocal OCT still varies spatially.
The results in Figs. 3(e)–3(g) shows the corresponding ISAM reconstruction from the OCT data in Figs. 3(a)–3(c). Note that significant noise can be seen at lower part of Fig. 3(e) and upper part of Fig. 3(g). The regularization works as a spatial weighting to scale-down the noisy signal far from focus at each channel before the coherent combination. As a result, the noisy part contributes very little to the final reconstruction. The results in Fig. 3(h) show the regularized inverse solution works effectively in correcting the defocus and coherently combining the three datasets to achieve a reconstruction with spatially invariant resolution. Compared with the multifocal OCT image at Fig. 3(d), resolution in Fig. 3(h) again shows a significant improvement.
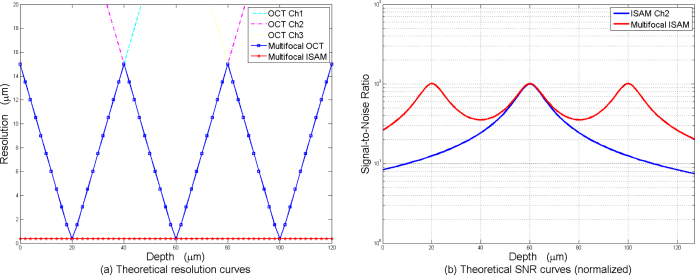
With the same parameters as above, Fig. 4 shows plots of theoretical transverse resolution and signal-to-noise ratio of MISAM compared with multifocal OCT and single channel ISAM. In Fig. 4(a), MISAM shows superior transverse resolution, especially at larger distance from each focus, compared to multifocal OCT. Moreover, in Fig. 4(b), MISAM shows overall superior SNR characteristics, compared to single-focal ISAM. In this case, MISAM provides 200% to 700% improvement in SNR far from focus.
Fig. 4.
(a) Theoretical transverse resolution for three channels of OCT, multifocal OCT and MISAM, based on a three-aperture multifocal OCT system with focal plane at −20 μm, −60 μm, and −100 μm. (b) Theoretical SNR of single-focal ISAM and MISAM, based on the same multifocal OCT system.
2.5. Experimental results
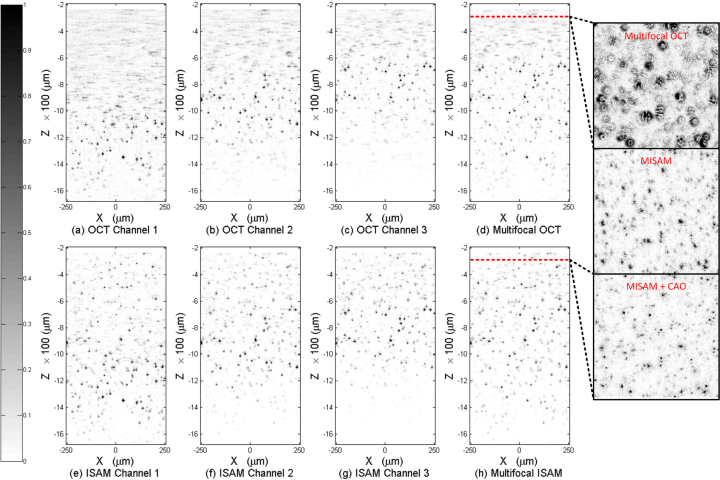
Experimental data have been taken and the regularized inverse for MISAM has been applied to demonstrate the MISAM reconstruction. Three datasets were acquired separately using a single channel SD-OCT setup. The focal plane depths of the scanning beams were adjusted before each scan. As shown in Fig. 5, three datasets (a)–(c) were acquired with focal plane at −1200 μm, −1000 μm, and −800 μm, respectively. The OCT system has a NA of 0.1, and the optical spectrum recorded by the spectrometer had central wavelength of 1330 nm and FWHM bandwidth of 150 nm. Thus, the setup has a transverse resolution of ∼ 7 μm and a Rayleigh range of ∼ 50 μm in air. The sample consists of a collection of sub-resolution sized TiO2 particles embedded in a semitransparent silicone matrix, which has a refractive index of ∼ 1.4.
Fig. 5.
Panels (a)–(c) are three channels of OCT data, each focused at −1200 μm, −1000 μm, and −800 μm respectively. Panel (d) is the multifocal OCT reconstruction based on (a)–(c). Panels (e)–(g) are three channels of ISAM reconstruction based on (a)–(c) respectively. Panel (h) is the MISAM reconstruction based on (e)–(g). Three outsets on the right side show the en face planes of Multifocal OCT, MISAM and MISAM with computed adaptive optics (CAO) at −300 μm.
Figures 5(a)–5(c) are the OCT reconstructions of each set of signals. It can be observed that the reconstructions become defocused far away from their focal plane; thus, each set provides ∼ 200 μm usable effective DOF. After applying the image stitching method over Figs. 5(a)–5(c), Fig. 5(d) is the multifocal OCT reconstruction of the datasets. It provides an effective DOF of ∼ 800 μm, from −600 μm to −1400 μm.
The MISAM algorithm was applied to the three channels of OCT data. Because the datasets were sequentially acquired, they were not phase coherent, thus the absolute value of each dataset were taken before the regularized combination were applied.
Because inexpensively priced lens sets were used for the imaging system, moderate aberration, mainly spherical, were observed in the experimental data, which degrades the imaging quality. In order to eliminate the effect, we have incorporated computational adaptive optics [31, 32] to the datasets. A phase plate H(k‖) = exp[−ikΦh(−2πzf k‖/k0)], where Φh represents the weighted sum of Zernike polynomials, was multiplied to 〈k‖, z|η〉 for each z. The weighting parameters for the Zernike polynomials were searched by a script for each z to optimize for the maximum pixel intensity in the en face plane.
By comparing Fig. 5(d) with Fig. 5(h), it can be observed that after regularized combination and CAO, the reconstruction in h) shows not only higher resolution especially far from focus, but also high SNR throughout all depths. A set of en face planes at the same depth form the multifocal OCT reconstruction, MISAM reconstruction without CAO and MISAM reconstruction with CAO are shown on the right side. It can be observed that MISAM corrects for the spreading seen in multifocal OCT images. Based on the MISAM image, CAO further corrects the aberration of the system to achieve more ideal point spread functions.
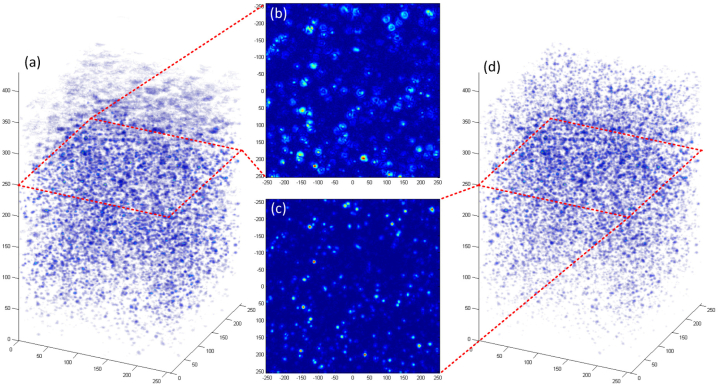
Figure 6 shows a comparison of the three-dimensional rendering of dual-channel multifocal OCT on the left and dual-channel MISAM on the right using only datasets 1 and 3, and also two en face plots at the middle depth between the two focal planes. In addition to the obvious advantage of MISAM at the top and bottom of the reconstruction, this comparison shows that MISAM is able to provide higher quality reconstruction with fewer number of foci than multifocal OCT.
Fig. 6.
Panels (a) and (d) show the three-dimensional volume rendering of size of 500 μm by 500 μm by 1800 μm in depth of multifocal OCT and MISAM constructed with channel 1 and 3. Panels (b) and (c) show the en-face plot of multifocal OCT and MISAM about 200 μm from both focal planes of channel 1 and 3.
3. Conclusion
We have demonstrated multifocal ISAM to achieve improvements in SNR and image quality over OCT alone. In this paper, the method was demonstrated with three focal planes, though the technique can be readily extended to accommodate arbitrary numbers of foci.
Data for MISAM can be acquired either in parallel using a multifocal OCT setup or in series using a conventional OCT setup. For serial acquisition, the OCT scan is repeated multiple times with a variety of different focal depths. Serial acquisition trades longer acquisition time (proportional to number of foci desired) and possible sample drift for lower experimental complexity.
With the aid of computational adaptive optics, inexpensive lenses can be used for data acquisition without severely affecting the imaging quality. This trades computational cost for lower equipment cost. The computational cost for MISAM is proportional to the number of foci desired. Reconstruction at a similar scale to Fig. 5 can be easily performed using a current mainstream notebook computer (Thinkpad X220 with Intel i7-2620m CPU) within one minute. Furthermore, it is possible to implement the algorithm on a GPU using parallel programming language, such as CUDA, to achieve real time reconstruction [33, 34].
MISAM is based on the assumption of the first Born approximation, as is OCT. Under such approximation, single scattering is assumed and higher-order scattering is neglected. In many applications of OCT, this proves to be a good approximation when dealing with many kinds of samples. So for any sample imaged with OCT, MISAM can be applied to produce images with high resolution, large effective DOF, and high SNR. Reconstruction artifacts may appear if the sample is strongly scattering. Although the effective DOF is improved by using MISAM, the effective DOF may still be bounded by penetration depth for samples with low transparency at the scanning wavelength.
We have shown that MISAM can realize the benefits of both single-focus ISAM and multifocal OCT by producing a reconstruction with spatially invariant resolution and theoretically high signal-to-noise over a large range. MISAM provides a physically meaningful method to combine multiple ISAM data from the same sample with different foci to scale up the effective DOF of the image.
Acknowledgments
This research was supported in part by a grant from the National Institutes of Health ( NIBIB, R01 EB012479).
References and links
- 1.Huang D., Swanson E. A., Lin C. P., Schuman J. S., Stinson W. G., Chang W., Hee M. R., Flotte T., Gregory K., Puliafito C. A., Fujimoto J. G., “Optical coherence tomography,” Science 254, 1178–1181 (1991). 10.1126/science.1957169 [DOI] [PMC free article] [PubMed] [Google Scholar]
- 2.Boppart S. A., Bouma B. E., Pitris C., Tearney G. J., Fujimoto J. G., Brezinski M. E., “Forward-imaging instruments for optical coherence tomography,” Opt. Lett. 22, 1618–1620 (1997). 10.1364/OL.22.001618 [DOI] [PubMed] [Google Scholar]
- 3.Boppart S. A., Bouma B. E., Pitris C., Southern J. F., Brezinski M. E., Fujimoto J. G., “In vivo cellular optical coherence tomography imaging,” Nat. Med. 4, 861–865 (1998). 10.1038/nm0798-861 [DOI] [PubMed] [Google Scholar]
- 4.Fujimoto J. G., Pitris C., Boppart S. A., Brezinski M. E., “Optical coherence tomography: An emerging technology for biomedical imaging and optical biopsy,” Neoplasia 2, 9–25 (2000). 10.1038/sj.neo.7900071 [DOI] [PMC free article] [PubMed] [Google Scholar]
- 5.de Boer J. F., Cense B., Park B. H., Pierce M. C., Tearney G. J., Bouma B. E., “Improved signal-to-noise ratio in spectral-domain compared with time-domain optical coherence tomography,” Opt. Lett. 28, 2067–2069 (2003). 10.1364/OL.28.002067 [DOI] [PubMed] [Google Scholar]
- 6.Choma M., Sarunic M., Yang C., Izatt J., “Sensitivity advantage of swept source and Fourier domain optical coherence tomography,” Opt. Express 11, 2183–2189 (2003). 10.1364/OE.11.002183 [DOI] [PubMed] [Google Scholar]
- 7.Swanson E. A., Izatt J. A., Hee M. R., Huang D., Lin C. P., Schuman J. S., Puliafito C. A., Fujimoto J. G., “In vivo retinal imaging by optical coherence tomography,” Opt. Lett. 18, 1864–1866 (1993). 10.1364/OL.18.001864 [DOI] [PubMed] [Google Scholar]
- 8.Izatt J. A., Hee M. R., Swanson E. A., Lin C. P., Huang D., Schuman J. S., Puliafito C. A., Fujimoto J. G., “Micrometer-scale resolution imaging of the anterior eye in-vivo with optical coherence tomography,” Arch. Ophthalmol. 112, 1584–1589 (1994). 10.1001/archopht.1994.01090240090031 [DOI] [PubMed] [Google Scholar]
- 9.Schuman J. S., Hee M. R., Puliafito C. A., Wong C., Pedutkloizman T., Lin C. P., Hertzmark E., Izatt J. A., Swanson E. A., Fujimoto J. G., “Quantification of nerve fiber layer thickness in normal and glaucomatous eyes using optical coherence tomography,” Arch. Ophthalmol. 113, 586–596 (1995). 10.1001/archopht.1995.01100050054031 [DOI] [PubMed] [Google Scholar]
- 10.Wojtkowski M., Kowalczyk A., Leitgeb R., Fercher A. F., “Full range complex spectral optical coherence tomography technique in eye imaging,” Opt. Lett. 27, 1415–1417 (2002). 10.1364/OL.27.001415 [DOI] [PubMed] [Google Scholar]
- 11.Guedes V., Schuman J. S., Hertzmark E., Wollstein G., Correnti A., Mancini R., Lederer D., Voskanian S., Velazquez L., Pakter H. M., Pedut-Kloizman T., Fujimoto J. G., Mattox C., “Optical coherence tomography measurement of macular and nerve fiber layer thickness in normal and glaucomatous human eyes,” Ophthalmology 110, 177–189 (2003). 10.1016/S0161-6420(02)01564-6 [DOI] [PMC free article] [PubMed] [Google Scholar]
- 12.Wojtkowski M., Srinivasan V., Fujimoto J. G., Ko T., Schuman J. S., Kowalczyk A., Duker J. S., “Three-dimensional retinal imaging with high-speed ultrahigh-resolution optical coherence tomography,” Ophthalmology 112, 1734–1746 (2005). 10.1016/j.ophtha.2005.05.023 [DOI] [PMC free article] [PubMed] [Google Scholar]
- 13.Welzel J., “Optical coherence tomography in dermatology: a review,” Skin Res. Technol. 7, 1–9 (2001). 10.1034/j.1600-0846.2001.007001001.x [DOI] [PubMed] [Google Scholar]
- 14.Pierce M. C., Strasswimmer J., Park B. H., Cense B., de Boer J. F., “Advances in optical coherence tomography imaging for dermatology,” J. Invest. Dermatol. 123, 458–463 (2004). 10.1111/j.0022-202X.2004.23404.x [DOI] [PubMed] [Google Scholar]
- 15.Gambichler T., Moussa G., Sand M., Sand D., Altmeyer P., Hoffmann K., “Applications of optical coherence tomography in dermatology,” J. Dermatol. Sci. 40, 85–94 (2005). 10.1016/j.jdermsci.2005.07.006 [DOI] [PubMed] [Google Scholar]
- 16.Boppart S. A., Tearney G. J., Bouma B. E., Southern J. F., Brezinski M. E., Fujimoto J. G., “Noninvasive assessment of the developing Xenopus cardiovascular system using optical coherence tomography,” Proc. Natl. Acad. Sci. U. S. A. 94, 4256–4261 (1997). 10.1073/pnas.94.9.4256 [DOI] [PMC free article] [PubMed] [Google Scholar]
- 17.Leitgeb R., Villiger M., Bachmann A., Steinmann L., Lasser T., “Extended focus depth for Fourier domain optical coherence microscopy,” Opt. Lett. 31, 2450–2452 (2006). 10.1364/OL.31.002450 [DOI] [PubMed] [Google Scholar]
- 18.Blatter C., Grajciar B., Eigenwillig C. M., Wieser W., Biedermann B. R., Huber R., Leitgeb R. A., “Extended focus high-speed swept source oct with self-reconstructive illumination,” Opt. Express 19, 12141–12155 (2011). 10.1364/OE.19.012141 [DOI] [PubMed] [Google Scholar]
- 19.Holmes J., Hattersley S., Stone N., Bazant-Hegemark F., Barr H., “Multi-channel Fourier domain OCT system with superior lateral resolution for biomedical applications,” in “Biomedical Optics (BiOS) 2008” (International Society for Optics and Photonics, 2008), 68470O. 10.1117/12.761655 [DOI] [Google Scholar]
- 20.Holmes J., “Theory and applications of multi-beam OCT,” in “1st Canterbury Workshop and School in Optical Coherence Tomography and Adaptive Optics” (International Society for Optics and Photonics, 2008), 713908 [Google Scholar]
- 21.Holmes J., Hattersley S., “Image blending and speckle noise reduction in multi-beam OCT,” in “SPIE BiOS: Biomedical Optics” (International Society for Optics and Photonics, 2009), 71681N [Google Scholar]
- 22.Ralston T. S., Marks D. L., Carney P. S., Boppart S. A., “Inverse scattering for optical coherence tomography,” J. Opt. Soc. Am. A 23, 1027–1037 (2006). 10.1364/JOSAA.23.001027 [DOI] [PubMed] [Google Scholar]
- 23.Ralston T. S., Marks D. L., Boppart S. A., Carney P. S., “Inverse scattering for high-resolution interferometric microscopy,” Opt. Lett. 31, 3585–3587 (2006). 10.1364/OL.31.003585 [DOI] [PubMed] [Google Scholar]
- 24.Ralston T. S., Marks D. L., Carney P. S., Boppart S. A., “Interferometric synthetic aperture microscopy,” Nat. Phys. 3, 129–134 (2007). 10.1038/nphys514 [DOI] [PMC free article] [PubMed] [Google Scholar]
- 25.Davis B. J., Schlachter S. C., Marks D. L., Ralston T. S., Boppart S. A., Carney P. S., “Nonparaxial vector-field modeling of optical coherence tomography and interferometric synthetic aperture microscopy,” J. Opt. Soc. Am. A 24, 2527–2542 (2007). 10.1364/JOSAA.24.002527 [DOI] [PubMed] [Google Scholar]
- 26.Davis B. J., Ralston T. S., Marks D. L., Boppart S. A., Carney P. S., “Autocorrelation artifacts in optical coherence tomography and interferometric synthetic aperture microscopy,” Opt. Lett. 32, 1441–1443 (2007). 10.1364/OL.32.001441 [DOI] [PubMed] [Google Scholar]
- 27.Davis B. J., Marks D. L., Ralston T. S., Carney P. S., Boppart S. A., “Interferometric synthetic aperture microscopy: Computed imaging for scanned coherent microscopy,” Sensors 8, 3903–3931 (2008). 10.3390/s8063903 [DOI] [PMC free article] [PubMed] [Google Scholar]
- 28.Carney P. S., Adie S. G., Boppart S. A., “Interferometric synthetic aperture microscopy,” in Emerging Imaging Technologies in Medicine (CRC Press, 2012), pp. 293–301 [Google Scholar]
- 29.Ralston T. S., Adie S. G., Marks D. L., Boppart S. A., Carney P. S., “Cross-validation of interferometric synthetic aperture microscopy and optical coherence tomography,” Opt. Lett. 35, 1683–1685 (2010). 10.1364/OL.35.001683 [DOI] [PMC free article] [PubMed] [Google Scholar]
- 30.Yang V. X., Munce N., Pekar J., Gordon M. L., Lo S., Marcon N. E., Wilson B. C., Vitkin I. A., “Micromachined array tip for multifocus fiber-based optical coherence tomography,” Opt. Lett. 29, 1754–1756 (2004). 10.1364/OL.29.001754 [DOI] [PubMed] [Google Scholar]
- 31.Adie S. G., Graf B. W., Ahmad A., Carney P. S., Boppart S. A., “Computational adaptive optics for broadband optical interferometric tomography of biological tissue,” Proc. Natl. Acad. Sci. U. S. A. 109, 7175–7180 (2012). 10.1073/pnas.1121193109 [DOI] [PMC free article] [PubMed] [Google Scholar]
- 32.Adie S. G., Graf B. W., Ahmad A., Darbarsyah B., Boppart S. A., Carney P. S., “The impact of aberrations on object reconstruction with interferometric synthetic aperture microscopy,” in “SPIE BiOS” (International Society for Optics and Photonics, 2011), 78891O [Google Scholar]
- 33.Ralston T. S., Marks D. L., Carney P. S., Boppart S. A., “Real-time interferometric synthetic aperture microscopy,” Opt. Express 16, 2555–2569 (2008). 10.1364/OE.16.002555 [DOI] [PMC free article] [PubMed] [Google Scholar]
- 34.Ahmad A., Shemonski N. D., Adie S. G., Kim H.-S., Hwu W.-M. W., Carney P. S., Boppart S. A., “Real-time in vivo computed optical interferometric tomography,” Nat. Photon. 7, 444–448 (2013). 10.1038/nphoton.2013.71 [DOI] [PMC free article] [PubMed] [Google Scholar]


