

Abstract
Purpose
To improve survival rates in children with acute myeloid leukemia (AML), we evaluated gemtuzumab-ozogamicin (GO), a humanized immunoconjugate targeted against CD33, as an alternative to further chemotherapy dose escalation. Our primary objective was to determine whether adding GO to standard chemotherapy improved event-free survival (EFS) and overall survival (OS) in children with newly diagnosed AML. Our secondary objectives examined outcomes by risk group and method of intensification.
Patients and Methods
Children, adolescents, and young adults ages 0 to 29 years with newly diagnosed AML were enrolled onto Children's Oncology Group trial AAML0531 and then were randomly assigned to either standard five-course chemotherapy alone or to the same chemotherapy with two doses of GO (3 mg/m2/dose) administered once in induction course 1 and once in intensification course 2 (two of three).
Results
There were 1,022 evaluable patients enrolled. GO significantly improved EFS (3 years: 53.1% v 46.9%; hazard ratio [HzR], 0.83; 95% CI, 0.70 to 0.99; P = .04) but not OS (3 years: 69.4% v 65.4%; HzR, 0.91; 95% CI, 0.74 to 1.13; P = .39). Although remission was not improved (88% v 85%; P = .15), posthoc analyses found relapse risk (RR) was significantly reduced among GO recipients overall (3 years: 32.8% v 41.3%; HzR, 0.73; 95% CI, 0.58 to 0.91; P = .006). Despite an increased postremission toxic mortality (3 years: 6.6% v 4.1%; HzR, 1.69; 95% CI, 0.93 to 3.08; P = .09), disease-free survival was better among GO recipients (3 years: 60.6% v 54.7%; HzR, 0.82; 95% CI, 0.67 to 1.02; P = .07).
Conclusion
GO added to chemotherapy improved EFS through a reduction in RR for children and adolescents with AML.
INTRODUCTION
Acute myeloid leukemia (AML) is among the most difficult to treat of the childhood cancers because of its disease heterogeneity, high relapse, and toxic mortality.1,2 Therapeutic advances have included chemotherapy intensification and adding allogeneic stem-cell transplantation (SCT). Children's Oncology Group (COG) legacy AML trials evaluated time-intensive induction and observed improvement in event-free survival rates (EFS) from 27% to 42%.3,4 Matched family-donor (MFD) transplantation improved disease-free survival rates (DFS) by between 8% and 10% and postremission overall survival (OS) by between 5% and 13% in two previous phase III trials.4,5 However, treatment-related mortality (TRM) increased substantially with therapy intensification. Supportive care improvements reduced TRM (from 19% to 12%).4 However, it is increasingly evident that the limits of treatment intensification have been reached,4,6,7 necessitating alternative approaches.
The cell-surface antigen, CD33, is present in more than 80% of patients with AML but is absent from pluripotent hematopoietic stem cells and is a well established immunoconjugate target.8,9 Early studies with gemtuzumab-ozogamicin (GO), a humanized anti-CD33 antibody linked to the DNA-binding cytotoxin calicheamicin, showed single-agent activity in refractory pediatric and adult patients with AML (28% to 30% overall response).10–13 Phase II regimens demonstrated safety and efficacy in combination with chemotherapy.14–17 Single-agent efficacy resulted in GO's accelerated approval in 2000 by the US Food and Drug Administration14,18 which mandated a subsequent randomized controlled trial. This trial was the Southwest Oncology Group's trial (SWOG) S0106, and its primary end points of remission induction and safety failed to improve with GO,19 and in 2010 GO was voluntarily withdrawn. Based on study design and control group outcomes, these results have been controversial,20 particularly with concurrent adult randomized controlled trials showing reduced relapse with GO in low-risk (LR) and intermediate-risk (IR) subsets of AML patients.21,22
Concurrently performed, our trial's primary objective was to determine whether GO added to standard chemotherapy improved EFS and OS in children with newly diagnosed AML. Our secondary objectives examined outcomes by risk group and method of intensification.
PATIENTS AND METHODS
Between August 2006 and June 2010, COG trial AAML0531 enrolled 1,070 patients, ages 1 month to 29.99 years, who had previously untreated primary AML.23 Data were entered through the COG Web portal by each enrolling institution, and were frozen March 31, 2013, with a median follow-up period of 4.1 years (range, 0 to 7.1 years) for patients alive at last contact. After six patients with Down syndrome 42 patients who failed to meet eligibility criteria were excluded, 1,022 patients were eligible for analysis (Fig 1). No minimal performance status was required. Exclusion criteria included prior chemotherapy (except intrathecal cytarabine), acute promyelocytic leukemia [t(15;17)], juvenile myelomonocytic leukemia, bone marrow failure syndromes, or secondary AML. Pathologic (84%) and cytogenetic findings (96%) were centrally reviewed. The National Cancer Institute's central institutional review board and institutional review boards at each enrolling center (n = 181) approved the study; patients and their families provided informed consent or assent as appropriate. The trial was conducted in accordance with the Declaration of Helsinki. The trial was registered at www.clinicaltrials.gov as NCT00372593.
Fig 1.

CONSORT diagram. (*) Elective reasons included terminating therapy because of physician's choice or patient's refusal of further protocol therapy. (†) Donor availability defined for intermediate- and high-risk patients only. Alt, alternative donor; DS, Down syndrome; Int, intensification course; MFD, matched family donor; SCT, stem-cell transplantation.
Patients were randomly assigned once at enrollment. They were assigned to one of two study arms (511 patients in each arm): standard therapy alone (No-GO) or with GO (each dose 3 mg/m2) administered once on day 6 of induction course 1 (IND1) and once on day 7 of intensification course 2 (INT2; Table 1). Chemotherapy cytoreduction preceded GO administration to maximize CD33 target saturation,24,25 rather than administering higher GO doses. Concurrent anthracycline administration was avoided to minimize additive hepatotoxicity risk. Risk stratification of both arms determined allocation to SCT based on diagnostic molecular/cytogenetic risk criteria and disease response after IND1 as follows.
Table 1.
COG AAML0531 Therapeutic Regimen
| Course and Agent | Dose | Days |
|---|---|---|
| IND1 | ||
| Cytarabine | 100 mg/m2/dose twice per day IV | 1 to 10 |
| Daunomycin | 50 mg/m2/dose IV | 1, 3, 5 |
| Etoposide | 100 mg/m2/dose IV | 1 to 5 |
| Gemtuzumab, arm B only | 3 mg/m2/dose IV over 2 hours | 6 |
| IND2 | ||
| Cytarabine | 100 mg/m2/dose twice per day IV | 1 to 8 |
| Daunomycin | 50 mg/m2/dose IV | 1, 3, 5 |
| Etoposide | 100 mg/m2/dose IV | 1 to 5 |
| INT1 | ||
| Cytarabine | 1,000 mg/m2/dose twice per day IV | 1 to 5 |
| Etoposide | 150 mg/m2/dose IV | 1 to 5 |
| For patients not undergoing stem-cell transplantation | ||
| INT2 | ||
| Mitoxantrone | 12 mg/m2/dose IV | 3 to 6 |
| Cytarabine | 1,000 mg/m2/dose twice per day IV | 1 to 4 |
| Gemtuzumab, arm B only | 3 mg/m2/dose IV over 2 hours | 7 |
| INT3 | ||
| Cytarabine | 3,000 mg/m2/dose twice per day IV | 1, 2, 8, 9 |
| Escherichia coli L-asparaginase | 6,000 mg/m2/dose IM | 2, 9 |
| For patients receiving matched family-donor stem-cell transplantation | ||
| Busulfan, 16 total doses | Age and weight based | −9 |
| < 10 kg or > 4 years old | 0.8 mg/kg/dose once every 6 hours IV | |
| > 10 kg and < 4 years old | 1 mg/kg/dose every 6 hours IV | |
| All patients | Adjusted AUC based on first dose | −8 to −6 |
| Cyclophosphamide | 50 mg/kg/dose IV once per day | −5 to −2 |
Abbreviations: AUC, area under the concentration-time curve; COG, Children's Oncology Group; IM, intramuscular; IND1, induction course; INT, intensification course; IV, intravenous.
LR was defined by the presence of t(8;21)(q22;q22), inv(16)(p13.1q22), or t(16;16)(p13.1;q22). LR patients were not allocated to SCT. High risk (HR) was defined by presence of monosomy 7, monosomy 5/5q deletion, or persistent disease (PD) at the end of IND1 (bone marrow blasts > 15% by morphology). After 374 eligible patients were enrolled onto the study, FLT-3 internal tandem duplication high allelic ratio (> 0.4; FLT3-ITD HAR) was added to the HR group assignment.26 Cytogenetics outweighed response in risk classification, whereas FLT3-ITD HAR outweighed favorable cytogenetics.27,28 All HR patients received best allogeneic SCT (nonsyngeneic MFD or unrelated) after INT1 (delays in donor availability resulted in SCT given after INT2 [n = 6] or INT3 [n = 1]). Choice of alternative donors were at the transplantation center's discretion and included matched or 1-antigen mismatched unrelated donors, 4-to-6 antigen matched cord blood, or mismatched family donor with at least one haplotype match or 5-of-6 antigen phenotypic match. HR patients without donors continued with assigned chemotherapy. IR was defined by the absence of low- or high-risk factors, and they only received an MFD SCT if available. Patients allocated to SCT underwent this after INT1. Consequently, those patients randomly assigned to GO only received one dose during IND1 (n = 157).
Response classification was based on morphologic examination of bone marrow blasts: complete remission (CR) had fewer than 5%, partial remission 5% to 15%, and PD more than 15%. Patients with refractory disease (RD) were removed from protocol therapy. Refractory disease was defined as the presence of CNS disease after IND1, or bone marrow blasts ≥ 5%, or any extramedullary disease at the end of IND2.
Blocked randomization with blocks of size 4 that were concealed from enrolling centers was used for treatment arm assignment. The COG Data and Statistical Center assigned patients to the treatment arms, after they were enrolled by the patient's institution through an automated Web portal. The study had a goal to enroll 1,000 eligible patients who did not have Down syndrome and was designed to have 80% power with one-sided 2.5% type I error to detect a 9% improvement in long-term EFS (54% v 45%) and long-term OS (59% v 50%) between the two study arms. The study was monitored by a data safety monitoring committee. The alpha-spending function αt2 (truncated at three standard deviations) and 2.5% type I error was used to monitor OS and EFS while futility monitoring was performed by testing the alternative hypothesis at the .005 level.
The primary end points were OS and EFS from study entry. OS was defined as time from study entry, and from end of IND2 for patients in CR, until death. EFS was defined as the time from study entry until death, induction failure, or relapse of any type. The secondary end points were remission rates, relapse risk (RR), postinduction DFS, EFS and OS censoring SCT patients, TRM, and OS and EFS by risk group. RR was defined as the time from the end of IND2 for patients in CR to relapse, where deaths without a relapse were considered competing events. DFS was defined as the time from end of IND2 for patients in CR until relapse or death. TRM was defined as the time from either study entry, or from end of IND2 for patients in CR, to deaths without a relapse with relapses considered as competing events. Patients lost to follow-up were censored at their date of last known contact.
The significance of observed difference in proportions was tested using the χ2 test and Fisher's exact test when data were sparse. The Kruskal-Wallis test was used to determine the significance between differences in medians of groups. The life-table estimates of OS, EFS, and DFS were calculated using the Kaplan-Meier procedure along with corresponding Greenwood SEs.29
The significance of predictor variables was tested with the log-rank statistic for OS, EFS, DFS and with Gray's statistic for RR and TRM.30 Cox proportional hazards models were used to estimate hazard ratios (HzR) for univariable and multivariable analyses of OS, EFS, and DFS.31 Competing risk regression models were used to estimate the subgroup HzR for univariable and multivariable analyses of RR and TRM.32 All P values are two-sided.
RESULTS
Demographic Characteristics
Random assignment resulted in balanced study arms, except FLT3-ITD HAR was more prevalent (P = .09) and HR cytogenetics was less prevalent (P = .03) in GO recipients (Table 2). Risk-group assignment was similar between arms. Overall, 65% of patients completed all courses of therapy (Fig 1), with no significant difference between arms (Appendix Table A2 [online-only]). The trial remained open until accrual goals were met.
Table 2.
Demographic Characteristics and Risk Classification
| Characteristic | All Patients |
No-GO Arm |
GO Arm |
|||
|---|---|---|---|---|---|---|
| No. of Patients | % | No. of Patients | % | No. of Patients | % | |
| Total enrolled | 1,070 | 538 | 532 | |||
| Ineligible, non-DS | 41 | 20 | 21 | |||
| Ineligible, DS | 1 | 1 | 0 | |||
| Eligible, DS | 6 | 6 | 0 | |||
| Eligible, non-DS | 1,022 | 511 | 511 | |||
| Patient characteristics | ||||||
| Sex | ||||||
| Male | 508 | 49.7 | 264 | 51.7 | 244 | 47.7 |
| Female | 514 | 50.3 | 247 | 48.3 | 267 | 52.3 |
| Age at diagnosis, years | ||||||
| Median | 9.7 | 9.5 | 9.9 | |||
| Range | 0.003-29.8 | 0.003-29.8 | 0.02-29.4 | |||
| 0-1 [0-730 days old] | 207 | 20.3 | 114 | 22.3 | 93 | 18.2 |
| 2-10 | 354 | 34.6 | 167 | 32.7 | 187 | 36.6 |
| 11-15 | 298 | 29.2 | 157 | 30.7 | 141 | 27.6 |
| 16-20 | 150 | 14.7 | 69 | 13.5 | 81 | 15.9 |
| ≥ 21 | 13 | 1.3 | 4 | 0.8 | 9 | 1.8 |
| Race | ||||||
| American Indian or Alaska Native | 4 | 0.4 | 3 | 0.7 | 1 | 0.2 |
| Asian | 50 | 5.4 | 27 | 5.9 | 23 | 5.0 |
| Native Hawaiian or other Pacific Islander | 2 | 0.2 | 1 | 0.2 | 1 | 0.2 |
| Black or African American | 116 | 12.6 | 61 | 13.3 | 55 | 12.0 |
| White | 748 | 81.3 | 368 | 80.0 | 380 | 82.6 |
| Unknown | 102 | 51 | 51 | |||
| Ethnicity | ||||||
| Hispanic or Latino | 189 | 19.2 | 97 | 19.8 | 92 | 18.7 |
| Not Hispanic or Latino | 794 | 80.8 | 394 | 80.2 | 400 | 81.3 |
| Unknown | 39 | 20 | 19 | |||
| WHO classification | ||||||
| AML WHO disease classification | ||||||
| AML with t(8;21)(q22;q22), AML1/ETO | 131 | 12.8 | 65 | 12.7 | 66 | 12.9 |
| AML with abnormal bone marrow eosinophils and inv(16)(p13q22) or t(16;16)(p13;q22), CBF/MYH11 | 100 | 9.8 | 47 | 9.2 | 53 | 10.4 |
| AML with 11q23 (MLL) abnormalities | 183 | 17.9 | 93 | 18.2 | 90 | 17.6 |
| AML with multilineage dysplasia | 61 | 6.0 | 35 | 6.9 | 23 | 5.1 |
| AML with multilineage dysplasia: following MDS or MDS/MPD | 1 | 0.1 | 0 | 0 | 1 | 0.2 |
| AML with multilineage dysplasia: without antecedent MDS or MDS/MPD | 3 | 0.3 | 2 | 0.4 | 1 | 0.2 |
| AML, not otherwise categorized | 19 | 1.9 | 10 | 2.0 | 9 | 1.8 |
| AML, minimally differentiated | 32 | 3.1 | 13 | 2.5 | 19 | 3.7 |
| AML without maturation | 107 | 10.5 | 56 | 11.0 | 51 | 10.0 |
| AML with maturation | 104 | 10.2 | 50 | 9.8 | 54 | 10.6 |
| Acute myelomonocytic leukemia | 111 | 10.9 | 55 | 10.8 | 56 | 11.0 |
| Acute monoblastic/acute monocytic leukemia | 97 | 9.5 | 45 | 8.8 | 52 | 10.2 |
| Acute erythroid leukemia | 15 | 1.5 | 6 | 1.2 | 9 | 1.8 |
| Acute megakaryoblastic leukemia | 49 | 4.8 | 31 | 6.1 | 18 | 3.5 |
| Acute panmyelosis with myelofibrosis | 1 | 0.1 | 0 | 0 | 1 | 0.2 |
| Myeloid sarcoma | 8 | 0.8 | 3 | 0.6 | 5 | 1.0 |
| Leukemic burden | ||||||
| WBC, × 103/μL | ||||||
| Median | 24 | 24.3 | 23.6 | |||
| Range | 0.2-827.2 | 0.2-526 | 0.4-827.2 | |||
| No. of patients with > 100 × 103/μL | 198 | 19.4 | 95 | 18.6 | 103 | 20.2 |
| CNS disease classification at study entry | ||||||
| CNS1 | 712 | 70.8 | 360 | 71.3 | 352 | 70.3 |
| CNS2 | 197 | 19.6 | 99 | 19.6 | 98 | 19.6 |
| CNS3 | 97 | 9.6 | 46 | 9.1 | 51 | 10.2 |
| Unknown | 16 | 6 | 10 | |||
| Extramedullary disease | 140 | 13.7 | 74 | 14.5 | 66 | 12.9 |
| Risk factors and classification | ||||||
| Cytogenetics, affecting risk classification | ||||||
| t(8;21)* | 137 | 13.4 | 69 | 13.5 | 68 | 13.3 |
| Inv16, t(16;16)* | 109 | 10.7 | 52 | 10.2 | 57 | 11.2 |
| −7† | 25 | 2.5 | 16 | 3.1 | 9 | 1.8 |
| −5/5q-† | 14 | 1.4 | 10 | 2.0 | 4 | 0.8 |
| Institution FLT3 results‡ | ||||||
| High FLT3-ITD allelic ratio (> 0.4)† | 63 | 9.7 | 25 | 7.7 | 38 | 11.7 |
| End of IND1 response, BM aspirate | ||||||
| Complete remission | 727 | 72.4 | 350 | 69.6 | 377 | 75.6§ |
| Partial remission, 5%–15% blasts | 122 | 12.2 | 71 | 14.1 | 51 | 10.2 |
| Persistent disease, > 15% blasts by morphology† | 114 | 11.4 | 61 | 12.1 | 53 | 10.6 |
| No IND1 marrow evaluation¶ | ||||||
| Died before end of IND1¶ | 18 | 1.8 | 9 | 1.8 | 9 | 1.8 |
| Refractory CNS disease¶ | 23 | 2.3 | 14 | 2.8 | 9 | 1.8 |
| Not evaluable | 18 | 2.9 | 6 | 1.2 | 12 | 2.3 |
| Risk-group assignment‖ | ||||||
| Low | 246 | 24.1 | 121 | 23.7 | 125 | 24.5 |
| Intermediate | 607 | 59.4 | 302 | 59.1 | 305 | 59.7 |
| High | 169 | 16.5 | 88 | 17.2 | 81 | 15.9 |
Abbreviations: AML, acute myeloid leukemia; BM, bone marrow; DS, Down syndrome; GO, gemtuzumab-ozogamicin; IND, induction course; MDS, myelodysplastic syndrome; MDS/MPD, myelodysplastic/myeloproliferative neoplasms; MLL, mixed-lineage leukemia; No-Go, did not receive gemtuzumab-ozogamicin (control arm).
Low-risk factors (override response at end of IND1; high FLT3-ITD ratio overrides low-risk factors).
High-risk factors.
FLT3 totals and percentages derived from after study point when this was added to risk classification (n = 324 in each arm).
P < .05.
These patients were not completely defined for risk classification owing to early death, removal because of refractory CNS disease, or failure to have an end of induction marrow.
Risk group assignments are based upon the presence of various factors, and some patients may have had more than one (eg, persistent disease and − 7); numbers in rows are the total for each factor and therefore their total may exceed the No. in the risk group assignment.
Induction
Remission was assessed after each induction course (Tables 2, 3, and Appendix Table A1) and was compared between GO and No-GO arms. At the end of IND1, early death, refractory CNS disease, and prevalence of PD were similar (Table 2). At the end of IND2 (Table 3), neither CR (P = .15) nor RD (P = .12) were significantly different between arms. RD was significantly reduced only among LR and IR GO recipients; no LR GO recipient experienced RD. Overall, induction mortality was similar between the arms.
Table 3.
AAML0531 Outcomes From Study Entry
| Patient Group From Study Entry | No. of Patients | CR* (%) | P† | RD* (%) | P† | EM* (%) | P† | 3-Year EFS ± 2SE (%) | EFS HR | 95% CI | P† | 3-Year OS ± 2SE (%) | OS HR | 95% CI | P† |
|---|---|---|---|---|---|---|---|---|---|---|---|---|---|---|---|
| All patients | |||||||||||||||
| No-GO | 511 | 85.1 | .15 | 12.6 | .12 | 2.2 | .98 | 46.9 ± 4.4 | 1 | 65.4 ± 4.4 | 1 | ||||
| GO | 511 | 88.3 | 9.5 | 2.3 | 53.1 ± 4.4 | 0.83 | 0.70 to 0.99 | .04 | 69.4 ± 4.2 | 0.91 | 0.74 to 1.13 | .39 | |||
| Low risk | |||||||||||||||
| No-GO | 121 | 95 | .33 | 4.2 | .03 | 0.8 | .62 | 64.0 ± 8.8 | 1 | 84.6 ± 6.6 | 1 | ||||
| GO | 125 | 97.6 | 0 | 2.4 | 71.4 ± 8.2 | 0.74 | 0.48 to 1.15 | .18 | 85.4 ± 6.4 | 1.11 | 0.60 to 2.06 | .74 | |||
| Intermediate risk | |||||||||||||||
| No-GO | 302 | 87.4 | .03 | 9.2 | .04 | 3.4 | .48 | 45.8 ± 5.8 | 1 | 62.6 ± 5.6 | 1 | ||||
| GO | 305 | 92.7 | 4.8 | 2.4 | 51.4 ± 5.8 | 0.82 | 0.66 to 1.03 | .09 | 68.7 ± 5.4 | 0.83 | 0.64 to 1.09 | .19 | |||
| High risk | |||||||||||||||
| No-GO | 88 | 61 | .48 | 39 | .59 | 0 | .49 | 27.2 ± 9.6 | 1 | 48.0 ± 11.0 | 1 | ||||
| GO | 81 | 55.4 | 43.2 | 1.4 | 31.2 ± 10.4 | 1.0111 | 0.70 to 1.45 | .96 | 47.7 ± 11.6 | 1.06 | 0.70 to 1.62 | .78 |
| From End of IND2 | |||||||||||||||||
|---|---|---|---|---|---|---|---|---|---|---|---|---|---|---|---|---|---|
| Patient Group From End of IND2 | No. of Patients | 3-Year TRM ± 2SE (%) | TRM HR | 95% CI | P† | 3-Year RR ± 2SE (%) | RR HR | 95% CI | P† | 3-Year DFS ± 2SE (%) | DFS HR | 95% CI | P† | 3-Year OS ± 2SE (%) | OS HR | 95% CI | P† |
| All patients | |||||||||||||||||
| No-GO | 418 | 4.1 ± 1.9 | 1 | 41.3 ± 4.9 | 1 | 54.7 ± 5.0 | 1 | 70.1 ± 4.6 | 1 | ||||||||
| GO | 429 | 6.6 ± 2.4 | 1.69 | 0.93 to 3.08 | .08 | 32.8 ± 4.6 | 0.73 | 0.58 to 0.91 | .006 | 60.6 ± 4.8 | 0.82 | 0.67 to 1.02 | .07 | 74.0 ± 4.4 | 0.88 | 0.68 to 1.13 | .32 |
| Low risk | |||||||||||||||||
| No-GO | 114 | 1.8 ± 2.5 | 1 | 30.3 ± 8.8 | 1 | 67.9 ± 8.8 | 1 | 86.4 ± 6.6 | 1 | ||||||||
| GO | 120 | 7.5 ± 4.9 | 4.39 | 0.95 to 20.4 | .04 | 19.7 ± 7.4 | 0.58 | 0.34 to 0.97 | .04 | 72.8 ± 8.2 | 0.81 | 0.51 to 1.30 | .38 | 84.7 ± 7.0 | 1.11 | 0.56 to 2.17 | .77 |
| Intermediate risk | |||||||||||||||||
| No-GO | 257 | 3.1 ± 2.2 | 1 | 45.5 ± 6.3 | 1 | 51.4 ± 6.4 | 1 | 66.9 ± 6.0 | 1 | ||||||||
| GO | 268 | 4.6 ± 2.6 | 1.45 | 0.60 to 3.57 | .41 | 39.6 ± 6.1 | 0.81 | 0.63 to 1.06 | .13 | 55.9 ± 6.2 | 0.86 | 0.67 to 1.11 | .24 | 70.2 ± 5.8 | 0.90 | 0.67 to 1.22 | .49 |
| High risk | |||||||||||||||||
| No-GO | 47 | 14.9 ± 10.5 | 1 | 44.8 ± 14.8 | 1 | 40.3 ± 14.4 | 1 | 48.5 ± 14.6 | 1 | ||||||||
| GO | 41 | 17.1 ± 11.9 | 1.27 | 0.46 to 3.48 | .65 | 27.0 ± 14.2 | 0.53 | 0.25 to 1.09 | .08 | 55.9 ± 15.6 | 0.66 | 0.37 to 1.18 | .16 | 67.5 ± 14.8 | 0.61 | 0.32 to 1.16 | .13 |
Abbreviations: CR, complete remission; DFS, disease-free survival; EFS, event-free survival; EM, early mortality; GO, received gemtuzumab-ozogamicin; HR, hazard ratio; IND, induction course; No-GO, did not receive gemtuzumab-ozogamicin (control arm); OS, overall survival; RD, refractory disease; RR, relapse rate; TRM, treatment-related mortality from end of induction.
CR, RD, and EM are cumulative incidences from study entry to end of IND2.
P values are either Gray's P value for TRM, RR analyses, or log-rank P values for DFS or OS analyses.
Outcome From Study Entry
Among all patients (Table 3; Fig 2A), from study entry EFS was significantly improved among GO recipients (HzR, 0.83; 95% CI, 0.70 to 0.99; P = .04; 3-year EFS: 53.1% ± 4.4% v 46.9% ± 4.4%) though OS was not improved (HzR, 0.91; 95% CI, 0.74 to 1.13; P = .39; 3-year OS: 69.4% ± 4.2% v 65.4% ± 4.4%). By risk group (Figs 2B to 2D), only EFS in the LR and IR groups suggested improvement with GO. No difference in EFS or OS was detected in the HR patients when analyzed from study entry.
Fig 2.

Overall survival (OS) and event-free (EFS) survival rates from study entry by study arm. (A) All patients; (B) low-risk (LR) patients; (C) intermediate-risk (IR) patients; (D) high-risk (HR) patients. GO, gemtuzumab-ozogamicin arm; No-GO, did not receive gemtuzumab-ozogamicin (control arm). Median survival rates for each group is listed in Appendix Table A7, where applicable.
Postremission Outcomes
Postremission analyses suggested consistent differences by arm (Table 3; Figs 3A to 3D). DFS among all GO recipients suggested improvement overall and by risk group (P = .07). Exploratory analyses demonstrated a significant decrease in RR overall (HzR, 0.73; 95% CI, 0.58 to 0.91; P = .006; 3-year RR: 32.8% ± 4.6% v 41.3% ± 4.9%), with qualitatively similar improvements within each risk group. In HR patients, the FLT3-ITD HAR cohort was the only one to benefit from GO (Appendix Figs A1B to A1C). However, OS after induction in the entire cohort and in each risk group was not improved. This was partially because of a higher postinduction TRM for GO recipients, particularly for LR patients.
Fig 3.

Outcomes among patients from end of induction 2 (IND2) by risk group and study arm among patients in remission after the end of IND2. (A) Disease-free survival from end of IND2. (B) Overall survival from end of IND2. (C) Relapse risk from end of IND2. (D) Treatment-related mortality from end of IND2. GO, gemtuzumab-ozogamicin arm; No-GO, did not receive gemtuzumab-ozogamicin (control arm).
Stem-Cell Transplantation
SCT was recommended for all patients with HR AML and for patients with IR AML if a MFD was available. Thus, the ability to directly analyze the affect of SCT is restricted to IR AML. Fewer No-GO patients (45of 62 patients) received SCT as assigned than did GO recipeients (48 of 53 patients; P = .015), primarily because of donor availability. Intent-to-treat analysis (Appendix Table A3; Appendix Fig A1A) showed significantly improved DFS (P = .02) and OS (P = .02) with SCT. This benefit was limited to GO recipients and, conversely, GO only benefited those patients who received SCT.
Univariable and Multivariable Analyses
Risk factors found to be significant in univariable analysis (Appendix Tables A4 and A5) were included in multivariable models to better define the impact of GO (Table 4). In multivariable analyses adjusted for age, diagnostic WBC, race, and risk group, GO was independently associated with better EFS (HzR, 0.80; 95% CI, 0.67 to 0.96; P = .02), DFS (HzR, 0.80; 95% CI, 0.64 to 0.99; P = .04), and RR (HzR, 0.72; 95% CI, 0.57 to 0.91; P = .006), as well as higher TRM (HzR, 1.84; 95% CI, 0.97 to 3.47; P = .06).
Table 4.
Multivariable Analyses for Outcomes From Study Entry and From End of IND2
| Modeled Risk Factors* | From Study Entry |
From End of IND2 |
||||||||||||||||||
|---|---|---|---|---|---|---|---|---|---|---|---|---|---|---|---|---|---|---|---|---|
| No. of Patients | EFS |
OS |
No. of Patients | DFS |
OS |
RR |
TRM |
|||||||||||||
| HR | 95% CI | P | HR | 95% CI | P | HR | 95% CI | P | HR | 95% CI | P | HR | 95% CI | P | HR | 95% CI | P | |||
| Treatment arm | ||||||||||||||||||||
| No-GO | 465 | 1 | 1 | 381 | 1 | 1 | 1 | 1 | ||||||||||||
| GO | 466 | 0.80 | 0.67 to 0.96 | .02 | 0.89 | 0.71 to 1.12 | .33 | 398 | 0.80 | 0.64 to 0.99 | .04 | 0.84 | 0.65 to 1.10 | .20 | 0.72 | 0.57 to 0.91 | .006 | 1.84 | 0.97 to 3.47 | .06 |
| Age at diagnosis, years | ||||||||||||||||||||
| 2-10 | 328 | 1 | 1 | 281 | 1 | 1 | 1 | 1 | ||||||||||||
| 0-1 | 182 | 1.12 | 0.86 to 1.45 | .40 | 1.18 | 0.86 to 1.63 | .31 | 144 | 1.07 | 0.78 to 1.47 | .67 | 1.10 | 0.75 to 1.64 | .60 | 1.04 | 0.74 to 1.47 | .82 | 1.57 | 0.36 to 6.74 | .55 |
| ≥ 11 | 421 | 1.15 | 0.93 to 1.41 | .20 | 1.40 | 1.08 to 1.81 | .01 | 354 | 1.25 | 0.98 to 1.60 | .07 | 1.5 | 1.11 to 2.04 | .009 | 0.95 | 0.73 to 1.23 | .69 | 7.32 | 2.52 to 21.2 | < .001 |
| WBC at diagnosis, μL | ||||||||||||||||||||
| ≤ 100,000 | 757 | 1 | 1 | 648 | 1 | 1 | 1 | 1 | ||||||||||||
| > 100,000 | 174 | 1.41 | 1.14 to 1.76 | .002 | 1.18 | 0.89 to 1.55 | .25 | 131 | 1.28 | 0.98 to 1.68 | .07 | 1.13 | 0.81 to 1.59 | .48 | 1.47 | 1.09 to 1.98 | .01 | 0.38 | 0.12 to 1.20 | .10 |
| Race | ||||||||||||||||||||
| Not black | 818 | 1 | 1 | 687 | 1 | 1 | 1 | 1 | ||||||||||||
| Black | 113 | 1.37 | 1.06 to 1.78 | .02 | 2.01 | 1.51 to 2.68 | < .001 | 92 | 1.49 | 1.09 to 2.02 | .01 | 1.99 | 1.42 to 2.79 | < .001 | 1.29 | 0.91 to 1.83 | .16 | 1.82 | 0.84 to 3.97 | .13 |
| Cytogenetic risk group | ||||||||||||||||||||
| Intermediate | 666 | 1 | 1 | 536 | 1 | 1 | 1 | 1 | ||||||||||||
| Low [t(8;21) or inv(16)] | 231 | 0.48 | 0.37 to 0.61 | < .001 | 0.37 | 0.26 to 0.52 | < .001 | 220 | 0.54 | 0.41 to 0.71 | < .001 | 0.37 | 0.25 to 0.54 | < .001 | 0.52 | 0.39 to 0.70 | < .001 | 0.87 | 0.41 to 1.85 | .72 |
| High (−5/del5q or −7) | 34 | 1.32 | 0.86 to 2.01 | .20 | 1.98 | 1.27 to 3.07 | .002 | 23 | 1.28 | 0.73 to 2.24 | .39 | 2.00 | 1.13 to 3.54 | .02 | 0.57 | 0.27 to 1.22 | .15 | 7.86 | 2.93 to 21.1 | < .001 |
NOTE. Analyses only include patients for whom risk factor data were available.
Abbreviations: DFS, disease-free survival; EFS, event-free survival; GO, gemtuzumab ozogamicin; HR, hazard ratio; IND, induction course; No-GO, did not receive gemtuzumab-ozogamicin (control arm); OS, overall survival; RR, relapse risk; TRM, treatment-related mortality.
Modeled risk factors were found on univariable analysis to have significant impact on outcomes.
Toxicity
Common Terminology Criteria for Adverse Events v4 grade 3 to 5 toxicities were similar between study arms (Appendix Table A6). Life-threatening sinusoidal obstruction syndrome (SOS) was similar with one event in the No-GO arm during IND1, during SCT (No-GO v GO: two of 76 patients v three of 82 patients; P = not significant [NS]), as was SOS of any degree (14 of 511 patients v 18 of 511 patients; P = NS). Acute left-ventricular systolic dysfunction was equivalent in both arms (4.9% ± 1.9% v 4.0% ± 1.8%; P = NS). Hematologic toxicity was similar between study arms, including median time to neutrophil recovery, which was more than 500/uL. However, posthoc analysis to examine causes for TRM differences found a higher proportion of GO patients during INT2 with prolonged (> 59 days) neutrophil recovery times (12.0% v 6.3%; P = .01).
Though therapy reductions occurred in similar proportions between arms (Appendix Table A6), death in remission was qualitatively higher among GO recipients (4.2% v 2.6%; P = .21). Cumulative TRM from enrollment through last follow-up without relapse or induction failure was higher in GO recipients (5-year TRM: GO, 8.6% ± 2.5% v No-GO, 5.9% ± 2.1%; P = .09). This difference was primarily limited to the LR patients (two v eight patients; P = .02) during INT2 and INT 3 (Appendix Table A6), among those patients 11 years old or older (eight of 10 patients). All but one non-SCT TRM event during intensification occurred before neutrophil recovery and primarily late in the course (mean, 56 days; range, 17 to 93 days) and was infection-related. Day-100 TRM rates for MFD and alternative-donor SCT patients were 1.8% (n = 2) and 10.9% (n = 5), respectively, and were similar between arms. TRM beyond day 100 was equivalent.
DISCUSSION
Using the largest randomized pediatric de novo AML trial to date and the only pediatric randomized controlled trial that added GO to induction and intensification, we have shown that EFS is significantly improved by a significant reduction in relapse. These findings are consistent with recent randomized controlled trials in adults21,22,33 and together strongly supports the need to pursue therapeutic options using anti-CD33 antibody-drug conjugates added to traditional chemotherapy and allogeneic SCT.
In 2010, GO was withdrawn when the SWOG trial S0106 found GO use failed to improve CR (as a primary end point) and had higher induction mortality.19 This trial was criticized for daunomycin reduction in the GO arm (45 mg/m2/dose v 60 mg/m2/dose),20 considering later evidence that anthracycline dosing significantly affects OS.34,35 Our trial and earlier COG efforts show that intensifying induction, targeted or nontargeted, subsequently reduces RR without improving CR.3 Similarly, other trials in adult patients have since reported that GO improves survival rates in the LR and IR subtypes of AML without improving CR and without high mortality.19,21,22,33 A recent meta-analysis of randomized controlled trials of GO in adults further strengthened this association of reduced relapse when adding GO.36
AML is a heterogeneous disease caused by a variety of molecular mutations conferring varied prognoses.9 This led to our a priori secondary objectives to examine how GO might affect AML risk groups' survival rates differently and, by our selective incorporation of SCT (based on benefit in prior COG trials5), onto a backbone of intensive induction and high-dose intensification chemotherapy (modified from the Medical Research Council AML12 trial37). Adapting the MRC's risk classification,27 AAML0531 varied from prior COG trials by subdividing patients for selective use of SCT during intensification, permitting further analysis of this and GO's impact on DFS.
Analyzed from study entry by risk group, patients with LR AML at 3 years (Table 3) exhibited a 7% improvement in EFS, primarily from a 10% reduction in relapse consistent with trials of adult patients.19,21,22 Despite this benefit in first remission, OS was not significantly improved. This is not unusual for LR patients who have high salvage rates after relapse.38,39 Within the IR-patient group, GO did improve CR rates (P = .03) and, with a reduced RR (P = .13), saw EFS (P = .09) and OS (P = .19) improve as well. However, as intensification therapy varied based on availability of MFD SCT, we prospectively evaluated GO's impact without SCT. We found no reduction in RR, DFS, or OS in those patients not receiving SCT. However, in IR SCT patients, despite the small numbers, we saw qualitative improvement in RR (P = .15) without a difference in TRM, resulting in similar degrees of DFS (P = .14) and OS (P = .17) rate improvements with GO (Appendix Table A3; Appendix Fig A1A).
Within the HR cohort, there was no benefit with GO when measured from study entry. However, in our exploratory analyses for this risk group in which all received SCT, RR was nonsignificantly (P = .08) reduced and, as TRM was similar between arms, improvement in DFS (P = .16) and OS (P = .13) was suggested, though they did not achieve statistical significance. Additional inquiry suggests this was limited to patients with FLT3-ITD HAR, a mutation associated with high CD33 expression.40 These positive interactions with SCT are the likely reason we saw benefit in HR patients alone. If validated in future trials, this is particularly important for this cohort of patients which rarely can receive salvage treatment after relapse.38,39,41
TRM was increased when GO was added, despite a lack of difference in overall toxicity incidence between arms. However, increased TRM was limited to the LR cohort and occurred in individuals with a markedly delayed recovery of neutrophils in the last two (of five) courses of therapy. These last two courses were associated with the most prolonged median times to neutrophil recovery and adding GO seems to have worsened this in a subset of patients. Recent MRC reports showed no benefit with a fifth course of therapy.7,42 COG no longer includes the final course of chemotherapy, which may lessen this risk in future GO trials. Also, the use of GO after remission may not be beneficial as seen in the NOPHO (Nordic Society of Pediatric Hematology and Oncology) trial.43
Although early GO studies saw increased SOS,44 we did not experience this. This is likely a result of our 3 mg/m2 GO dose selection and timing, as GO doses of ≥ 6 mg/m2 or SCT received within 120 days of GO administration primarily increased this risk.44 Overall, toxicity during SCT was not significantly greater in the GO arm. Acute cardiotoxicity, a concern that affected SWOG's choice of anthracycline dosing, was not increased in our trial (although long-term observation is ongoing). Despite a higher infection-related TRM that attenuated GO's affect on DFS and OS in our study, TRM observed in this trial compares favorably with recent COG trials (Appendix Fig A2).3–5,16
Limitations of this trial include its ability to show a statistically significant improvement by AML risk group. This is, and will increasingly be, a challenge and a result of expanding heterogeneity of AML with ever smaller cohorts of relevant biologic factors. Even in adults in whom AML is much more prevalent, a five-trial meta-analysis was needed for adequate statistical power to determine GO's impact on outcome.36 Nevertheless, this is the largest pediatric AML trial reported and likely represents the strongest evidence possible in a pediatric randomized clinical trial.
Our exploratory analyses determining reasons for a postinduction improvement in DFS are admittedly posthoc. However, rather than a broad net of possible factors, this posthoc analysis focused on those associations that have repeatedly been found in recent trials of adult patients. Our findings are consistent with other GO trials and further strengthen the accumulated literature. A new finding from our exploratory analyses was that the benefit of GO was limited to IR patients receiving SCT. This association was further consistent with our finding that HR patients, all of whom received best available donor SCT, specifically those who had FLT3-ITD HAR, also benefited from GO. This will require validation in future trials, though is consistent with recent evidence that GO reduces minimal residual disease and that reduced or absent minimal residual disease pre-SCT is associated with improved post-SCT DFS.45–47
Finally, our findings confirm CD33-targeted therapy added to intensive chemotherapy improves EFS in de novo AML owing to a reduced relapse risk. As doses and schedules have varied among the reported randomized trials,19,21,22 further investigation into optimal methods of GO administration and other CD33-targeted agents in development should be pursued in future trials.10,48
Supplementary Material
Acknowledgment
We thank Tanya Wallas-Shannon, the Children's Oncology Group (COG) protocol coordinator, and Laura (Burden) Francisco, the COG research coordinator, for their great efforts throughout this trial's duration. We also thank the COG institutions and their principal investigators for their diligent efforts in completing this trial. Finally, we thank the patients and their families for their participation.
Appendix
Table A1.
Remission Induction by Risk Factor: Percent of Patients Achieving Remission
| Risk Group* | End of IND1 (CR/PR %; cyto- or molecular risk factors only)* |
End of IND2 (CR only; %) |
||||||||||
|---|---|---|---|---|---|---|---|---|---|---|---|---|
| No. of Patients† |
% of Patients |
P§ | No. of Patients‡ |
% of Patients |
P§ | |||||||
| No-GO | GO | No-GO | GO | Total | No-GO | GO | No-GO | GO | Total | |||
| Low risk | 121 | 125 | NA | NA | NA | NA | 120 | 123 | 95.0 | 97.6 | 96.3 | .33 |
| t(8;21) | 69 | 68 | 92.8 | 86.8 | 89.8 | .25 | 69 | 68 | 92.8 | 98.5 | 95.6 | .21 |
| inv(16)/t(16;16) | 52 | 57 | 98.1 | 94.6 | 96.3 | .62 | 51 | 55 | 98.0 | 96.4 | 97.2 | 1.00 |
| Intermediate risk | 302 | 305 | NA | NA | NA | NA | 294 | 289 | 87.4 | 92.7 | 90.1 | .03 |
| High risk | 88 | 81 | NA | NA | NA | NA | 77 | 74 | 61.0 | 55.4 | 58.3 | .48 |
| −7 | 16 | 9 | 75.0 | 66.7 | 72.0 | .67 | 13 | 8 | 69.2 | 75.0 | 71.4 | 1.00 |
| −5/5q- | 10 | 4 | 90.0 | 33.3 | 76.9 | .11 | 10 | 3 | 90.0 | 100 | 92.3 | 1.00 |
| Course 1 > 15% blasts | 44 | 36 | NA | NA | NA | NA | 36 | 32 | 41.7 | 25.0 | 33.8 | .15 |
| FLT3-ITD: high allelic ratio | 25 | 38 | 65.2 | 78.4 | 73.3 | .26 | 25 | 37 | 68.0 | 73.0 | 71.0 | .67 |
| Total eligible patients¶ | 511 | 511 | 83.4 | 85.8 | 84.6 | .29 | 491 | 486 | 85.1 | 88.3 | 86.7 | .15 |
NOTE. Twenty No-GO patients and 25 GO patients were not evaluable (withdrawal or failure to obtain bone marrow examination) by the end of IND2 and are not included in the remission percentage calculations.
Abbreviations: CR, complete remission; GO, gemtuzumab-ozogamicin arm; IND, induction course; NA, not applicable because risk classification group assignment is defined partially by response at end of IND1; No-GO, did not receive gemtuzumab-ozogamicin (control arm); PR, partial remission (5-15% blasts; only used at end of IND1).
End of IND1 response rates refer only to the specific, nonresponse-based risk factors.
No. of patients at start of IND1 for diagnostic risk factors.
No. of patients at start of IND2, excluding patients who electively withdrew at IND1 or were not evaluable for response at IND2.
P values compare the complete remission percentages between the No-GO and GO arms of therapy.
Overall CR/PR rate regardless of risk group.
Table A2.
Treatment Completion Comparisons Between Study Arms
| Cumulative Reasons for Not Completing All Therapy | Control Arm (No. of Patients) | GO Arm (No. of Patients) | P |
|---|---|---|---|
| Total enrolled | 511 | 511 | |
| Total completing all therapy | 327 | 334 | .65 |
| Total of those not completing all therapy | 184 | 177 | |
| Reasons for not completing all therapy | |||
| Elective withdrawal | 42 | 41 | .94 |
| Withdrawal because of toxicity | 43 | 45 | .65 |
| Toxic mortality | 16 | 20 | .41 |
| Refractory disease/relapsed before therapy completion | 82 | 71 | .39 |
| Lost to follow-up | 1 | 0 | 1.00 |
Abbreviation: GO, gemtuzumab-ozogamicin arm.
Table A3.
Impact of GO With Bone Marrow Transplantation Outcomes for Intermediate-Risk Patients As Treated: From End of INT1 Stratified by Treatment Received (matched family-donor bone marrow transplantation or chemotherapy)
| Patient Group | No. of Patients | 3-Year TRM ± 2SE (%) | TRM HR | 95% CI | P | 3-Year RR ± 2SE (%) | RR HR | 95% CI | P | 3-Year DFS ± 2SE (%) | DFS HR | 95% CI | P | 3-Year OS ± 2SE (%) | OS HR | 95% CI | P |
|---|---|---|---|---|---|---|---|---|---|---|---|---|---|---|---|---|---|
| All IR patients | |||||||||||||||||
| No-GO | 230 | 3.5 ± 2.4 | 1 | 42.6 ± 6.7 | 1 | 53.9 ± 6.7 | 1 | 69.2 ± 6.3 | 1 | ||||||||
| GO | 245 | 4.5 ± 2.7 | 1.28 | 0.51 to 3.18 | .60 | 37.2 ± 6.3 | 0.83 | 0.62 to 1.10 | .19 | 58.3 ± 6.4 | 0.86 | 0.66 to 1.13 | .28 | 72.8 ± 5.9 | 0.87 | 0.63 to 1.21 | .41 |
| Chemotherapy only, IR patients | |||||||||||||||||
| No-GO | 185 | 3.8 ± 2.8 | 1 | 43.9 ± 7.6 | 1 | 52.3 ± 7.6 | 1 | 68.5 ± 7.0 | 1 | ||||||||
| GO | 197 | 5.1 ± 3.1 | 1.33 | 0.51 to 3.50 | .56 | 40.1 ± 7.1 | 0.88 | 0.65 to 1.21 | .44 | 54.8 ± 7.2 | 0.93 | 0.69 to 1.25 | .62 | 70.1 ± 6.8 | 0.95 | 0.66 to 1.36 | .77 |
| BMT recipients only, IR patients | |||||||||||||||||
| No-GO | 45 | 2.2 ± 4.4 | 1 | 37.8 ± 14.7 | 1 | 60.0 ± 14.6 | 1 | 72.6 ± 13.6 | 1 | ||||||||
| GO | 48 | 2.1 ± 4.2 | 0.93 | 0.06 to 14.6 | .96 | 25.2 ± 12.8 | 0.59 | 0.29 to 1.20 | .15 | 72.7 ± 12.9 | 0.60 | 0.30 to 1.19 | .14 | 83.2 ± 10.9 | 0.55 | 0.23 to 1.32 | .17 |
| IR-No-GO arm patients, chemotherapy v BMT recipients | |||||||||||||||||
| HR, CTx v BMT* | 230 | 0.58 | 0.07 to 4.71 | .61 | 0.93 | 0.55 to 1.58 | .80 | 0.89 | 0.54 to 1.46 | .64 | 0.84 | 0.46 to 1.53 | .57 | ||||
| IR-GO arm patients, chemotherapy v BMT recipients | |||||||||||||||||
| HR, CTx v BMT* | 245 | 0.40 | 0.05 to 3.09 | .38 | 0.63 | 0.35 to 1.13 | .12 | 0.58 | 0.33 to 1.02 | .06 | 0.48 | 0.23 to 1.00 | .05 |
Abbreviations: BMT, as-treated intermediate-risk patients who received matched family-donor transplantations; CTx, chemotherapy; DFS, disease-free survival; GO, received gemtuzumab-ozogamicin; HR, hazard ratio; INT, intensification course; IR, all intermediate-risk patients at end of INT1 who proceeded to next phase; No-GO, did not receive gemtuzumab-ozogamicin (control arm); OS, overall survival; RR, relapse rate; TRM, treatment-related mortality.
HR (CTx v BMT). These HRs used the CTx patient outcomes as the reference group that have a HR = 1.
Table A4.
Univariable Risk Factor Analyses From Study Entry
| Characteristic | EFS From Study Entry |
OS From Study Entry |
|||||
|---|---|---|---|---|---|---|---|
| No. of Patients | HR | 95% CI | P | HR | 95% CI | P | |
| Treatment Arm | |||||||
| No-GO | 511 | 1 | 1 | ||||
| GO | 511 | 0.83 | 0.70 to 0.99 | .04 | 0.91 | 0.74 to 1.13 | .39 |
| Age, years | |||||||
| 2-10 | 354 | 1 | 1 | ||||
| 0-1 | 207 | 1.41 | 1.11 to 1.79 | .005 | 1.38 | 1.03 to 1.86 | .03 |
| ≥ 11 | 461 | 1.13 | 0.92 to 1.38 | .24 | 1.32 | 1.03 to 1.69 | .03 |
| WBC | |||||||
| ≤ 100,000 | 824 | 1 | 1 | ||||
| 100,000 | 198 | 1.58 | 1.29 to 1.94 | < .001 | 1.36 | 1.06 to 1.75 | .02 |
| Weight group, ≥ 1 year old | |||||||
| Middleweight | 660 | 1 | 1 | ||||
| Underweight | 69 | 0.8 | 0.54 to 1.18 | .25 | 0.59 | 0.35 to 1.02 | .06 |
| Overweight | 167 | 1.01 | 0.79 to 1.28 | .96 | 1.16 | 0.87 to 1.54 | .32 |
| Race | |||||||
| Not black | 855 | 1 | 1 | ||||
| black | 116 | 1.4 | 1.09 to 1.81 | .010 | 1.98 | 1.50 to 2.62 | < .001 |
| Cytogenetic risk group | |||||||
| Intermediate | 702 | 1 | 1 | ||||
| Low, t(8;21) or inv(16) | 244 | 0.46 | 0.36 to 0.59 | < .001 | 0.38 | 0.27 to 0.53 | < .001 |
| High, mono5/del5q or mono7 | 35 | 1.32 | 0.88 to 2.00 | .19 | 1.88 | 1.22 to 2.91 | .004 |
| Institutional risk group | |||||||
| Intermediate | 607 | 1 | 1 | ||||
| Low | 246 | 0.53 | 0.42 to 0.68 | < .001 | 0.40 | 0.29 to 0.56 | < .001 |
| High | 169 | 1.95 | 1.58 to 2.41 | < .001 | 1.67 | 1.30 to 2.15 | < .001 |
NOTE. Boldfaced P values represent statistically significant differences.
Abbreviations: EFS, event-free survival; GO, received gemtuzumab-ozogamicin; HR, hazard ratio; No-GO, did not receive gemtuzumab-ozogamicin (control arm); OS, overall survival.
Table A5.
Univariable Risk Factor Analyses From End of IND2
| Characteristic | No. of Patients | DFS From End of IND2 |
OS From End of IND2 |
RR From End of IND2 |
TRM From End of IND2 |
||||||||
|---|---|---|---|---|---|---|---|---|---|---|---|---|---|
| HR | 95% CI | P | HR | 95% CI | P | HR | 95% CI | P | HR | 95% CI | P | ||
| Treatment arm | |||||||||||||
| No-GO | 418 | 1 | 1 | 1 | 1 | ||||||||
| GO | 429 | 0.82 | 0.67 to 1.02 | .07 | 0.88 | 0.68 to 1.13 | .32 | 0.73 | 0.58 to 0.91 | .006 | 1.69 | 0.93 to 3.08 | .09 |
| Age, years | |||||||||||||
| 2-10 | 302 | 1 | 1 | 1 | 1 | ||||||||
| 0-1 | 159 | 1.27 | 0.94 to 1.71 | .12 | 1.26 | 0.87 to 1.82 | .22 | 1.31 | 0.95 to 1.80 | .10 | 0.82 | 0.21 to 3.15 | .77 |
| ≥ 11 | 386 | 1.19 | 0.94 to 1.51 | .14 | 1.35 | 1.01 to 1.80 | .04 | 0.94 | 0.73 to 1.20 | .62 | 4.15 | 1.85 to 9.33 | .001 |
| WBC | |||||||||||||
| ≤ 100,000 | 704 | 1 | 1 | 1 | 1 | ||||||||
| 100,000 | 143 | 1.35 | 1.04 to 1.75 | .02 | 1.19 | 0.87 to 1.65 | .28 | 1.51 | 1.15 to 1.98 | .003 | 0.59 | 0.23 to 1.51 | .27 |
| Weight group, ≥ 1 year old | |||||||||||||
| Middleweight | 556 | 1 | 1 | 1 | 1 | ||||||||
| Underweight | 61 | 0.86 | 0.55 to 1.33 | .49 | 0.63 | 0.34 to 1.16 | .14 | 0.91 | 0.57 to 1.44 | .67 | 0.63 | 0.15 to 2.66 | .53 |
| Overweight | 143 | 1.10 | 0.83 to 1.46 | .50 | 1.33 | 0.97 to 1.83 | .08 | 1.03 | 0.75 to 1.40 | .87 | 1.36 | 0.66 to 2.79 | 0.41 |
| Race | |||||||||||||
| Not black | 715 | 1 | 1 | 1 | 1 | ||||||||
| Black | 93 | 1.48 | 1.09 to 2.00 | .01 | 1.93 | 1.38 to 2.70 | < .001 | 1.29 | 0.92 to 1.81 | .15 | 1.97 | 0.95 to 4.11 | .07 |
| Cytogenetic risk group | |||||||||||||
| Intermediate | 562 | 1 | 1 | 1 | 1 | ||||||||
| Low, t(8;21) or inv(16) | 232 | 0.54 | 0.41 to 0.70 | < .001 | 0.40 | 0.28 to 0.57 | < .001 | 0.49 | 0.37 to 0.65 | < .001 | 1.11 | 0.54 to 2.26 | .78 |
| High, mono5/del5q or mono7 | 24 | 1.28 | 0.75 to 2.19 | .37 | 1.86 | 1.06 to 3.27 | .03 | 0.67 | 0.34 to 1.33 | .25 | 6.33 | 2.64 to 15.2 | < .001 |
| Institutional risk group | |||||||||||||
| Intermediate | 525 | 1 | 1 | 1 | 1 | ||||||||
| Low | 234 | 0.56 | 0.43 to 0.72 | < .001 | 0.41 | 0.28 to 0.59 | < .001 | 0.51 | 0.38 to 0.67 | < .001 | 1.23 | 0.59 to 2.56 | .59 |
| High | 88 | 1.20 | 0.88 to 1.64 | .25 | 1.5 | 1.06 to 2.13 | .02 | 0.80 | 0.55 to 1.16 | .25 | 4.61 | 2.38 to 8.95 | < .001 |
NOTE. Boldfaced P values represent statistically significant differences.
Abbreviations: DFS, disease-free survival; HR, hazard ratio; GO, received gemtuzumab-ozogamicin; IND, induction course; No-GO, did not receive gemtuzumab-ozogamicin (control arm); OS, overall survival; RR, relapse rate; TRM, treatment-related mortality.
Table A6.
Toxicities by Course and by Arm
| Arm | IND1 |
IND2 |
INT1 |
INT2 |
INT3 |
SCT |
||||||
|---|---|---|---|---|---|---|---|---|---|---|---|---|
| No-GO (n = 511) | GO (n = 511) | No-GO (n = 474) | GO (n = 477) | No-GO (n = 417) | GO (n = 434) | No-GO (n = 302) | GO (n = 324) | No-GO (n = 259) | GO (n = 255) | No-GO (n = 75) | GO (n = 82) | |
| Overall nonhematologic toxicity | ||||||||||||
| Any grade ≥ 3 toxicity | ||||||||||||
| No. of patients | 389 | 388 | 305 | 311 | 312 | 317 | 261 | 284 | 216 | 217 | 61 | 71 |
| % | 76 | 76 | 64 | 65 | 75 | 73 | 86 | 88 | 83 | 85 | 81 | 87 |
| Hematologic recovery* | ||||||||||||
| Median time to plts > 50,000, days | 26 | 28 | 24 | 25 | 25 | 26 | 38 | 41 | 42 | 44 | 40 | 45 |
| No. of patients with plts never > 50,000 | 103 | 104 | 75 | 79 | 73 | 62 | 98 | 115 | 78 | 67 | 13 | 14 |
| Median time to ANC > 500, days | 30 | 30 | 28 | 28 | 27 | 28 | 37 | 38 | 40 | 39 | 30 | 31 |
| No. of patients who needed > 59 days for ANC recovery | 1 | 0 | 1 | 0 | 0 | 0 | 19† | 39† | 9 | 11 | 3 | 1 |
| No. of patients whose ANC was never > 500‡ | 125 | 121 | 78 | 70 | 62 | 49 | 42 | 53 | 47 | 44 | 6 | 6 |
| Infection incidence, No. of patients | ||||||||||||
| Documented infection | 178 | 182 | 175 | 169 | 206 | 209 | 209 | 224 | 173 | 173 | 41 | 46 |
| Neutropenic fever | 158 | 163 | 103 | 117 | 97 | 93 | 68 | 77 | 47 | 62 | 14 | 15 |
| Therapy dose reduced, No. of patients | 6 | 11 | 10 | 6 | 4 | 6 | 8 | 15 | 10 | 4 | 5 | 5 |
| Toxic mortality during therapy | ||||||||||||
| Nonleukemic death, No. of patients | 9 | 9 | 2 | 2 | 0 | 2 | 5 | 7 | 3 | 7 | 3 | 2 |
| Course day of death | ||||||||||||
| Median | 8 | 10 | 13, 25 | 12, 24 | — | 16, 21 | 53 | 59 | 18 | 30 | 50 | 53, 124 |
| Range | 1-56 | 0-28 | 14-93 | 9-88 | 15-19 | 17-41 | 49-60 | |||||
| LR nonleukemic death, No. of patients | 0 | 3 | 1 | 0 | 0 | 1 | 2 | 4 | 0 | 4 | NA | NA |
| LR course day of death | ||||||||||||
| Median | — | 19 | 13 | — | — | 21 | 63, 93 | 70 | — | 33 | — | — |
| Range | 0-20 | 59-88 | 17-42 | |||||||||
Abbreviations: ANC, absolute neutrophil count; GO, received gemtuzumab-ozogamicin; IND, induction course; INT, intensification course; LR, low risk; NA, not applicable; No-GO, did not receive gemtuzumab-ozogamicin (control arm); plts, platelets; SCT, stem-cell transplantation (matched-family and alternative donor).
Hematologic recovery values do not include those patients who died during their respective courses.
P = .01.
If ANC was never > 500, patient proceeded to next course before ANC recovery.
Table A7.
Median Survival Rates for Outcomes
| Outcome | All Patients |
Low Risk |
Intermediate Risk |
High Risk |
||||||||||||
|---|---|---|---|---|---|---|---|---|---|---|---|---|---|---|---|---|
| No-GO Arm |
GO Arm |
No-GO Arm |
GO Arm |
No-GO Arm |
GO Arm |
No-GO Arm |
GO Arm |
|||||||||
| Median | 95% CI | Median | 95% CI | Median | 95% CI | Median | 95% CI | Median | 95% CI | Median | 95% CI | Median | 95% CI | Median | 95% CI | |
| Overall survival | NR | NR | NR | NR | NR | NR | 29.0 | 18.5 to ∞ | 32.9 | 4.9 to ∞ | ||||||
| Event-free survival | 24.2 | 16.6 to 47.7 | NR | NR | NR | 20.3 | 14.1 to 40.7 | NR | 7.7 | 4.9 to 12.8 | 6.3 | 2.9 to 15.0 | ||||
NOTE. All values expressed as months. Associated actuarial survival curves are illustrated in Figure 2.
Abbreviations: GO, received gemtuzumab-ozogamicin; No-GO, did not receive gemtuzumab-ozogamicin (control arm); NR, survival exceeds 50%, so median survival was not reached.
Fig A1.

Outcome by study arm in patients who underwent stem-cell transplantation (SCT). (A) Disease-free survival (DFS) and relapse risk (RR) from end of intensification (INT) 1 in intermediate-risk patients by intent-to-treat with matched family donor (MFD) SCT versus chemotherapy and by study arm. (B) DFS from end of induction (IND) 2 by high-risk (HR) factor (FLT-3 internal tandem duplication high allelic ratio [ITD HAR] or other, such as poor-risk cytogenetics or persistent disease at end of IND1) by study arm. (C) RR from end of IND2 by HR factor (ITD HAR or other, such as poor-risk cytogenetics or persistent disease at end of IND1) by study arm. GO, gemtuzumab-ozogamicin arm; No-GO, did not receive gemtuzumab-ozogamicin (control arm).
Fig A2.
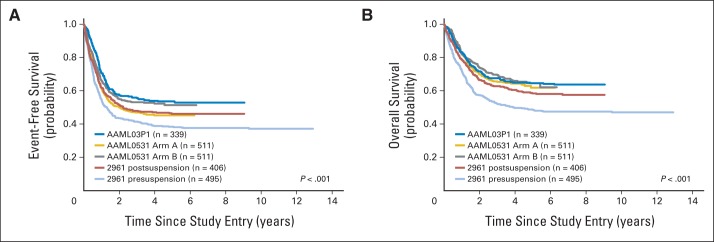
Comparison of Children's Oncology Group Acute Myeloid Lymphoma trials. (A) Event-free and (B) overall survival by AAML0531 treatment arm compared with AAML03P1 (gemtuzumab pilot similar to the gemtuzumab-ozogamicin arm [GO] arm, ie, arm B of AAML0531) and CCG-2961 (used Ida-DCTER [idarubicin, decadron, cytarabine, thioguanine, etoposide, daunorubicin] intensive timing chemotherapy) pre- and postsuspension to add supportive care measures that included mandatory hospitalization until count recovery, avoidance of corticosteroids, prophylactic fluconazole, and intravenous immunoglobulin.
Footnotes
Supported by Chair's Grant No. U10 CA98543-08 and Statistics and Data Center Grant No. CA98413-08 of the Children's Oncology Group (COG) from the National Cancer Institute, National Institutes of Health.
Presented in part at the 55th Annual Meeting of the American Society of Hematology, New Orleans, LA, December 7-10, 2013.
Authors' disclosures of potential conflicts of interest and author contributions are found at the end of this article.
Clinical trial information: NCT00372593.
AUTHORS' DISCLOSURES OF POTENTIAL CONFLICTS OF INTEREST
The author(s) indicated no potential conflicts of interest.
AUTHOR CONTRIBUTIONS
Conception and design: Alan S. Gamis, Todd A. Alonzo, Soheil Meshinchi, Laura Winter, Stella M. Davies, Franklin O. Smith, Richard Aplenc
Administrative support: Kathleen Glick
Collection and assembly of data: Alan S. Gamis, Soheil Meshinchi, Lillian Sung, Robert B. Gerbing, Susana C. Raimondi, Betsy A. Hirsch, Samir B. Kahwash, Amy Heerema-McKenney, Kathleen Glick, Patti Byron, Franklin O. Smith, Richard Aplenc
Data analysis and interpretation: Alan S. Gamis, Todd A. Alonzo, Lillian Sung, Robert B. Gerbing, Susana C. Raimondi, Betsy A. Hirsch, Samir B. Kahwash, Amy Heerema-McKenney, Franklin O. Smith, Richard Aplenc
Manuscript writing: All authors
Final approval of manuscript: All authors
REFERENCES
- 1.Smith MA, Seibel NL, Altekruse SF, et al. Outcomes for children and adolescents with cancer: Challenges for the twenty-first century. J Clin Oncol. 2010;28:2625–2634. doi: 10.1200/JCO.2009.27.0421. [DOI] [PMC free article] [PubMed] [Google Scholar]
- 2.Gamis AS, Alonzo TA, Perentesis JP, et al. Children's Oncology Group's 2013 blueprint for research: Acute myeloid leukemia. Pediatr Blood Cancer. 2013;60:964–971. doi: 10.1002/pbc.24432. [DOI] [PMC free article] [PubMed] [Google Scholar]
- 3.Woods WG, Kobrinsky N, Buckley JD, et al. Timed-sequential induction therapy improves postremission outcome in acute myeloid leukemia: A report from the Children's Cancer Group. Blood. 1996;87:4979–4989. [PubMed] [Google Scholar]
- 4.Lange BJ, Smith FO, Feusner J, et al. Outcomes in CCG-2961, a Children's Oncology Group phase 3 trial for untreated pediatric acute myeloid leukemia: A report from the Children's Oncology Group. Blood. 2008;111:1044–1053. doi: 10.1182/blood-2007-04-084293. [DOI] [PMC free article] [PubMed] [Google Scholar]
- 5.Woods WG, Neudorf S, Gold S, et al. A comparison of allogeneic bone marrow transplantation, autologous bone marrow transplantation, and aggressive chemotherapy in children with acute myeloid leukemia in remission. Blood. 2001;97:56–62. doi: 10.1182/blood.v97.1.56. [DOI] [PubMed] [Google Scholar]
- 6.Stevens RF, Hann IM, Wheatley K, et al. Marked improvements in outcome with chemotherapy alone in paediatric acute myeloid leukemia: Results of the United Kingdom Medical Research Council's 10th AML trial—MRC Childhood Leukaemia Working Party. Br J Haematol. 1998;101:130–140. doi: 10.1046/j.1365-2141.1998.00677.x. [DOI] [PubMed] [Google Scholar]
- 7.Gibson BE, Webb DK, Howman AJ, et al. Results of a randomized trial in children with acute myeloid leukaemia: Medical research council AML12 trial. Br J Haematol. 2011;155:366–376. doi: 10.1111/j.1365-2141.2011.08851.x. [DOI] [PubMed] [Google Scholar]
- 8.Bernstein I. CD33 as a target for selective ablation of acute myeloid leukemia. Clin Lymphoma. 2002;2(suppl 1):S9–S11. doi: 10.3816/clm.2002.s.002. [DOI] [PubMed] [Google Scholar]
- 9.Walter RB, Appelbaum FR, Estey EH, et al. Acute myeloid leukemia stem cells and CD33-targeted immunotherapy. Blood. 2012;119:6198–6208. doi: 10.1182/blood-2011-11-325050. [DOI] [PMC free article] [PubMed] [Google Scholar]
- 10.Ricart AD. Antibody-drug conjugates of calicheamicin derivative: Gemtuzumab ozogamicin and inotuzumab ozogamicin. Clin Cancer Res. 2011;17:6417–6427. doi: 10.1158/1078-0432.CCR-11-0486. [DOI] [PubMed] [Google Scholar]
- 11.Arceci RJ, Sande J, Lange B, et al. Safety and efficacy of gemtuzumab ozogamicin in pediatric patients with advanced CD33+ acute myeloid leukemia. Blood. 2005;106:1183–1188. doi: 10.1182/blood-2004-10-3821. [DOI] [PubMed] [Google Scholar]
- 12.Sievers EL, Appelbaum FR, Spielberger RT, et al. Selective ablation of acute myeloid leukemia using antibody-targeted chemotherapy: A phase I study of an anti-CD33 calicheamicin immunoconjugate. Blood. 1999;93:3678–3684. [PubMed] [Google Scholar]
- 13.Zwaan CM, Reinhardt D, Corbacioglu S, et al. Gemtuzumab ozogamicin: First clinical experiences in children with relapsed/refractory acute myeloid leukemia treated on compassionate-use basis. Blood. 2003;101:3868–3871. doi: 10.1182/blood-2002-07-1947. [DOI] [PubMed] [Google Scholar]
- 14.Sievers EL, Larson RA, Stadtmauer EA, et al. Efficacy and safety of gemtuzumab ozogamicin in patients with CD33-positive acute myeloid leukemia in first relapse. J Clin Oncol. 2001;19:3244–3254. doi: 10.1200/JCO.2001.19.13.3244. [DOI] [PubMed] [Google Scholar]
- 15.Aplenc R, Alonzo TA, Gerbing RB, et al. Safety and efficacy of gemtuzumab ozogamicin in combination with chemotherapy for pediatric acute myeloid leukemia: A report from the Children's Oncology Group. J Clin Oncol. 2008;26:2390–2395. doi: 10.1200/JCO.2007.13.0096. [DOI] [PMC free article] [PubMed] [Google Scholar]
- 16.Cooper TM, Franklin J, Gerbing RB, et al. AAML03P1, a pilot study of the safety of gemtuzumab ozogamicin in combination with chemotherapy for newly diagnosed childhood acute myeloid leukemia: A report from the Children's Oncology Group. Cancer. 2012;118:761–769. doi: 10.1002/cncr.26190. [DOI] [PubMed] [Google Scholar]
- 17.Kell WJ, Burnett AK, Chopra R, et al. A feasibility study of simultaneous administration of gemtuzumab ozogamicin with intensive chemotherapy in induction and consolidation in younger patients with acute myeloid leukemia. Blood. 2003;102:4277–4283. doi: 10.1182/blood-2003-05-1620. [DOI] [PubMed] [Google Scholar]
- 18.Bross PF, Beitz J, Chen G, et al. Approval summary: Gemtuzumab ozogamicin in relapsed acute myeloid leukemia. Clin. Cancer Res. 2001;7:1490–1496. [PubMed] [Google Scholar]
- 19.Petersdorf SH, Kopecky KJ, Slovak M, et al. A phase 3 study of gemtuzumab ozogamicin during induction and postconsolidation therapy in younger patients with acute myeloid leukemia. Blood. 2013;121:4854–4860. doi: 10.1182/blood-2013-01-466706. [DOI] [PMC free article] [PubMed] [Google Scholar]
- 20.Rowe JM, Löwenberg B. Gemtuzumab ozogamicin in acute myeloid leukemia: A remarkable saga about an active drug. Blood. 2013;121:4838–4841. doi: 10.1182/blood-2013-03-490482. [DOI] [PubMed] [Google Scholar]
- 21.Castaigne S, Pautas C, Terré C, et al. Effect of gemtuzumab ozogamicin on survival of adult patients with de-novo acute myeloid leukaemia (ALFA-0701): A randomised, open-label, phase 3 study. Lancet. 2012;379:1508–1516. doi: 10.1016/S0140-6736(12)60485-1. [DOI] [PubMed] [Google Scholar]
- 22.Burnett AK, Hills RK, Milligan D, et al. Identification of patients with acute myeloblastic leukemia who benefit from the addition of gemtuzumab ozogamicin: Results of the MRC AML15 trial. J Clin Oncol. 2011;29:369–377. doi: 10.1200/JCO.2010.31.4310. [DOI] [PubMed] [Google Scholar]
- 23.Vardiman JW, Harris NL, Brunning RD. The World Health Organization (WHO) classification of the myeloid neoplasms. Blood. 2002;100:2292–2302. doi: 10.1182/blood-2002-04-1199. [DOI] [PubMed] [Google Scholar]
- 24.van der Velden VH, Boeckx N, Jedema I, et al. High CD33-antigen loads in peripheral blood limit the efficacy of gemtuzumab ozogamicin (Mylotarg) treatment in acute myeloid leukemia patients. Leukemia. 2004;18:983–988. doi: 10.1038/sj.leu.2403350. [DOI] [PubMed] [Google Scholar]
- 25.Chevallier P, Roland V, Mahé B, et al. Administration of mylotarg 4 days after beginning of a chemotherapy including intermediate-dose aracytin and mitoxantrone (MIDAM regimen) produces a high rate of complete hematologic remission in patients with CD33+ primary resistant or relapsed acute myeloid leukemia. Leuk Res. 2005;29:1003–1007. doi: 10.1016/j.leukres.2005.02.005. [DOI] [PubMed] [Google Scholar]
- 26.Meshinchi S, Alonzo TA, Stirewalt DL, et al. Clinical implications of FLT3 mutations in pediatric AML. Blood. 2006;108:3654–3661. doi: 10.1182/blood-2006-03-009233. [DOI] [PMC free article] [PubMed] [Google Scholar]
- 27.Wheatley K, Burnett AK, Goldstone AH, et al. A simple, robust, validated and highly predictive index for the determination of risk-directed therapy in acute myeloid leukaemia derived from the MRC AML 10 trial: United Kingdom Medical Research Council's Adult and Childhood Leukaemia Working Parties. Br J Haematol. 1999;107:69–79. doi: 10.1046/j.1365-2141.1999.01684.x. [DOI] [PubMed] [Google Scholar]
- 28.Kottaridis PD, Gale RE, Frew ME, et al. The presence of a FLT3 internal tandem duplication in patients with acute myeloid leukemia (AML) adds important prognostic information to cytogenetic risk group and response to the first cycle of chemotherapy: Analysis of 854 patients from the United Kingdom Medical Research Council AML 10 and 12 trials. Blood. 2001;98:1752–1759. doi: 10.1182/blood.v98.6.1752. [DOI] [PubMed] [Google Scholar]
- 29.Kaplan EL, Meier P. Nonparametric estimation from incomplete observations. J Am Stat Assoc. 1958;53:457–481. [Google Scholar]
- 30.Kalbfleisch JD, Prentice RL. New York, NY: John Wiley & Sons; 1980. The statistical analysis of failure time data: 1980. [Google Scholar]
- 31.Cox DR. Regression models and life-tables. J R Stat Soc B. 1972;34:187–220. [Google Scholar]
- 32.Fine JP, Gray RJ. A proportional hazards model for the subdistribution of a competing risk. J Am Stat Assoc. 1999;94:496–509. [Google Scholar]
- 33.Burnett AK, Russell NH, Hills RK, et al. Addition of gemtuzumab ozogamicin to induction chemotherapy improves survival in older patients with acute myeloid leukemia. J Clin Oncol. 2012;30:3924–3931. doi: 10.1200/JCO.2012.42.2964. [DOI] [PubMed] [Google Scholar]
- 34.Fernandez HF, Sun Z, Yao X, et al. Anthracycline dose intensification in acute myeloid leukemia. N Engl J Med. 2009;361:1249–1259. doi: 10.1056/NEJMoa0904544. [DOI] [PMC free article] [PubMed] [Google Scholar]
- 35.Löwenberg B, Ossenkoppele GJ, van Putten W, et al. High-dose daunorubicin in older patients with acute myeloid leukemia. N Engl J Med. 2009;361:1235–1248. doi: 10.1056/NEJMoa0901409. [DOI] [PubMed] [Google Scholar]
- 36.Hills RK, Petersdorf S, Estey EH, et al. The addition of gemtuzumab ozogamicin (GO) to induction chemotherapy reduces relapse and improves survival in patients without adverse risk karyotype: Results of an individual patient meta-analysis of the five randomised trials. Blood. 2013;122:356. [Google Scholar]
- 37.Gibson BE, Wheatley K, Hann IM, et al. Treatment strategy and long-term results in paediatric patients treated in consecutive UK AML trials. Leukemia. 2005;19:2130–2138. doi: 10.1038/sj.leu.2403924. [DOI] [PubMed] [Google Scholar]
- 38.Webb DK, Wheatley K, Harrison G, et al. Outcome for children with relapsed acute myeloid leukaemia following initial therapy in the Medical Research Council (MRC) AML 10 trial: MRC Childhood Leukaemia Working Party. Leukemia. 1999;13:25–31. doi: 10.1038/sj.leu.2401254. [DOI] [PubMed] [Google Scholar]
- 39.Burnett AK, Goldstone A, Hills RK, et al. Curability of patients with acute myeloid leukemia who did not undergo transplantation in first remission. J Clin Oncol. 2013;31:1293–1301. doi: 10.1200/JCO.2011.40.5977. [DOI] [PubMed] [Google Scholar]
- 40.Pollard JA, Alonzo TA, Loken M, et al. Correlation of CD33 expression level with disease characteristics and response to gemtuzumab ozogamicin containing chemotherapy in childhood AML. Blood. 2012;119:3705–3711. doi: 10.1182/blood-2011-12-398370. [DOI] [PMC free article] [PubMed] [Google Scholar]
- 41.Forman SJ, Rowe JM. The myth of the second remission of acute leukemia in the adult. Blood. 2013;121:1077–1082. doi: 10.1182/blood-2012-08-234492. [DOI] [PMC free article] [PubMed] [Google Scholar]
- 42.Burnett AK, Russell NH, Hills RK, et al. Optimization of chemotherapy for younger patients with acute myeloid leukemia: Results of the Medical Research Council AML15 Trial. J Clin Oncol. 2013;31:3360–3368. doi: 10.1200/JCO.2012.47.4874. [DOI] [PubMed] [Google Scholar]
- 43.Hasle H, Abrahamsson J, Forestier E, et al. Gemtuzumab ozogamicin as postconsolidation therapy does not prevent relapse in children with AML: Results from NOPHO-AML 2004. Blood. 2012;120:978–984. doi: 10.1182/blood-2012-03-416701. [DOI] [PubMed] [Google Scholar]
- 44.Wadleigh M, Richardson PG, Zahrieh D, et al. Prior gemtuzumab ozogamicin exposure significantly increases the risk of veno-occlusive disease in patients who undergo myeloablative allogeneic stem cell transplantation. Blood. 2003;102:1578–1582. doi: 10.1182/blood-2003-01-0255. [DOI] [PubMed] [Google Scholar]
- 45.O'Hear C, Inaba H, Pounds S, et al. Gemtuzumab ozogamicin can reduce minimal residual disease in patients with childhood acute myeloidleukemia. Cancer. 2013;119:4036–4043. doi: 10.1002/cncr.28334. [DOI] [PMC free article] [PubMed] [Google Scholar]
- 46.Walter RB, Buckley SA, Pagel JM, et al. Significance of minimal residual disease before myeloablative allogeneic hematopoietic cell transplantation for AML in first and second complete remission. Blood. 2013;122:1813–1821. doi: 10.1182/blood-2013-06-506725. [DOI] [PMC free article] [PubMed] [Google Scholar]
- 47.Horan JT, Meshinchi S, Loken MR, et al. Impact of residual disease on survival in pediatricpatients receiving allogeneic hematopoietic cell transplantation for acute myeloid leukemia in first complete remission. Blood. 2013;122:65. [Google Scholar]
- 48.Kung Sutherland MS, Walter RB, Jeffrey SC, et al. SGN-CD33A: A novel CD33-targeting antibody-drug conjugate using a pyrrolobenzodiazepine dimer is active in models of drug-resistant AML. Blood. 2013;122:1455–1463. doi: 10.1182/blood-2013-03-491506. [DOI] [PubMed] [Google Scholar]
Associated Data
This section collects any data citations, data availability statements, or supplementary materials included in this article.