

Abstract
Informative censoring in a progression-free survival (PFS) analysis arises when patients are censored for initiation of an effective anticancer treatment before the protocol-defined progression, and these patients are at a different risk for treatment failure than those who continue on therapy. This may cause bias in the estimated PFS when using the Kaplan-Meier method for analysis. Although there are several articles that discuss this issue from a theoretical perspective or in randomized phase III studies, there are little data to demonstrate the magnitude of the bias on the estimated quantities from a phase II trial. This article describes the issues by using two oncology phase II trials as examples, evaluates the impact of the bias using simulations, and provides recommendations. The two trials were selected because they demonstrate two different reasons for censoring. Simulations show that the magnitude of the bias depends primarily on the proportion of patients who are informatively censored and secondarily on the hazard ratio between the group of patients who remain on study and the group of patients who are informatively censored. Recommendations include using an alternative end point, which includes inadequate response and initial signs of clinical progression as treatment failure, and a competing risk analysis for studies in which competing events preclude or modify the probability of observing the primary event of interest. If informative censoring cannot be avoided, then all patients should be observed until progression, and sensitivity analyses should be used as appropriate.
INTRODUCTION
Phase II clinical trials aim to identify promising therapies for comparison with standard treatment in randomized phase III trials. These studies are often single-arm, open-label clinical trials with the goal of evaluating the impact of treatment on short-term tumor burden measures such as response rates and long-term measures such as progression-free survival (PFS), as well as further evaluating the safety profile of the treatment among a group of patients who are likely to participate in a phase III trial. In these trials, patients may be taken off study before progression for reasons such as toxicity, patient or physician preference, initiation of nonprotocol therapy, or inadequate response. If, in a Kaplan-Meier (KM) analysis1 of PFS, these observations are censored at the time patients went off study, and the censored patients are at a different risk for treatment failure than those who remain on study, one of the key assumptions of the KM method, called noninformative censoring, is violated. In these situations, the KM PFS estimate may be biased. The direction of the bias depends on whether those who come off study are at lower or higher risk for the event of interest relative to those who stay on study. As demonstrated in Figure 1, the former would underestimate and the latter would overestimate the median and point estimates. Although this issue has been discussed extensively in the statistical literature from the theoretical perspective2–17 and for randomized phase III studies comparing two or more therapies,18,19 there are few empirical data to demonstrate the magnitude of the bias for various amounts of informative censoring in the phase II setting. In this article, we describe situations in which informative censoring may occur, evaluate the impact on the estimated quantities via simulation, and recommend guidelines for design, analysis, and end point definition in the context of phase II clinical trials.
Fig 1.

The anticipated direction of the bias in the 12-month and median progression-free survival (PFS) estimates is shown when patients who come off study are at a higher risk for progression (A, B) or a lower risk for progression (C, D). The yellow line represents the true but unknown PFS. The blue line represents the PFS estimate using the Kaplan-Meier method for simulated patients with Waldenström macroglobulinemia in (A) and (B) where 20% start nonprotocol therapy before progressive disease (PD; assuming hazard rate per month of PD λ1(t) = 0.06 and λ2(t) = 4λ1(t)) and simulated patients with simulated multiple myeloma in (C) and (D) where 40% proceed to autologous stem-cell transplantation before PD (assuming λ1(t) = 0.108; λ1(t) = 2λ2(t)). PT and MT indicate the true 12-month PFS and the true median PFS. PE and ME indicate the estimates for 12-month and the median PFS.
Two motivating examples are used to illustrate the issues and form the basis for the simulations. The examples were selected because they demonstrate two different reasons for censoring. In the first example, patients with Waldenström macroglobulinemia (WM) may be taken off study because of inadequate response or initial signs of clinical progression without satisfying protocol-defined progression criteria. In the literature, the percentage of patients ranges from 1% to 35%.20 This population of patients is likely to have a higher risk of progression compared with those who remain on study, and therefore the median PFS estimates may be overestimated. In a relapsed/refractory WM phase II study21 in which 35% of the patients initiated nonprotocol therapy (NPT) before progression, the estimated median PFS with patients censored at the time of NPT was 12.6 months (90% CI, 10.2 to 22.7 months), whereas the estimated median event-free survival (EFS), which assumes NPT initiation as an event, was 8.3 months (90% CI, 6.7 to 12.0 months).
In the second example of upfront therapy for multiple myeloma (MM) clinical trials, patients have the option to undergo consolidation with high-dose melphalan and autologous stem-cell transplantation (ASCT) off study after a prespecified minimum number of induction cycles with the aim of both deepening and prolonging response.22 In this case, the ASCT is considered NPT. It is documented in the literature that achievement of a complete remission both before23,24 and after transplantation22–32 is associated with longer PFS and overall survival (OS). This group of patients, especially if they are young and relatively healthy, may have a lower risk for progression compared with those patients who do not proceed to ASCT, and therefore the median PFS may be underestimated. In a study of lenalidolmide, bortezomib, and dexamethasone in patients with upfront treatment for MM,33 42% of patients continued on to transplantation before progression after a minimum of four induction cycles. Although the primary end point was response after four cycles, a secondary end point was PFS. Because of the high percentage of patients who received ASCT and the potential for bias, patients who proceeded to transplantation were not censored in this analysis, and all patients were observed until progression. The 12-month PFS estimate of 80% (95% CI, 65% to 89%) is therefore interpreted as the impact of induction therapy either with or without ASCT as a full treatment strategy. The PFS estimate with patients censored at the time of transplantation was 72% (95% CI, 53% to 85%).
METHODS
Simulation studies were performed to evaluate the bias in the KM PFS estimates in the presence of informative censoring. The simulation parameters were selected on the basis of the examples.20,22–32 Sample size ranged from 25 to 60 for the WM study and 40 to 100 for the MM study. We also included 1,000 patients to evaluate the bias in the large sample setting. The hazard per month for progression was λ1(t) = 0.03 for upfront treatment for WM, λ1(t) = 0.06 for relapsed/refractory WM, and λ1(t) = 0.036 or λ1(t) = 0.108 for upfront treatment for MM. For the patients who received NPT before progression, the hazard per month was either 1, 2, or 4 times higher than the hazard for those who stayed on study (ie, λ2(t) = 2λ1(t) or λ2(t) = 4λ1(t), respectively) or 1, 2, 3, or 4 times lower than the hazard for those who stayed on study (ie, λ1(t) = 2λ2(t), λ1(t) = 3λ2(t), or λ1(t) = 4λ2(t), respectively). The proportions of informative censoring selected were 1%, 10%, 20%, 30%, and 40%. For each parameter combination, 2,000 simulated studies were generated, so that the 95% CI width of an estimated proportion is less than 0.02.
To generate censored PFS data, two distributions are required, one for the failure times, which would be observed if the patients were observed long enough to reach an event, and one for the censoring times (ie, time to initiation of NPT). To generate the time to progression, the piecewise exponential model (see Data Supplement) used in the simulations is
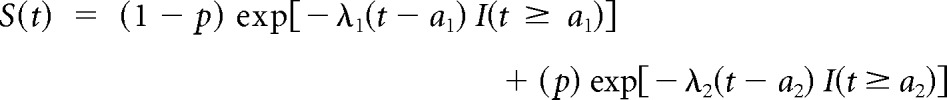 |
where I(a) is the indicator function, which is equal to 1 if t ≥ a and 0 otherwise, t is the time from the treatment initiation, and p is the proportion of patients who are informatively censored. This model allows for the two different hazard rate parameters for those who stay on study (λ1) versus those who are informatively censored (λ2) and for flexibility in defining when failure times start. For example, WM and MM disease evaluations are often not done until after two cycles of therapy (approximately 2 months). Therefore, no failures are generated before 2 months in the simulation (a1 = a2 = 2 for WM; a1 = 2 for MM). In addition, for MM, no failures are generated before 6 months (a2 = 6) for the patients who continue to transplantation because patients usually receive four to six induction cycles. The time of ASCT in the MM simulations is generated based on random uniform distribution between 4 and 6 months. For the WM simulated data, the time of NPT before progression is restricted to occur 1 to 2 months before progression time based on uniform distribution. This was done because patients who come off study before progression are likely to have progressed shortly thereafter, and it reflects not only an increased risk for the censored patients but a direct dependence between the censoring and progression times. Without loss of generality, noninformative administrative censoring was assumed to occur after 48 months to allow for evaluation of the informative censoring. The observed failure time for each patient is the earliest of progression, NPT initiation, and the administrative censoring. The full set of simulations were repeated incorporating noninformative censoring, which was independently generated based on uniform distribution.
For each of the 2,000 simulated data sets, the KM estimate for median PFS and point estimates34 were computed, and the percent relative mean bias was reported (see Data Supplement for the definition). Box plots were used to graphically illustrate the factors that influenced the distribution of the bias in the KM estimates.
RESULTS
The simulations show that the magnitude of the bias depends primarily on the proportion of patients who are informatively censored and secondarily on the hazard ratio between those who are informatively censored and those who remain on study. For brevity, results are discussed only for a few simulations sets; however, the interpretation of the results is similar for the other simulation sets (details are provided in the Data Supplement). Results from the simulations with noninformative censoring are similar as expected from statistical theory and therefore are not discussed further (Data Supplement).
The dependence of the relative percent bias on the proportion of informative censoring is clearly illustrated in Figures 2A and 2B for a set of simulations with 40 patients with relapsed/refractory WM and assuming informatively censored patients are at four times higher risk for progression (Data Supplement). When only 1% of the patients come off study before progression, the relative mean bias of the KM estimations is below 1%, which means that the estimation of the end point is, at most, 1% above the true but unknown value. The relative mean bias quickly increases as the proportion of patients who start NPT before progression increases. For instance, when 20% and 40% of the patients initiate an NPT before progression, the 12-month PFS is overestimated on average by 27% and 72%, respectively, and the median PFS is overestimated on average by 36% and 92%, respectively.
Fig 2.

Distribution of relative bias (%) by proportion of patients with relapsed/refractory Waldenström macroglobulinemia who receive nonprotocol therapy before progression (A) and (B) and by ratio between hazard rate of the group of patients who remain on study and the hazard rate of the group of patients who come off study before progression and by the specific value of the hazard rates themselves (C) and (D), assuming 20% of the patients are informatively censored. Results are shown for 40 patients. (A) and (C) show the impact on the 12-month progression-free survival estimates, and (B) and (D) show the impact on the median progression-free survival. The x axis in (A) and (B) is the proportion of patients who receive nonprotocol therapy before progression. The x axis in (C) and (D) is the hazard ratio (λ2(t)/λ1(t)). In (B) and (D), 34 and four outliers above 200% are not shown, respectively, to keep the same scale of the y axis in the four panels. The minimum and the maximum values of the relative bias for each scenario are provided in the Data Supplement. The boxplot provides summary of the quantiles of the relative percent bias. The solid black line in the box represents the median relative percent bias, the bottom of the box is the 25th quantile, the top of the box is the 75th quantile, the line below the box is the 5th quantile, the line above the box is the 95th quantile and the points are outliers.
The extent of the bias secondarily depends on the hazard ratio (Figs 2C and 2D). With 20% of patients off study before progression, the relative mean bias of the KM 12-month and median PFS estimations is slightly higher when the hazard ratio equals 4 compared with 2 for λ1(t) = 0.03 (darker boxes) and λ1(t) = 0.06 (lighter boxes). By comparing the darker (λ1(t) = 0.03) to the lighter (λ1(t) = 0.06) boxes (Fig 2C), a difference in the bias of the 12-month PFS estimates is also observed for the two hazard rates for a fixed hazard ratio. However, this difference is not observed in the median PFS estimates, suggesting that this effect may be a result of the selection of the 12-month time point from the KM curve. These results show that the treatment effect measured in terms of PFS is overestimated in the WM setting if patients who discontinue study treatment before progression as a result of inadequate response or clinical progression are censored in the KM analysis at the time of NPT.
In the MM studies, the magnitude of the bias follows the same pattern, depending primarily on the proportion of patients who undergo transplantation before progression, with a few differences (Fig 3 and Data Supplement). The observed relative mean bias is negative, which is expected because the patients who receive transplantation before progression are assumed to have a lower risk of progression compared with those patients who do not proceed to transplantation. The interpretation is the same, however, with values that are farther away from zero corresponding to higher absolute bias.
Fig 3.

Distribution of relative bias (%) by proportion of patients with multiple myeloma who undergo transplantation before progression (A) and (B) and by ratio between hazard rate of the group of patients who remain on study and the hazard rate of the group of patients who undergo transplantation before progression and by the specific value of the hazard rates themselves (C) and (D), assuming 40% of the patients are informatively censored. Results are shown for 60 patients. (A) and (C) show the impact on the 12-month progression-free survival estimates and (B) and (D) show the impact on the median progression-free survival. The x axis in (A) and (B) is the proportion of patients who undergo transplantation before progression. The x axis in (C) and (D) is the hazard ratio (λ2(t)/λ1(t)). The boxplot provides summary of the quantiles of the relative percent bias. The solid black line in the box represents the median relative percent bias, the bottom of the box is the 25th quantile, the top of the box is the 75th quantile, the line below the box is the 5th quantile, the line above the box is the 95th quantile and the points are outliers.
Figures 3A and 3B show the relative percent bias for a set of simulations with 60 patients with upfront MM therapy: λ1(t) = 0.108 and hazard ratio of 1/2 (ie, the hazard rate of those who proceed to transplantation is 1/2 that of those who remain on study). The negative relative mean bias quickly increases (or equivalently, the relative mean bias decreases) when the proportion of patients who proceed to transplantation increases. For instance, when 20% and 40% of the patients undergo ASCT, the median PFS is underestimated on average by −7.4% and −14.8%, respectively, and the 12-month PFS is underestimated on average by −11.8% and −19.5%, respectively. With regard to the effect of different hazard ratios (Figs 3C and 3D), the negative relative mean bias of the median KM point estimates increases as the hazard ratio decreases for a fixed hazard rate (compare the darker boxes for λ1(t) = 0.036 and compare the lighter boxes for λ1(t) = 0.108). Similar to the WM setting, a difference in the bias of the 12-month PFS estimates is observed for the two hazard rates for a fixed hazard ratio (Fig 3C), although as discussed previously, this may be a result of the selection of the 12-month time point. These results show that the 12-month point estimates and the median are underestimated in a KM analysis that censors those patients who received transplantation before progression.
As expected from statistical theory, there is little variation in the bias as one increases the sample size for fixed hazards and proportions of patients who are informatively censored (Fig 4). An increase in sample size will not remove the bias that is incurred with informative censoring. This is consistent across diseases and all the different scenarios, regardless of the combinations of all the other parameters.
Fig 4.

Distribution of relative bias (%) by sample size for (A) and (B) patients with Waldenström macroglobulinemia and (C) and (D) patients with multiple myeloma. Results are shown for (A) and (B) Waldenström macroglobulinemia with 20% of patients receiving nonprotocol therapy before progression and λ1(t) = 0.06, λ2(t) = 0.24 and for (C) and (D) multiple myeloma with 40% of patients who proceeded to autologous stem-cell transplantation before transplantation and λ1(t) = 0.108, λ2(t) = 0.054. The boxplot provides summary of the quantiles of the relative percent bias. The solid black line in the box represents the median relative percent bias, the bottom of the box is the 25th quantile, the top of the box is the 75th quantile, the line below the box is the 5th quantile, the line above the box is the 95th quantile and the points are outliers.
DISCUSSION
Many researchers commonly use the KM method and may not be fully aware of the impact of censoring for NPT before protocol-defined progression on the estimate of PFS. This study describes situations in which informative censoring may occur in the context of WM and MM clinical trials and reports the magnitude of bias in a KM analysis using parameters that are consistent with the current literature.
The bias in the KM PFS estimates depended mostly on the proportion of patients who were informatively censored and to a lesser extent on the hazard ratio. These results are similar to those reported in the general context of survival analysis.16 The higher magnitude of bias in the WM studies relative to the MM setting is expected because a direct relationship between censoring and failure times is assumed in the simulations to reflect the fact that patients who are censored for inadequate response or clinical progression would have been likely to satisfy the protocol-defined progression soon thereafter. An increase in the sample size will not remove the bias introduced by informative censoring.
Recommendations are based on the reason for the censoring. It is clear from the WM simulations that if there is a direct relationship between the censoring and failure time (ie, patients are likely to experience treatment failure shortly after being censored), patients should not be censored in a KM analysis of PFS. In this setting, we recommend (1) modifying the definition of progression35,36 to include objective definition of new signs and symptoms of progression; (2) adding EFS (or time to treatment failure = 1 − EFS) as an end point, which would be considered as failure, in addition to those who progressed or died, those patients who had inadequate response or had clinical signs and symptoms of disease; and (3) using the competing risks analysis37,38 to present the separate estimation of the two types of failure (documented progression and initiation of NPT) along with the EFS. The initiation of an anticancer therapy before progression reduces the probability of progression, and hence it should be treated as a competing risk event when estimating the cumulative incidence of progression. As illustrated in Figure 5, competing risks methods provide researchers with the tools necessary to estimate time to treatment failure as well as the cumulative incidence of each failure type individually.
Fig 5.
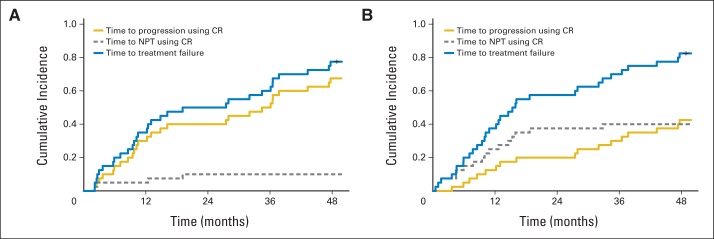
(A) and (B) Estimation of the cumulative incidence probability for time to progression, time to nonprotocol therapy (NPT), and time to treatment failure by using the competing risks (CR) method with (A) 10% and (B) 40% of NPT (n = 40; λ2(t) = 4λ1(t); upfront treatment population [hazard rate per month of progressive disease = 0.03]).
The MM example represents a different issue in studies in which novel treatments are investigated as induction therapy before standard therapy. It is appropriate that patients with MM should have the option to come off study before protocol-defined progression for ASCT after a prespecified number of cycles at the physician's or patient's preference. However, the interpretation of PFS and OS is difficult because the decision on whether patients should undergo transplantation depends on patient's and/or treating physician's preference and thus it could not be objectively determined and controlled in the analyses. Therefore, in single-arm, open-label clinical trials in which the initiation of NPT is unavoidable, we recommend that these studies continue to base treatment evaluations on end points such as response rates and safety profile with relevant laboratory and correlative end points. For time-to-event end points, such as PFS and OS, it is recommended that (1) PFS and OS are not reported or (2) if they are reported, that the patients are all observed until progression, the results are interpreted as induction therapy with or without standard therapy (ie, ASCT in the MM example), and that sensitivity analyses39 are performed to evaluate the range of possible estimates of induction therapy alone. The results presented here do raise practical questions about whether the resources should be allocated to collecting long-term outcomes of PFS and OS in this single-arm phase II setting.
One of the limitations of this study can be attributable to the specificity of its simulations. Simulated data sets were devised to follow predefined sets of hazard risks and scenarios. We selected these parameters from the WM and MM literature and, therefore, these results are specific for these areas. However, it is expected that similar results would be obtained in other diseases with appropriately defined parameters and assuming the same hazard ratio and informative censoring proportions.
Phase II studies are an important step in the evaluation of new therapies. The phase II examples and simulation results presented in this article show that the event of withdrawal from study before protocol-defined progression cannot automatically be regarded as noninformative and that the adequacy of censoring such events in the statistical analysis may therefore be questioned. For this reason, it is recommended that rules for handling censored observations are predefined and justified in the protocol and in the statistical analysis plan. This may include approaches that consider withdrawal or change of therapy before progression as events in an analysis of EFS in which events must be clearly and appropriately defined. In general, the presence of potential biases should always be assessed and, therefore, sensitivity analyses should be contemplated, planned, and implemented as described in the statistical analysis plan.
Supplementary Material
Footnotes
Supported by Grants No. 5P50 CA100707 and 5P01CA078378 from the National Cancer Institute.
Authors' disclosures of potential conflicts of interest and author contributions are found at the end of this article.
AUTHORS' DISCLOSURES OF POTENTIAL CONFLICTS OF INTEREST
The author(s) indicated no potential conflicts of interest.
AUTHOR CONTRIBUTIONS
Manuscript writing: All authors
Final approval of manuscript: All authors
REFERENCES
- 1.Kaplan EL, Meier P. Nonparametric estimation from incomplete observations. J Am Stat Assoc. 1958;53:457–481. [Google Scholar]
- 2.Carroll KJ. Analysis of progression-free survival in oncology trials: Some common statistical issues. Pharm Stat. 2007;6:99–113. doi: 10.1002/pst.251. [DOI] [PubMed] [Google Scholar]
- 3.US Department of Health and Human Services, US Food and Drug Administration, Center for Drug Evaluation and Research. Guidance for Industry: Clinical Trial Endpoints for the Approval of Non-Small Cell Lung Cancer Drugs and Biologics. Draft guidance, June 2011. http://www.fda.gov/downloads/Drugs/GuidanceComplianceRegulatoryInformation/Guidances/UCM259421.pdf.
- 4.US Department of Health and Human Services, US Food and Drug Administration, Center for Drug Evaluation and Research. Guidance for Industry: Clinical Trial Endpoints for the Approval of Cancer Drugs and Biologics. Clinical/medical, May 2007. http://www.fda.gov/downloads/Drugs/GuidanceComplianceRegulatoryInformation/Guidances/UCM071590.pdf.
- 5.Lagakos SW. General right censoring and its impact on the analysis of survival data. Biometrics. 1979;35:139–156. [PubMed] [Google Scholar]
- 6.Klein JP, Moeschberger ML. Bounds on net survival probabilities for dependent competing risks. Biometrics. 1988;44:529–538. [PubMed] [Google Scholar]
- 7.Slud EV, Rubinstein LV. Dependent competing risks and summary survival curves. Biometrika. 1983;70:643–649. [Google Scholar]
- 8.Leung KM, Elashoff RM, Afifi AA. Censoring issues in survival analysis. Annu Rev Public Health. 1997;18:83–104. doi: 10.1146/annurev.publhealth.18.1.83. [DOI] [PubMed] [Google Scholar]
- 9.Yoshida M, Matsuyama Y, Ohashi Y. Estimation of treatment effect adjusting for dependent censoring using the IPCW method: An application to a large primary prevention study for coronary events (MEGA study) Clin Trials. 2007;4:318–328. doi: 10.1177/1740774507081224. [DOI] [PubMed] [Google Scholar]
- 10.Zhang J, Heitjian DF. Nonignorable censoring in randomized clinical trials. Clin Trials. 2005;2:488–496. doi: 10.1191/1740774505cn128oa. [DOI] [PubMed] [Google Scholar]
- 11.Robins JM. Information recovery and bias adjustment in proportional hazards regression analysis of randomized trials using surrogate markers. 1993 Proceedings of the Biopharmaceutical Section, American Statistical Association; 1993; Alexandria, VA. pp. 24–33. [Google Scholar]
- 12.Robins JM. Analytic methods for estimating HIV-treatment and cofactor effects. In: Ostrow DG, Kessler R, editors. Methodological Issues of AIDS Behavioral Research. New York, NY: Plenum Publishing; 1993. pp. 213–287. [Google Scholar]
- 13.Robins JM, Finkelstein DM. Correcting for noncompliance and dependent censoring in an AIDS Clinical Trial with inverse probability of censoring weighted (IPCW) log-rank tests. Biometrics. 2000;56:779–788. doi: 10.1111/j.0006-341x.2000.00779.x. [DOI] [PubMed] [Google Scholar]
- 14.Robins JM, Rotnitzky A. Recovery of information and adjustment for dependent censoring using surrogate markers. In: Jewel NP, Dietz K, Farewell VT, editors. AIDS Epidemiology: Methodological Issues. Boston, MA: Birkhäuser; 1992. pp. 297–331. [Google Scholar]
- 15.Crowder MJ. Classical Competing Risks. Boca Raton, FL: Chapman & Hall/CRC; 2001. [Google Scholar]
- 16.Fisher L, Kanarek P. Presenting censored survival data when censoring and survival times may not be independent. In: Proschan F, Serfling RJ, editors. Reliability and Biometry: Statistical Analysis of Lifelength. Philadelphia, PA: Society for Industrial and Applied Mathematics; 1974. pp. 303–326. [Google Scholar]
- 17.Fleming TR, Rothmann MD, Lu HL. Issues in using progression-free survival when evaluating oncology products. J Clin Oncol. 2009;27:2874–2880. doi: 10.1200/JCO.2008.20.4107. [DOI] [PMC free article] [PubMed] [Google Scholar]
- 18.Rimawi M, Hilsenbeck SG. Making sense of clinical trial data: Is inverse probability of censoring weighted analysis the answer to crossover bias? J Clin Oncol. 2012;30:453–458. doi: 10.1200/JCO.2010.34.2808. [DOI] [PubMed] [Google Scholar]
- 19.Robins JM, Tsiatis AA. Correcting for non-compliance in randomized trials using rank preserving structural failure time models. Commun Stat Theory Meth. 1991;20:2609–2631. [Google Scholar]
- 20.Rourke M, Anderson KC, Ghobrial IM. Review of clinical trials conducted in Waldenstrom macroglobulinemia and recommendations for reporting clinical trial responses in these patients. Leuk Lymphoma. 2010;51:1779–1792. doi: 10.3109/10428194.2010.499977. [DOI] [PubMed] [Google Scholar]
- 21.Ghobrial IM, Roccaro A, Hong F, et al. Clinical and translational studies of a phase II trial of the novel oral Akt inhibitor perifosine in relapsed or relapsed/refractory Waldenstrom's macroglobulinemia. Clin Cancer Res. 2010;16:1033–1041. doi: 10.1158/1078-0432.CCR-09-1837. [DOI] [PMC free article] [PubMed] [Google Scholar]
- 22.Attal M, Harousseau JL, Stoppa AM, et al. A prospective, randomized trial of autologous bone marrow transplantation and chemotherapy in multiple myeloma: Intergroupe Français du Myélome. N Engl J Med. 1996;335:91–97. doi: 10.1056/NEJM199607113350204. [DOI] [PubMed] [Google Scholar]
- 23.Alvares CL, Davies FE, Horton C, et al. Long-term outcomes of previously untreated myeloma patients: Responses to induction chemotherapy and high-dose melphalan incorporated within a risk stratification model can help to direct the use of novel treatments. Br J Haematol. 2005;129:607–614. doi: 10.1111/j.1365-2141.2005.05514.x. [DOI] [PubMed] [Google Scholar]
- 24.Alegre A, Díaz-Mediavilla J, San-Miguel J, et al. Autologous peripheral blood stem cell transplantation for multiple myeloma: A report of 259 cases from the Spanish Registry: Spanish Registry for Transplant in MM (Grupo Español de Trasplante Hematopoyético-GETH) and PETHEMA. Bone Marrow Transplant. 1998;21:133–140. doi: 10.1038/sj.bmt.1701062. [DOI] [PubMed] [Google Scholar]
- 25.Barlogie B, Tricot G, Anaissie E, et al. Thalidomide and hematopoietic-cell transplantation for multiple myeloma. N Engl J Med. 2006;354:1021–1030. doi: 10.1056/NEJMoa053583. [DOI] [PubMed] [Google Scholar]
- 26.Child JA, Morgan GJ, Davies FE, et al. High-dose chemotherapy with hematopoietic stem-cell rescue for multiple myeloma. N Engl J Med. 2003;348:1875–1883. doi: 10.1056/NEJMoa022340. [DOI] [PubMed] [Google Scholar]
- 27.Krejci M, Buchler T, Hajek R, et al. Prognostic factors for survival after autologous transplantation: A single centre experience in 133 multiple myeloma patients. Bone Marrow Transplant. 2005;35:159–164. doi: 10.1038/sj.bmt.1704728. [DOI] [PubMed] [Google Scholar]
- 28.Lahuerta JJ, Martinez-Lopez J, Serna JD, et al. Remission status defined by immunofixation vs. electrophoresis after autologous transplantation has a major impact on the outcome of multiple myeloma patients. Br J Haematol. 2000;109:438–446. doi: 10.1046/j.1365-2141.2000.02012.x. [DOI] [PubMed] [Google Scholar]
- 29.Nadal E, Giné E, Bladé J, et al. High-dose therapy/autologous stem cell transplantation in patients with chemosensitive multiple myeloma: Predictors of complete remission. Bone Marrow Transplant. 2004;33:61–64. doi: 10.1038/sj.bmt.1704313. [DOI] [PubMed] [Google Scholar]
- 30.O'Shea D, Giles C, Terpos E, et al. Predictive factors for survival in myeloma patients who undergo autologous stem cell transplantation: A single-centre experience in 211 patients. Bone Marrow Transplant. 2006;37:731–737. doi: 10.1038/sj.bmt.1705307. [DOI] [PubMed] [Google Scholar]
- 31.Björkstrand B, Goldstone AH, Ljungman P, et al. Prognostic factors in autologous stem cell transplantation for multiple myeloma: An EBMT Registry Study—European Group for Bone Marrow Transplantation. Leuk Lymphoma. 1994;15:265–272. doi: 10.3109/10428199409049723. [DOI] [PubMed] [Google Scholar]
- 32.Lahuerta JJ, Mateos MV, Martínez-López J, et al. Influence of pre- and post-transplantation responses on outcome of patients with multiple myeloma: Sequential improvement of response and achievement of complete response are associated with longer survival. J Clin Oncol. 2008;26:5775–5782. doi: 10.1200/JCO.2008.17.9721. [DOI] [PubMed] [Google Scholar]
- 33.Richardson PG, Weller E, Lonial S, et al. Lenalidomide, bortezomib, and dexamethasone combination therapy in patients with newly diagnosed multiple myeloma. Blood. 2010;116:679–686. doi: 10.1182/blood-2010-02-268862. [DOI] [PMC free article] [PubMed] [Google Scholar]
- 34.Altman DG, Bland JM. Standard deviations and standard errors. BMJ. 2005;331:903. doi: 10.1136/bmj.331.7521.903. [DOI] [PMC free article] [PubMed] [Google Scholar]
- 35.Kimby E, Treon SP, Anagnostopoulos A, et al. Update on recommendations for assessing response from the Third International Workshop on Waldenstrom's Macroglobulinemia. Clin Lymphoma Myeloma. 2006;6:380–383. doi: 10.3816/CLM.2006.n.013. [DOI] [PubMed] [Google Scholar]
- 36.Owen RG, Kyle RA, Stone MJ, et al. Response assessment in Waldenström macroglobulinaemia: Update from the VIth International Workshop. Br J Haematol. 2013;160:171–176. doi: 10.1111/bjh.12102. [DOI] [PubMed] [Google Scholar]
- 37.Gray RJ. A class of K-sample tests for comparing the cumulative incidence of a competing risk. Ann Stat. 1988;16:1141–1154. [Google Scholar]
- 38.Campigotto F, Neuberg D, Zwicker JI. Biased estimation of thrombosis rates in cancer studies using the method of Kaplan and Meier. J Thromb Haemost. 2012;10:1449–1451. doi: 10.1111/j.1538-7836.2012.04766.x. [DOI] [PMC free article] [PubMed] [Google Scholar]
- 39.Collett D. Modelling Survival Data in Medical Research. Boca Raton, FL: CRC Press; 2003. [Google Scholar]
Associated Data
This section collects any data citations, data availability statements, or supplementary materials included in this article.