

Abstract
Previous studies have shown a selective reduction of von Economo neurons (VENs) in behavioral variant frontotemporal dementia (bvFTD). However, the alleged selectivity rests on the comparison between VENs and other neurons in cortical layer V, while it has been established that neurons in the superficial cortical layers (I-III) are particularly affected in bvFTD. The purpose of this study was to examine loss the loss of VENs in comparison with that of non-VEN-neurons of superficial cortical layers. VENs and non-VEN-neurons of cortical layer V and layers II+III were quantified in the anterior cingulate cortex in 16 cases of bvFTD, 12 non-demented controls and 10 cases of Alzheimer’s disease (AD). In bvFTD VENs were more depleted than non-VEN-neurons of layers V and II+III. Also, non-VEN-neurons of layer II+III showed a greater density reduction than those of layer V in bvFTD. VEN density was also reduced in AD, albeit to a lesser extent than in bvFTD, and the differences between bvFTD and AD were only significant when relating VEN loss to that of layer V neurons. Our study strengthens the view of VENs as a particularly sensitive neuronal type of bvFTD, and appears to be on a continuum with the loss of other neurons both in bvFTD and between conditions.
Keywords: Frontotemporal dementia, frontotemporal lobar degeneration, von Economo neurons, anterior cingulate cortex
Introduction
Behavioral variant frontotemporal dementia (bvFTD) is a neurodegenerative condition characterized clinically by progressive disturbance of behaviour, emotion and language [1]. The cortical atrophy in early bvFTD involves the anterior cingulate (ACC) and frontoinsular (FI) cortex [2]. This pattern corresponds to the cortical regions harboring von Economo neurons (VENs), the large bipolar projection neurons that are almost exclusively found in layer V of the ACC and FI [3] (for two recent reviews see [4,5]). VENs have been shown to be selectively affected in early bvFTD [6-9]. This finding may explain the anatomical distribution of cortical atrophy in bvFTD, if VENs are the cellular starting point of the neurodegenerative process [10]. Alternatively, they could be a component of the cellular loss with important functional consequences. While the function of VENs has not been unraveled, their distribution, receptor expression, ontogenetic and evolutionary development is indicative of higher emotional cognitive integration [3-5,11]. Their location overlaps with that of the salience network [12,13], a functional MRI resting state network that has been shown to be disturbed in bvFTD [14,15].
In studies showing loss of VENs in bvFTD, VEN numbers have been compared to numbers of neighboring neurons in layer V [6-8] or across all cortical layers [9], indicating the VENs to be selectively affected in the frontotemporal lobar degeneration (FTLD) disease process (FTLD is the term used for the neuropathological processes underlying the clinical syndrome- bvFTD). However, from the early descriptions of FTLD [16,17] and more recent quantifications [18,19] it is clear that deeper cortical layers (V, VI) are generally less affected by neuronal degeneration, gliosis and atrophy in FTLD, compared with the superficial, supragranular layers (I-III). Thus the alleged selectivity of the loss of VENs has to be assessed with a parallel evaluation of the loss of supragranular neurons. The purpose of the current study was thus to examine loss of VENs in relation to loss of neurons in superficial cortical layers in bvFTD, compared with Alzheimer’s disease (AD) and non-demented controls (NDC).
Material and methods
Selection of cases
Archival histopathological brain sections from neuropathologically diagnosed FTLD in clinically diagnosed bvFTD cases (n=16) were selected from the Department of Neuropathology in Lund, with the primary morphologic evaluations being made during 1994-2012. The post-mortem diagnosis of FTLD, including protein pathology FTLD subtype assessment (Tau, TAR DNA binding protein 43-[TDP-43] or Fused in Sarcoma- [FUS]), was established at the routine neuropathological examination, according to standard procedures within the department [20] applying established international criteria for the micromorphology [21,22]. For the protein pathology subtype assessment, the following antibodies were used: AT-8 for tau (DAKO, Copenhagen), pTDP-43 (Cosmo Bio Ltd., Tokyo) and FUS (Sigma-Aldrich LLS, St Louis, MO). Neuropathological exclusion criteria were significant concomitant AD pathology, defined as Braak stage >III [23], or significant cerebrovascular pathology (defined as any vascular-ischemic burden other than solitary microinfarcts). Gross severity of atrophy was assessed using a rating scale developed for FTD [24], grading defined regional atrophy as stages 1 to 4 on two coronal whole brain slices. For the present study, only cases with stages 1 or 2 were selected, as this was considered pertinent to assessing the issue of VEN selectivity in early cases.
Clinical charts were reviewed, and only patients with bvFTD as a first clinical syndrome according to Neary criteria [25] were accepted. Indi-viduals exhibiting concomitant ALS were included, but not those progressing into syndromes such as progressive supranuclear paralysis, corticobasal degeneration, or other parkinsonian disorder. The patients had previously been followed in a memory or neurological clinic, and the clinical investigation included structural neuroimaging, cerebral blood flow examination and neuropsychological examination in most cases. It was not possible to retrospectively determine the severity of dementia at death from the clinical records, but symptom duration in years was extracted. Non-demented controls (NDC, n=12) and AD patients (n=10) were selected in order to match bvFTD cases with respect to age and sex. NDC were required to neither to have a history of dementia nor to reveal any neuropathological signs of dementing disorder. Neuropathological diagnosis was cerebral ischemia (n=5), tumor (n=4), neurodegenerative disease without cognitive deficits (n=2, Multiple System Atrophy, Cerebellar Ataxia), or no pathological findings (n=1). AD cases had a neuropathological diagnosis of AD according to established criteria [20,23]. Quantitative levels of VENs have been previously reported for 13 of the bvFTD cases, 10 of the controls and all of the 10 AD patients [8]. The study was approved by the Regional Ethical Review Board in Lund, Sweden (number 2010/229).
Region sampling and area delineation
The methodology described was also previously used for quantifying VENs [8]. The area of interest (the right dorsal ACC) was identified on whole brain coronal sections, sampled at a level immediately posterior to the anterior tip of the genu of the corpus callosum (Figure 1A and 1B). The right hemisphere was chosen throughout since VEN density shows some lateralization right over left [26]. The slices, 6 µm thick, one for each case, were stained with a double staining for cell nuclei (Cresyl Violet/Nissl) and myelin (Luxol Fast Blue). The entire area of interest was scanned on a motorized light microscope at X200 enlargement (Olympus BX53; Olympus Europe Group, Hamburg, Germany). On the digitalized images a subdivision of the ACC into subarea BA24a, 24b and 24c was made, according to descriptions [27,28] (Figure 1C). BA24b was chosen as the subarea of interest, since this area has the highest VEN density [3]. The cortical layers of interest (II+III and V) were manually outlined on the digitalized images. For layer V (including Va and Vb) the superficial definition was just over the inner pyramidal layer and the basal delineation above the emergence of layer VI. For layers II and III, the basal delineation was the same as the superficial surface of layer V (the ACC being agranular and thus lacking a layer IV), while the outer definition was the border between layer I and II (Figure 1C). Cortical segments that showed irregularities in structure or were damaged, preventing layer delineation, were omitted. Mean thickness of layers was calculated by dividing their area by the mean of upper and lower horizontal delineation.
Figure 1.
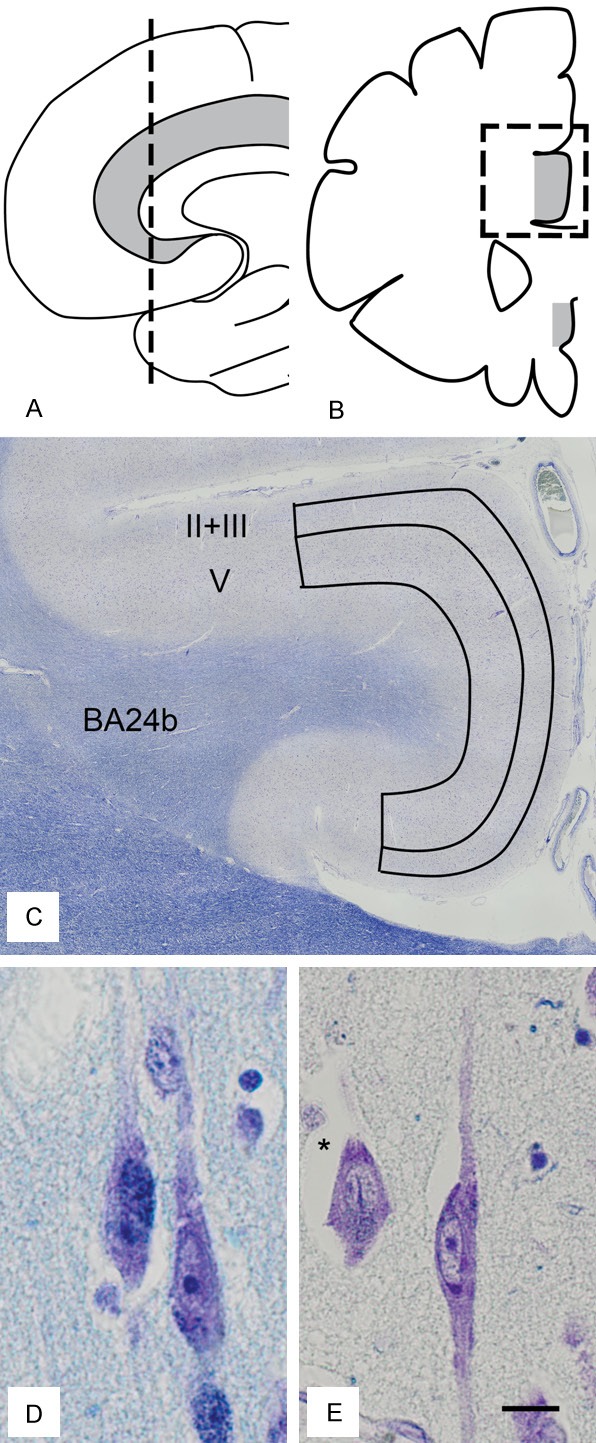
Schematic illustration of sampling scheme in sagittal (A) and coronal (B) view. The anterior cingulate cortex is in grey. (C) Outline of region of interest (BA24b) with delineation of cortical layers (II+III and V) in the dorsal anterior cingulate cortex. (D, E) von Economo neurons, x 400 magnification, with a pyramidal neuron (*). (C-E) are stained with Cresyl Violet and Luxol Fast Blue. (C) is adapted from [8], with permission. Scale bar in (D, E) 10 µm.
Cell quantification
The areas of interest (layer II+III and layer V of the dorsal ACC, subregion 24b) were systematically scanned through on the digitalized images, twice, and VENs and non-VEN neurons (NVNs) were counted. The criteria for VENs were based on standard criteria [3]: a size equal to or above pyramidal neurones, a long elongated soma with one basal and one apical process of similar thickness, emerging at approximately 180 degrees from each other, with the cell and it’s processes aligned in the main cellular direction (Figure 1D, 1E). VENs were counted if more than 50% of the cell was inside the delineated area. Criteria for NVNs were a non-VEN appearance, an intact nucleus with one single defined nucleolus, a clearly visible soma, and not exhibiting typical glial appearance. Only cells entirely inside the delineated area were counted. All counting was done blinded for diagnosis. Reliability for this cell counting procedure has been established in our previous study [8]. The intraclass correlation coefficient (ICC) for VEN counting was 0.96 (0.86-0.99, p<0.001) for intrarater and 0.97 (0.66-0.99, p<0.001) for interrater comparisons. For NVNs counting, the intrarater reliability was 0.98 (0.91-0.99, p<0.001), the interrater reliability being 0.89 (0.72-0.98, p<0.001). The primary approach to quantify VEN loss, as used previously [6-8], was to normalize the number of VENs to the number of NVNs of the same area of interest. In our case VENs were normalized to 10000 NVNs of layer V and layer II+III, respectively, of the same cortical section. This provides a relative measure of VEN loss compared to loss of NVNs, allows for comparisons across conditions (bvFTD, AD), and partially compensates for neurodegenerative non-neuronal tissue loss and effects of shrinkage. In order to compare densities of NVNs of the cortical layers and densities of VENs, we calculated NVN and VEN density, which was corrected with the mean thickness of each cortical layer, an approach used for cases where shrinkage could be differentially affected across cytoarchitectural layers [29]. Cellular densities were then expressed as percentage of control densities, in order to compare NVNs and VEN densities between layers.
Statistical analysis
Differences in age, symptom duration, and sex distribution between groups were compared with the Kruskal-Wallis and Mann-Whitney test for age and symptom duration and the Fisher’s exact test for sex distribution, with significance set to p<0.05. Shapiro-Wilk tests were run on all data in order to assess normal distribution. When occasionally this requirement was not met, the parametric test was only used if the non-parametric equivalent showed the same result regarding statistical significance. Number of VEN/10000 NVN was compared between groups using a one-way ANOVA, with Tukey’s HSD as post-hoc test, significance set to p<0.05. Thickness-corrected cellular densities, expressed as percentage of control mean, were compared with either paired t-test (within the respective diagnostic category) or independent t-test (between diagnostic categories), significance set to p<0.05. For all correlations a two-tailed Pearson’s test of correlation was employed.
Results
Demographical data of patients and controls are presented in Table 1. There were no statistically significant differences in age or sex distribution between patients and controls. Median duration of symptoms was longer in AD (median 8 years) than in FTD (median 5 years), with a borderline statistical difference (p=0.050). Regarding macroscopic brain atrophy among the FTD cases, 6 patients were at stage 1 and 10 at stage 2. Eleven cases were TDP-43 positive, three were tau positive, one was FUS positive, and one case was negative for all three antibody stainings. In the AD cases, neuropathological severity was reflected in Braak stage III (2/10), IV (3/10), V (2/10) and VI (3/10).
Table 1.
Demographic and clinical data of subjects. Values are the median with range
| n | M/F | age | duration | |
|---|---|---|---|---|
| bvFTD | 16 | 6/10 | 68.5 (34-82) | 5 (1-11) |
| AD | 10 | 6/4 | 67.5 (57-76) | 8 (3-14) |
| NDC | 12 | 5/7 | 63.5 (54-82) | na |
In the NDC group, mean VEN/10000 NVNII+III was 326 (± SD 180), while the bvFTD group showed a 46% reduction, with VEN/10000 NVNII+III of 177 (± SD 124) and AD patients a 21% reduction with mean VEN/10000 NVNII+III of 257 (± SD 139) (Figure 2A). Significant differences between diagnosis groups in VEN/10000 NVNII+III were identified (F=3.538, p=0.040), with the difference between bvFTD and NDC being statistically significant (p=0.032, 95% CI of reduction 88-3,4%), but not that between bvFTD and AD (p=0.379) nor between AD and NDC (p=0.527). The thickness-corrected densities showed an expected pattern in bvFTD with NVN densities of layer V being almost identical to controls (a slight increase with mean percentage of controls 106.2%, ± SD 34), lower densities in layer II and III (mean percentage of controls 86.8%, ± SD 28.5), while VEN densities showed a more marked reduction with densities at 52% of controls (± SD 38.9) (Figure 2B). VEN densities were statistically different from both NVNV (p<0.001, 95% CI -71, -38%) and NVNII+III densities (p=0.003, 95% CI -56, -14%,) in bvFTD. Differences between densities of layer II+III and V were borderline statistically significant in bvFTD (p=0.061). A similar, but smaller scale pattern emerged in AD, with NVNV densities being 77.4% (± SD 25) of controls, NVNII+III 75.4% (± SD 19.1), and VENs 63.9% (± SD 36) (Figure 2B). None of the neuronal densities in AD were significantly different from each other. Comparing densities between bvFTD and AD these were significant for NVNV (p=0.030) but not for NVNII+III (p=0.279) or VENs (p=0.442).
Figure 2.
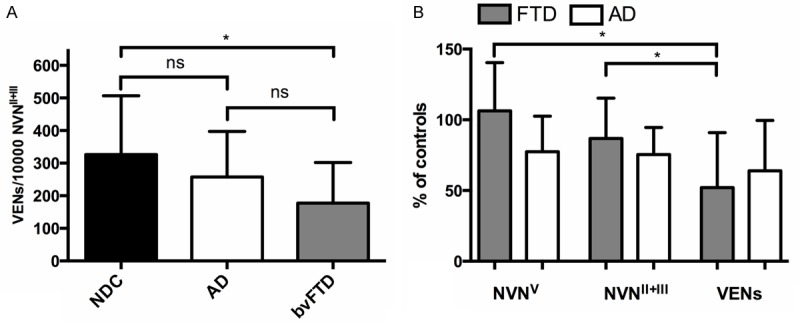
A. Comparison between von Economo neurons (VENs) per 10.000 non- VEN-neurons (NVN) in cortical layers II and III, in non-demented controls (NDC), cases with Alzheimer’s disease (AD), and behavioral variant frontotemporal dementia (bvFTD). B. Densities NVN of layer V (NVNV), of layer II and III (NVNII+III), and of VENs, expressed as percentage of controls, in cases with FTD and AD. Bars represent mean and error bars one standard deviation. *=significant at p<0.05, ns=not significant.
The mean number of VENs/10000 NVNV was 457 (± SD 166) in NDC, 198 (± SD 113) in patients with bvFTD and 338 (± SD 129) in patients with AD. Differences across diagnosis group were significant (F=12.6, p<0.001). bvFTD showed a significant reduction compared with NDC (57%, p<0.001, 95% CI of reduction 85-29%), and compared with AD (42% reduction, p=0.038, 95% CI of reduction 81% to 2.0%). The difference between AD and NDC was not significant (26% reduction, p=0.120).
Discussion
Our data show that VENs are more selectively degenerated than neurons not only of deep but also of superficial layers in bvFTD. This strengthens the hypothesis of VENs as a particularly affected neuronal type in frontotemporal dementia. In previous studies, VEN loss has been evaluated in relation to neuronal loss within layer V, where VENs are found [6-8], or within all cortical layers [9]. As expected, loss of VENs relative to supragranular layers was less than the loss of VENs relative to layer V neurons, since supragranular layers were more affected than deeper layers. This more pronounced loss of neurons in layer II+III vs. layer V in our study is in accordance with previous studies which all have resulted in a similar pattern, although the numbers differ widely. This is most probably this is because of variability in cases, difference in neuropathological severity, and the different methods of quantification. Seeley and coworkers found, as in the study by Tan [9], a slight increase [6] in neuron density in layer V of the ACC when using stereological methods, similar to the findings of the present study. In contrast, other studies [30] reported density reductions of 35-45% in layer III and V, or even more [18].
Region of interest delineation and choice of target is an issue to bear in mind in the interpretation of the results. We chose not to separately delineate layers II and III, but instead merging these cell populations, since the layer II is underdeveloped in the ACC and the distinction between layer II and III is difficult [28], particularly in diseased cases. Thus our layer II+III mainly consists of layer III neurones: and it is possible that more detailed delineations of layers, or subareas of layers, would show greater non-VEN neuronal loss. We omitted layer I, where neuronal density is very low. Layer I is heavily affected in FTD, possibly even more than layer II and III [17].
In this study we identified a selective loss of VENs also in AD, however less pronounced than in FTD and statistically non-significant. Similar loss of VENs in AD has been shown previously, in the study by Kim and co-workers [6] (statistically nonsignificant), and in the study by Nimchinsky and colleagues [3] (statistically significant). Comparing the analysis of densities and VENs normalized to NVNs, it is apparent that “absolute” densities of VENs do not differ significantly between bvFTD and AD, while the values for VENs/10000 NVN do. In our cohort, we chose the AD patients to match bvFTD cases with regard to age and gender, but we did not have the possibility to match for disease duration, severity of disease at time of death, or neuropathological severity. Since our AD group had a longer disease duration than FTD patients, and VEN density had a negative correlation with duration in AD (r=-0.30, ns), different duration and/or severity could be a factor to consider in these comparisons. In summary, however, it appears than VEN loss is not an “all or nothing” phenomenon, but instead is part of a continuum of degeneration in and in between conditions.
What could be the reason for VEN selectivity? The possibilities are both structural, biochemical, due to local connectivity within or regional connectivity outside the cortex. From a structural point of view, the morphology of VENs (large, implying large axons, possibly rapid firing) suggest increased metabolic requirements and elevated structural requirements that could make these cells sensitive to a vast number of pathological processes [3,11]. As a consequence, it is anticipated that AD cases show intermediary VEN selectivity, as the tau-positive FTD cases in our previous study. Still the heightened loss in FTLD, and the genetic, biochemical and pathological relationship with ALS, another TPD-43 disease which initially targets large neurofilament rich neurons such as Betz cells and α-motoneurons [31], suggest that this could indeed be a phenomenon that is more specifically linked to FTLD protein pathology, such as TDP-43. The recent finding of selectively reduced densities of VENs in semantic dementia (another TDP-43 condition) [9], may support his notion.
Another possible explanation of selective VEN loss, together with layer II and III selectivity could be the local intracortical connectivity. VENs have a considerably smaller dendritic tree than other layer V pyramidal neurons [32], and their sparse apical sampling could make them particularly vulnerable for synaptodendritic pathology, which is more evident in the upper layers in FTD [17]. Atrophy in the structures to which VENs connect could also be another explanation for VEN selectivity. Whereas exact VEN connectivity is not known, they are most probably projection neurons [3], with long destination axons, projecting subcortically [33], with a minor callosal portion [34]. This would suggest a subcortical target that is early involved in FTD, such as the amygdala [35], or possibly the subcortical anchor points of the salience network, the periaqueductal grey and the parabrachial nucleus [14].
Several possible sources of bias in the current study should be mentioned. One is the possible counting of astrocytes as NVN neurons, thus underestimating the neuronal loss. In Nissl staining, separating astrocytes from neurones is generally regarded as straight-forward, but classification could be more difficult with activated astrocytes. Since astrocytosis, like cell loss, is more common in the superficial layers in FTLD [16,18,19], this would affect NVNII+III more than NVNV. As some of the neuropathological characteristics of FTLD can be appreciated in Nissl staining, and as the whole gyrus was visible for the rater, loss of blinding could have been a source of bias in our study. Generally, stereological methods are regarded as more accurate in the quantification of cells densities. Regarding VENs, our method could increase the likelihood of counting other cell types (elongated or inverted pyramidal neurons, basket cells) as VENs. However, since non-VEN neurons are less affected than VENs, this should rather diminish differences between conditions.
In conclusion, our study strengthens the notion of VENs being a particularly sensitive cell population in bvFTD. Further studies should aim to explore whether VENs are particularly sensitive for the biochemical processes in FTLD, and make a more detailed comparison between loss of VENs and more defined cortical layers, e.g. separating I, II and III. VEN loss in other neurodegenerative disorders other than bvFTD, AD and SD remains to be explored. Clearly, an important step in understanding VEN function is their connectivity. Since VENs have been recently described in primate laboratory animals [34], tracing studies are now possible.
Acknowledgements
Histotechnical work: Anna Härfstrand, Camilla Lidman, Sanaz Mojighashghaei. Funding: Government funding of clinical research within NHS Sweden (ALF), The Swedish Dementia Foundation, The Trolle-Wachtmeister Foundation.
Disclosure of conflict of interest
None to declare.
References
- 1.Piguet O, Hornberger M, Mioshi E, Hodges JR. Behavioural-variant frontotemporal dementia: diagnosis, clinical staging, and management. Lancet Neurol. 2011;10:162–172. doi: 10.1016/S1474-4422(10)70299-4. [DOI] [PubMed] [Google Scholar]
- 2.Seeley WW, Crawford R, Rascovsky K, Kramer JH, Weiner M, Miller BL, Gorno-Tempini ML. Frontal paralimbic network atrophy in very mild behavioral variant frontotemporal dementia. Arch Neurol. 2008;65:249–255. doi: 10.1001/archneurol.2007.38. [DOI] [PMC free article] [PubMed] [Google Scholar]
- 3.Nimchinsky EA, Vogt BA, Morrison JH, Hof PR. Spindle neurons of the human anterior cingulate cortex. J Comp Neurol. 1995;355:27–37. doi: 10.1002/cne.903550106. [DOI] [PubMed] [Google Scholar]
- 4.Cauda F, Geminiani GC, Vercelli A. Evolutionary appearance of von Economo’s neurons in the mammalian cerebral cortex. Front Hum Neurosci. 2014;8:104. doi: 10.3389/fnhum.2014.00104. [DOI] [PMC free article] [PubMed] [Google Scholar]
- 5.Butti C, Santos M, Uppal N, Hof PR. Von Economo neurons: clinical and evolutionary perspectives. Cortex. 2013;49:312–326. doi: 10.1016/j.cortex.2011.10.004. [DOI] [PubMed] [Google Scholar]
- 6.Kim EJ, Sidhu M, Gaus SE, Huang EJ, Hof PR, Miller BL, DeArmond SJ, Seeley WW. Selective frontoinsular von Economo neuron and fork cell loss in early behavioral variant frontotemporal dementia. Cereb Cortex. 2012;22:251–259. doi: 10.1093/cercor/bhr004. [DOI] [PMC free article] [PubMed] [Google Scholar]
- 7.Seeley WW, Carlin DA, Allman JM, Macedo MN, Bush C, Miller BL, Dearmond SJ. Early frontotemporal dementia targets neurons unique to apes and humans. Ann Neurol. 2006;60:660–667. doi: 10.1002/ana.21055. [DOI] [PubMed] [Google Scholar]
- 8.Santillo AF, Nilsson C, Englund E. von Economo neurones are selectively targeted in frontotemporal dementia. Neuropathol Appl Neurobiol. 2013;39:572–579. doi: 10.1111/nan.12021. [DOI] [PMC free article] [PubMed] [Google Scholar]
- 9.Tan RH, Wong S, Kril JJ, Piguet O, Hornberger M, Hodges JR, Halliday GM. Beyond the temporal pole: limbic memory circuit in the semantic variant of primary progressive aphasia. Brain. 2014;137:2065–2076. doi: 10.1093/brain/awu118. [DOI] [PubMed] [Google Scholar]
- 10.Seeley WW. Selective functional, regional, and neuronal vulnerability in frontotemporal dementia. Curr Opin Neurol. 2008;21:701–707. doi: 10.1097/WCO.0b013e3283168e2d. [DOI] [PMC free article] [PubMed] [Google Scholar]
- 11.Allman JM, Watson KK, Tetreault NA, Hakeem AY. Intuition and autism: a possible role for Von Economo neurons. Trends Cogn Sci. 2005;9:367–373. doi: 10.1016/j.tics.2005.06.008. [DOI] [PubMed] [Google Scholar]
- 12.Seeley WW, Menon V, Schatzberg AF, Keller J, Glover GH, Kenna H, Reiss AL, Greicius MD. Dissociable intrinsic connectivity networks for salience processing and executive control. J Neurosci. 2007;27:2349–2356. doi: 10.1523/JNEUROSCI.5587-06.2007. [DOI] [PMC free article] [PubMed] [Google Scholar]
- 13.Cauda F, Torta DM, Sacco K, D’Agata F, Geda E, Duca S, Geminiani G, Vercelli A. Functional anatomy of cortical areas characterized by Von Economo neurons. Brain Struct Funct. 2012;218:1–20. doi: 10.1007/s00429-012-0382-9. [DOI] [PubMed] [Google Scholar]
- 14.Zhou J, Greicius MD, Gennatas ED, Growdon ME, Jang JY, Rabinovici GD, Kramer JH, Weiner M, Miller BL, Seeley WW. Divergent network connectivity changes in behavioural variant frontotemporal dementia and Alzheimer’s disease. Brain. 2010;133:1352–1367. doi: 10.1093/brain/awq075. [DOI] [PMC free article] [PubMed] [Google Scholar]
- 15.Dopper EG, Rombouts SA, Jiskoot LC, Heijer T, de Graaf JR, Koning I, Hammerschlag AR, Seelaar H, Seeley WW, Veer IM, van Buchem MA, Rizzu P, van Swieten JC. Structural and functional brain connectivity in presymptomatic familial frontotemporal dementia. Neurology. 2013;80:814–823. doi: 10.1212/WNL.0b013e31828407bc. [DOI] [PMC free article] [PubMed] [Google Scholar]
- 16.Brun A. Frontal lobe degeneration of non-Alzheimer type. I. Neuropathology. Arch Gerontol Geriatr. 1987;6:193–208. doi: 10.1016/0167-4943(87)90021-5. [DOI] [PubMed] [Google Scholar]
- 17.Liu X, Erikson C, Brun A. Cortical synaptic changes and gliosis in normal aging, Alzheimer’s disease and frontal lobe degeneration. Dementia. 1996;7:128–134. doi: 10.1159/000106867. [DOI] [PubMed] [Google Scholar]
- 18.Kersaitis C, Halliday GM, Kril JJ. Regional and cellular pathology in frontotemporal dementia: relationship to stage of disease in cases with and without Pick bodies. Acta Neuropathol. 2004;108:515–523. doi: 10.1007/s00401-004-0917-0. [DOI] [PubMed] [Google Scholar]
- 19.Kersaitis C, Halliday GM, Xuereb JH, Pamphlett R, Bak TH, Hodges JR, Kril JJ. Ubiquitin-positive inclusions and progression of pathology in frontotemporal dementia and motor neurone disease identifies a group with mainly early pathology. Neuropathol Appl Neurobiol. 2006;32:83–91. doi: 10.1111/j.1365-2990.2005.00704.x. [DOI] [PubMed] [Google Scholar]
- 20.Brunnstrom H, Englund E. Comparison of four neuropathological scales for Alzheimer’s disease. Clin Neuropathol. 2011;30:56–69. doi: 10.5414/npp30056. [DOI] [PubMed] [Google Scholar]
- 21.Cairns NJ, Bigio EH, Mackenzie IR, Neumann M, Lee VM, Hatanpaa KJ, White CL 3rd, Schneider JA, Grinberg LT, Halliday G, Duyckaerts C, Lowe JS, Holm IE, Tolnay M, Okamoto K, Yokoo H, Murayama S, Woulfe J, Munoz DG, Dickson DW, Ince PG, Trojanowski JQ, Mann DM. Neuropathologic diagnostic and nosologic criteria for frontotemporal lobar degeneration: consensus of the Consortium for Frontotemporal Lobar Degeneration. Acta Neuropathol. 2007;114:5–22. doi: 10.1007/s00401-007-0237-2. [DOI] [PMC free article] [PubMed] [Google Scholar]
- 22.Mackenzie IR, Neumann M, Bigio EH, Cairns NJ, Alafuzoff I, Kril J, Kovacs GG, Ghetti B, Halliday G, Holm IE, Ince PG, Kamphorst W, Revesz T, Rozemuller AJ, Kumar-Singh S, Akiyama H, Baborie A, Spina S, Dickson DW, Trojanowski JQ, Mann DM. Nomenclature and nosology for neuropathologic subtypes of frontotemporal lobar degeneration: an update. Acta Neuropathol. 2010;119:1–4. doi: 10.1007/s00401-009-0612-2. [DOI] [PMC free article] [PubMed] [Google Scholar]
- 23.Braak H, Alafuzoff I, Arzberger T, Kretzschmar H, Del Tredici K. Staging of Alzheimer disease-associated neurofibrillary pathology using paraffin sections and immunocytochemistry. Acta Neuropathol. 2006;112:389–404. doi: 10.1007/s00401-006-0127-z. [DOI] [PMC free article] [PubMed] [Google Scholar]
- 24.Broe M, Hodges JR, Schofield E, Shepherd CE, Kril JJ, Halliday GM. Staging disease severity in pathologically confirmed cases of frontotemporal dementia. Neurology. 2003;60:1005–1011. doi: 10.1212/01.wnl.0000052685.09194.39. [DOI] [PubMed] [Google Scholar]
- 25.Neary D, Snowden JS, Gustafson L, Passant U, Stuss D, Black S, Freedman M, Kertesz A, Robert PH, Albert M, Boone K, Miller BL, Cummings J, Benson DF. Frontotemporal lobar degeneration: a consensus on clinical diagnostic criteria. Neurology. 1998;51:1546–1554. doi: 10.1212/wnl.51.6.1546. [DOI] [PubMed] [Google Scholar]
- 26.Allman JM, Tetreault NA, Hakeem AY, Manaye KF, Semendeferi K, Erwin JM, Park S, Goubert V, Hof PR. The von Economo neurons in frontoinsular and anterior cingulate cortex in great apes and humans. Brain Struct Funct. 2010;214:495–517. doi: 10.1007/s00429-010-0254-0. [DOI] [PubMed] [Google Scholar]
- 27.Vogt BA, Nimchinsky EA, Vogt LJ, Hof PR. Human cingulate cortex: surface features, flat maps, and cytoarchitecture. J Comp Neurol. 1995;359:490–506. doi: 10.1002/cne.903590310. [DOI] [PubMed] [Google Scholar]
- 28.Palomero-Gallagher N, Mohlberg H, Zilles K, Vogt B. Cytology and receptor architecture of human anterior cingulate cortex. J Comp Neurol. 2008;508:906–926. doi: 10.1002/cne.21684. [DOI] [PMC free article] [PubMed] [Google Scholar]
- 29.Oorschot DE. Are you using neuronal densities, synaptic densities or neurochemical densities as your definitive data? There is a better way to go. Prog Neurobiol. 1994;44:233–247. doi: 10.1016/0301-0082(94)90040-x. [DOI] [PubMed] [Google Scholar]
- 30.Schofield E, Kersaitis C, Shepherd CE, Kril JJ, Halliday GM. Severity of gliosis in Pick’s disease and frontotemporal lobar degeneration: tau-positive glia differentiate these disorders. Brain. 2003;126:827–840. doi: 10.1093/brain/awg085. [DOI] [PubMed] [Google Scholar]
- 31.Brettschneider J, Del Tredici K, Toledo JB, Robinson JL, Irwin DJ, Grossman M, Suh E, Van Deerlin VM, Wood EM, Baek Y, Kwong L, Lee EB, Elman L, McCluskey L, Fang L, Feldengut S, Ludolph AC, Lee VM, Braak H, Trojanowski JQ. Stages of pTDP-43 pathology in amyotrophic lateral sclerosis. Ann Neurol. 2013;74:20–38. doi: 10.1002/ana.23937. [DOI] [PMC free article] [PubMed] [Google Scholar]
- 32.Watson KK, Jones TK, Allman JM. Dendritic architecture of the von Economo neurons. Neuroscience. 2006;141:1107–1112. doi: 10.1016/j.neuroscience.2006.04.084. [DOI] [PubMed] [Google Scholar]
- 33.Cobos I, Seeley WW. Human von Economo Neurons Express Transcription Factors Associated with Layer V Subcerebral Projection Neurons. Cereb Cortex. 2013 doi: 10.1093/cercor/bht219. [Epub ahead of print] [DOI] [PMC free article] [PubMed] [Google Scholar]
- 34.Evrard HC, Forro T, Logothetis NK. Von Economo neurons in the anterior insula of the macaque monkey. Neuron. 2012;74:482–489. doi: 10.1016/j.neuron.2012.03.003. [DOI] [PubMed] [Google Scholar]
- 35.Brettschneider J, Del Tredici K, Irwin DJ, Grossman M, Robinson JL, Toledo JB, Fang L, Van Deerlin VM, Ludolph AC, Lee VM, Braak H, Trojanowski JQ. Sequential distribution of pTDP-43 pathology in behavioral variant frontotemporal dementia (bvFTD) Acta Neuropathol. 2014;127:423–439. doi: 10.1007/s00401-013-1238-y. [DOI] [PMC free article] [PubMed] [Google Scholar]