Abstract
Functional magnetic resonance imaging (fMRI) of brain function is used in neurorehabilitation to gain insight into the mechanisms of neural recovery following neurological injuries such as stroke. The behavioral paradigms involving the use of force motor tasks utilized in the scanner often lack the ability to control details of motor performance. They are often limited by subjectiveness, lack of repeatability, and complexity that may exclude evaluation of patients with poor function. In this paper we describe a novel MR compatible wrist device that is capable of measuring isometric forces generated at the hand and joint moments along wrist flexion–extension and wrist ulnar–radial deviation axes. Joint moments measured by the system can be visually displayed to the individual and used during target matching block or event related paradigms. Through a small set of pilot testing both inside and outside the MR environment, we have found that the force tracking tasks and performance in the scanner are reproducible, and that high quality force and moment recordings can be made during fMRI studies without compromising the fMRI images. Furthermore, the device recordings are extremely sensitive making it possible for individuals with poor hand and wrist function to be tested.
Keywords: Functional magnetic resonance imaging, fMRI, Stroke, Brain function, Neural plasticity
1. Introduction
In recent years, the use of functional magnetic resonance imaging (fMRI) to explore brain plasticity following neurological injury has continued to rise (see Calautti and Baron, 2003, for review). The main advantage of fMRI is that high spatial resolution images of neural activity can be obtained in a non-invasive manner, making it possible to study cortical reorganization throughout the recovery process of patients with stroke, traumatic brain injury, and other neurological disorders. Functional activation tasks commonly utilized during fMRI include making a fist (Kim et al., 2004), wrist extension (Cramer et al., 2005; Lindberg et al., 2004), wrist passive flexion–extension (Pariente et al., 2001), arm flexion–extension (Luft et al., 2004), finger flexion–extension (Johansen-Berg et al., 2002; Pariente et al., 2001; Schaechter et al., 2002), finger tapping (Cramer et al., 2005), sequential finger tapping with opposition (Kim et al., 2004; Levy et al., 2001), and tracking a sine wave with the finger (Carey et al., 2002; Kimberley et al., 2004). These paradigms may be performed within a parametric activation design, such as at 30 and 50% of maximum grip strength (Ward et al., 2003). Unfortunately these tasks may not provide optimally controlled studies within subjects whose motor function is changing over time of repeated tests or across subjects, since normalization and repeatability of each task in terms of speed, kinematics, forces, etc. is especially difficult to accomplish in impaired subjects. As a result, it is often hard to normalize such tasks which make it difficult to compare results across subjects.
One way to control for these shortcomings is to utilize isometric force measurements during fMRI studies. Here, subjects match a target such as a percentage of their maximal effort, making it possible to compare cerebral activation patterns and behaviors across subjects. This approach also allows subjects with low and higher levels of motor control to participate in an interventional study and to be compared in a group analysis. Measurements can be made by absolute and relative scales, which may provide additional insight into the neural recovery process of more impaired patients.
No commercially available fMRI compatible force measuring systems quantify forces exerted by subjects in their upper extremities. A system that can monitor behavioral tasks in realtime, such as isometric wrist moments, can be used during target-matching tasks, where forces or joint moments exerted along a particular axis can be displayed to the individual. This allows for well controlled motor tasks, which in turn can be generalized across subjects. Force sensing devices for a very specific task have been used in prior studies, but little information was provided about flexibility and utility in highly impaired subjects (Dettmers et al., 1996; Ehrsson et al., 2000; Liu et al., 2000; Thickbroom et al., 1998). Cramer et al. (2005) detailed a custom MR compatible dynamometer that quantifies hand grip force during fMRI testing, allowing for brain activation patterns to be quantified at varying levels of effort level.
This study describes an MR-compatible wrist module that can measure isometric forces and moments exerted at the hand and wrist while simultaneously performing fMRI scans of the brain. A complete description of the device is provided, along with pilot fMRI data collected in healthy controls demonstrating the systems MR compatibility and null effects on image quality. Portions of this work have been previously reported (Hidler et al., 2005).
2. System description
2.1. Instrumentation
A custom 6-axis non-magnetic load cell was built by JR3 Inc. (35-E15A; Woodland, CA) which measures the forces and moments exerted by test subjects on a Delrin® handle (Fig. 1). Utilizing a 6-axis load cell provides the distinct advantage that forces and moments exerted during fMRI testing can be monitored in real-time, are continuous in nature, and scale linearly with exertion level. The load cell and handle are mounted on a polyethylene wedge so that when testing in the supine position, the subject's elbow is flexed 30°. Maintaining a slightly flexed elbow improves comfort during testing, and accommodates neurological patients with elbow contractures that prevent full elbow extension. The wedge snaps into slots on a small sheet of polyethylene which the subject lays on during testing, where their body weight acts to anchor the system down and prevent movement. This also allows for both right and left arm testing with minimal setup changes.
Fig. 1.
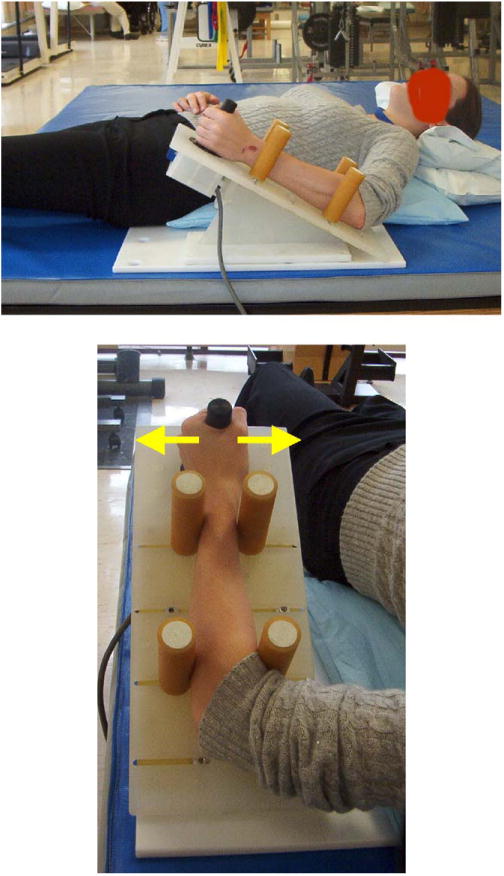
Wrist module developed for use during fMRI testing. Subjects lightly grasp the plastic handle extending from the load cell and exert wrist flexion–extension or ulnar–radial deviation forces against it. The arrows denote the direction of the applied forces for wrist flexion or extension. The forearm is supported by four padded bumpers which helps minimize forces from propagating up the arm necessitating contraction of proximal arm muscles. The plastic wedge is mounted to a plastic base which the subject lays onto anchor the device.
Four padded adjustable bumpers are used to stabilize the forearm during testing. The contact point of the bumpers along the forearm can be changed and the width of the bumpers adjusted to accommodate forearms of different sizes. The configuration of the bumpers guarantees form closure, which prevents the forearm from rotating and also stops the forces generated at the hand and wrist from propagating up the arm. This is especially important in fMRI studies as it mitigates the necessity of the subject to contract their proximal muscles at the shoulder and upper arm to help stabilize the limb. This allows for isolated testing of the brain activation areas that are responsible for activating the wrist flexor and extensor muscles. It should be noted that the forearm bumpers can be adjusted so that the wrist can be placed into flexion or extension, which may be important when testing subjects with wrist dystonia.
A 30′ cable that extends from the load cell connects to an optical isolation panel with a non-magnetic connector, where the load cell signals and sensor power are transferred between the control room and scanner room. All analog signals are read into a PC through a custom electronics module containing a 16-bit analog to digital converter. Signals are low-pass filtered at 50 Hz before being sampled at 1000 Hz. A representation of the subject attached to the device is shown in Fig. 1.
Isometric forces and moments measured by the load cell are transformed back to the wrist using a homogeneous transformation (Craig, 1989):
| (1) |
which can be expanded to:
| (2) |
where is a 3 × 3 rotation matrix from the sensor coordinates {s}. to wrist coordinates {w}, is a 3 × 3 skew matrix from {s} to {w}, and Fi and Ti denote force and torque in each respective frame (s: sensor, w: wrist).
The transformation from load cell frame to wrist frame was calculated to be accurate to within 3% of the range of loads typically exerted during the experiments. During fMRI testing, all joint moments are normalized to the subject's maximum ability for that joint, and are therefore expressed as a percentage of maximum. This allows for standardized testing across subjects who have differences in strength and function.
2.2. Software
Custom software was written to acquire signals from the load cell, and to display measured joint moments to the subject in real-time for target matching purposes (Matlab R14SP3, Mathworks, Natick, MA). An operator interface, shown in Fig. 2a, echoes the subject interface and also displays the moments generated along all directions (e.g. wrist flexion–extension, wrist ulnar–radial deviation, and forearm pronation–suppination). Monitoring what the subject does along each direction ensures that the subject adheres to the protocol throughout the fMRI test sessions.
Fig. 2.
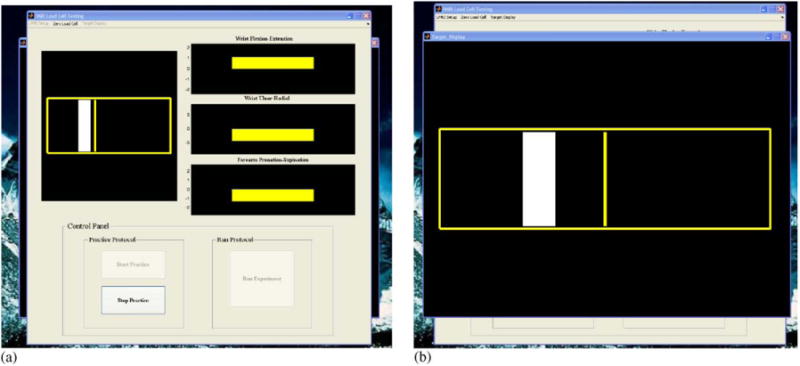
Graphical user interface. (a) The operator screen shows the subject target display as well as the joint moments exerted by the subject along wrist flexion–extension and ulnar–radial deviation axes, as well as forearm pronation–suppination. (b) The subject target display consists of a target (rectangle shown in white) and a cursor (bar shown in yellow). The subject is instructed to exert a joint moment along a particular joint axis (e.g. wrist flexion) and move the cursor into the target for a specified amount of time. In between trials, the cursor remains locked in the center of the screen for the subject to fixate on.
The subject interface (Fig. 2b) is very user-friendly, consisting of a target that is centered at a percentage of the subject's maximum torque level and a cursor which responds to joint moments exerted only along the axis of interest (e.g. wrist flexion). The target width is adjustable, and is proportional to the maximum torque the subject can generate (e.g.± 2.5% max). The goal of the subject is to generate a joint moment in order to move the cursor into the target and hold it there for a specified amount of time (see below). The properties of the display (e.g. cursor and target width, colors, line thicknesses, etc.) are all modifiable for individual studies. The interface is projected to the subject using a color LCD projector onto stereo glasses that are fixed to the top of the head coil. The custom software is triggered by the MR scanner though a TTL pulse, ensuring synchronization between the recorded joint moments and the fMRI data.
3. System evaluation
The device described above was first tested in a laboratory setting with two main goals. First, because we display targets as a percentage of the subject's maximum joint moments, we were interested in evaluating the repeatability of the test, in terms of the variance in maximum joint moments across test sessions. Second, to our knowledge, there have been no published reports describing the level of force exertions subjects can achieve at the hand without recruiting synergistic muscles of the upper limb. Since our goal was to study brain activity during wrist flexion and extension exertions, we wanted to minimize muscle activity in the upper arm and shoulder muscles.
3.1. Protocol
To evaluate the repeatability of maximum joint moments measured by the device as well as muscle activation patterns across force levels, four healthy volunteers with no known physical impairments of the upper extremities were recruited (three men, one women, age range: 21–33). Each subject was placed in the device on two separate occasions, where for each test session, their maximum wrist flexion moment was recorded five times with 1 min rest breaks separating each trial. Here, the subject was instructed to flex their wrist as hard as possible for approximately 4 s. Verbal reinforcement was used to help encourage maximal effort. We limited our tests to only wrist flexion since we do not believe that there would be any bias in repeatability associated with the direction of the wrist exertion.
On the second test session, muscle activity was recorded differentially from the flexor carpi radialis, extensor carpi radialis brevis, biceps, triceps and deltoid muscles using a Bagnoli-8 EMG system (Delsys, Inc., Boston, MA). EMG electrodes were placed over the muscle belly after the skin was lightly abraded and cleaned. After a 5 min rest break following the maximum exertion sequence, subjects were presented with visual targets located at 10, 20, 30, 40, and 50% of their maximum wrist flexion moment and were instructed to flex their wrist, moving the cursor into the target. Here, maintaining the cursor within the target for 1 s terminated the trial, which was followed by a 15 s rest period. Each exertion level was tested 5 times, resulting in 25 total trials. The order in which the exertion levels were presented was randomized in order to eliminate any bias in testing order. In order to normalize each muscle's EMG pattern exhibited during the target matching sequence, subjects were asked to maximally contract each muscle as hard as possible for 5 s during which motion of the limb was prevented by utilizing firm external resistance. This process was repeated for all five muscles studied.
3.2. Data analysis
The maximum joint moment was identified for each trial as the peak moment sustained by the subject for at least 200 ms. A total of five maximum exertions were collected for wrist flexion during both test sessions. In order to determine whether the maximum wrist flexion moments were different across test sessions, a single-factor ANOVA was calculated for each subject with α=0.05.
EMG activity from each muscle was band-pass filtered (20–450 Hz), full-wave rectified, and then smoothed using a 50-point RMS algorithm. Each EMG trace was then normalized to the maximum EMG value observed during the maximum exertion trials for each respective muscle. Normalizing muscle activity allowed for muscle activations observed during the target matching sequence to be expressed as the percentage of peak activity observed in each muscle. The level of muscle activity for each force level (e.g. 10% max–50% max) was identified as the mean level of activity the subject generated while in the specified target.
3.3. Results
As illustrated in Fig. 3, there were no differences in the maximum wrist flexion torques generated by all four subjects between sessions 1 and 2 (p < 0.05). Within each test session, subjects demonstrated consistent maximum exertions as evidenced by the small 95% confidence interval bars. These findings demonstrate that data collected across test sessions can be reliably compared since targets are presented as a percent of maximum exertion level which does not change across test sessions.
Fig. 3.
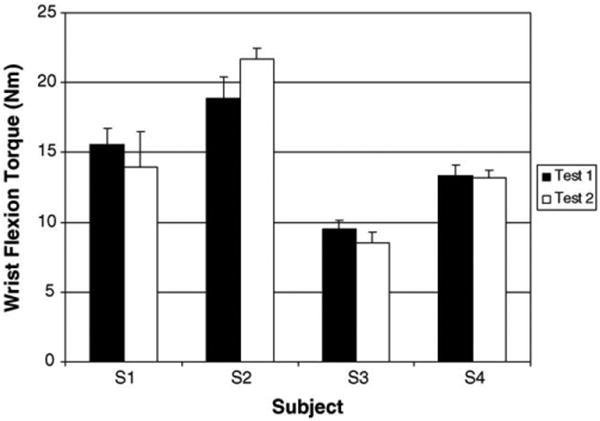
Mean maximum isometric wrist flexion torques for subjects S1–S4 for sessions 1 and 2. There were no statistical differences in maximum joint torque between sessions. Note the error bars represent 95% confidence intervals.
We were also interested in determining how muscles throughout the arm and shoulder were activated across exertion levels. It is shown in Fig. 4 that as expected, muscle activation level in the flexor carpi radialis increases as the flexion target increases from 10to 50% of maximum effort level. We also noticed a gradual increase in the extensor carpi radialis brevis with increasing wrist flexor moment despite this muscle being an antagonist to the desired exertion direction. We believe that since the subjects are required to target match force levels which requires a high level of control, the wrist extensors are used to help stabilize the wrist. It has been previously shown that co-contraction is an effective motor control strategy for improving joint stiffness and consequently postural stability (Gribble et al., 2003).
Fig. 4.
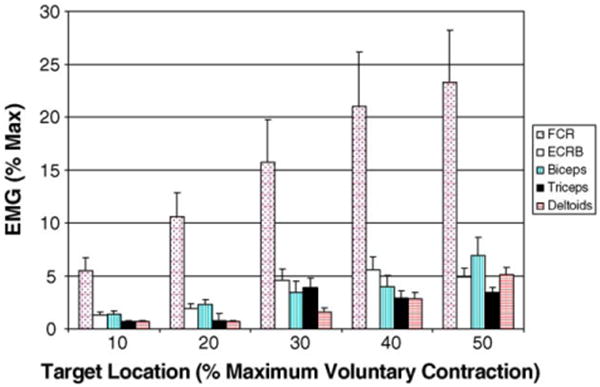
Group mean muscle activation patterns for target locations ranging from 10 to 50% maximum wrist flexion torque. It can be seen that while the flexor carpi radialis scales with increasing exertion level, the proximal arm muscles remain quiet due to the forearm bumpers preventing the forces generated at the wrist from propagating up the arm (see text for details).
We did not observe significant activity in the biceps, triceps, or deltoid muscles throughout any of the exertion levels (Fig. 4). As described in the description of the device, the bumpers positioned along the forearm help capture the forces generated at the wrist, eliminating the need to stabilize the upper arm. While the subjects tested were able to isolate muscle activation patterns to the wrist, we do not believe that individuals with neurological injuries (e.g. stroke) would demonstrate similar trends. Further testing will be required of these subjects, however based on these preliminary results, it would appear that low exertion levels should be attainable even in subjects with significant arm motor impairments.
4. fMRI study
A series of fMRI pilot studies were conducted with three primary objectives. First, we wanted to determine whether the presence of the device in the MR environment produced artifacts in the fMRI data and conversely, to evaluate the quality of the JR3 load cell signals in the presence of a 3 T magnetic field. Second, we wanted to be sure that subjects could execute the protocol inside the scanner and that the device was comfortable for the subject. Finally, we wanted to evaluate areas of brain activation during wrist exertions to be sure that using the device does not elicit activations patterns inconsistent with isolated wrist exertions.
4.1. Signal-to-noise ratio with or without the device in the scanner
Prior to imaging healthy volunteers, estimation of scanner signal-to-noise (SN) ratio was obtained with a GE 3T MRI scanner (GE Medical, Waukesha, WI) by imaging an NiCl2 spherical phantom with a diameter of 16.4 cm with and without the device in the scanner. Two types of MRI images were acquired: fast spoiled gradient recalled (FSPGR) imaging and echo planner imaging (EPI) using the scan sequence supplied by GE Medical. For both types of imaging, one scan of the phantom with the device and the other without the device were acquired separately. The device was placed inside the scanner approximately at the location of the subject's hand when performing the task with the device. For the FSPGR, 11 slices were acquired (slice thickness=3, TE=8, TR=300, flip=90, FOV=24, NEX=1, and matrix frequency = 256 × 128). The EPI sequence acquired 26 slices (slice thickness = 30, TE = 30, TR = 2000, flip = 90, FOV=24, NEX=1, and matrix frequency=64×64) The SN ratios for the FSPGR and the EPI sequence were estimated by sampling a spherical area of 15 mm in diameter at the center and outside of the phantom image. The S/N ratio was calculated using the mean signal intensity and the standard deviation of the MR signals within these two sampled regions (Table 1).
Table 1. Phantom MRI test parameters.
| Parameter | Sequence | |
|---|---|---|
|
|
||
| FSPGR | EPI | |
| TE | 8 | 30 |
| TR | 300 | 2000 |
| Flip | 90 | 90 |
| Spacing | 0 | 4 |
| Slice thickness | 3 | 0 |
| FOV | 24 | 24 |
| Phase FOV | 1 | 1 |
| NEX | 1 | 1 |
| Matrix frequency | 256 × 128 | 64 × 64 |
Following the phantom scans, the device was tested with three healthy volunteers (aged 23, 24, and 26). During the fMRI scans, subjects lay in the supine position with their right forearm supported by the four bumpers distributed proximally and distally along their forearm. Subjects' maximum wrist flexion force was measured with the device and recorded by the computer prior to the fMRI scans. Each fMRI scan (i.e., a run) included three predetermined levels of force that the subjects were instructed to perform, that is, 10, 20, and 30% of the subjects' own maximum wrist flexion torque measured prior to the scans. A total of 16 trials for each of the three torque levels were run during the scan sequence. Subjects were instructed to make rapid wrist flexion exertions with their right hand by moving the cursor into the target zone at 10, 20 and 30% of their maximum force. A trial ended either after the subject held the cursor in the target zone for one second or was automatically terminated after 6s had lapsed. The timeout feature is mainly for subjects with significant arm impairments who may have difficulty hitting the target. Trials were separated by fixation blocks ranging from 8 to 14 s, where the cursor remained stationary in the center of the display. The MRI scanner trigged the onset of the task and the acquisition of the load cell data to ensure tight synchronization between the fMRI data and wrist moments generated during the scans. All subjects were given practice trials prior to the fMRI scans.
Fig. 5 shows a subject inside the scanner using the wrist device, where it can be seen that during fMRI testing, the wrist module is located just inside the scanner bore. The GE scanner used in this study has a bore diameter of 55 cm and a bed width of 49 cm. These dimensions were more than adequate to accommodate even larger adults. In the study, all of the test subjects reported that operating the device during fMRI testing was comfortable and the visual display was easy to follow. A sample section of wrist flexion joint moments corresponding to 20 ± 4% of max is shown in Fig. 6. The height of the shaded block corresponds tothe target width (e.g. ±4%) while the width corresponds to the timeout period (e.g. 6 s). The vertical dotted lines mark the appearance of the target, where the subject was instructed to flex her wrist and move the cursor into the target and hold it for one second. It can be seen on the joint moment traces that the noise levels on the load cell signals are not influenced by the magnetic field.
Fig. 5.
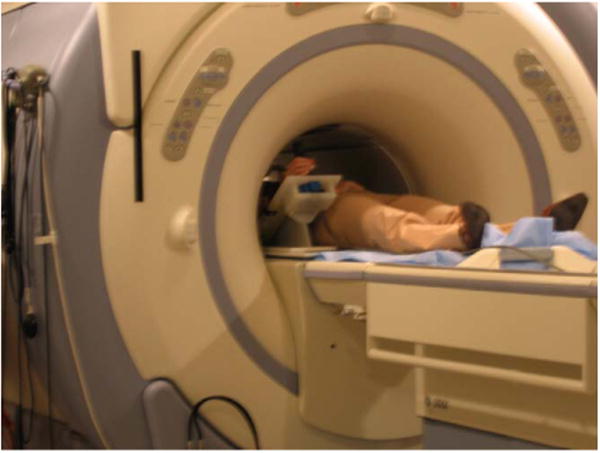
Illustration of the wrist device being used inside the scanner during fMRI testing. The wrist module is normally located just inside the scanner bore, dependent on the size of the test subject.
Fig. 6.
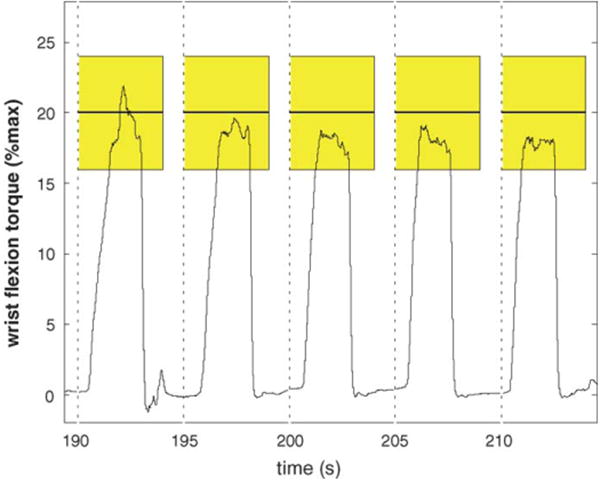
Section of wrist flexion moments generated during an fMRI scan. The shaded rectangles represent the target, where the vertical component represents the target level (e.g. 20 ±4% maximum) while the width of the shaded region represents the timeout period (e.g. the maximum time the target will be displayed). The vertical dashed lines represent when the targets appear.
The fMRI data acquired in the study were realigned, coregistered to each subject's own anatomical images, and spatially smoothed (FWHM=8mm3) using SPM2 imaging processing software created by the Wellcome Department of Cognitive Neurology, University College London, U.K. (Friston et al., 1995; Turner et al., 1998). Statistical contrasts of MR signals for each level of force relative to the resting baseline were also performed using SPM2 software and the general linear model (Friston et al., 1995; Turner et al., 1998). All activation data were analyzed separately for each of three subjects using t-tests contrasting active conditions (i.e., three levels of force) with the resting baseline. The reported activation maps included voxels that survived a corrected threshold of p < 0.0001 and were mapped onto the subject's own anatomical images. In addition to the t-tests, conjunction analyses were also performed to identify common brain regions activated in all three conditions.
4.2. fMRI results
The S/N ratio test with the phantom using the FSPGR and the GE EPI sequence showed no significant difference between the scan with the device and that without the device. The S/N ratios of these two scans were virtually identical (see Table 2). In addition, there was no noticeable artifact in either type of images when scanned with the device.
Table 2. Phantom MRI results.
| Mean signal | S.D. | Area (mm) | Ratio (N) | |
|---|---|---|---|---|
| FSPGR sequence | ||||
| Without device | ||||
| Inside phantom | 2085.71 | 11.40 | 155.32 | 0.032 |
| Outside phantom | 12.19 | 2.06 | 155.32 | |
| With device | ||||
| Inside phantom | 2081.76 | 11.08 | 155.32 | 0.026 |
| Outside phantom | 12.98 | 2.7 | 155.32 | |
| EPI sequence | ||||
| Without device | ||||
| Inside phantom | 4481.40 | 25.08 | 155.32 | 0.064 |
| Outside phantom | 116.94 | 10.19 | 155.32 | |
| With device | ||||
| Inside phantom | 4470.23 | 28.73 | 155.32 | 0.065 |
| Outside phantom | 110.00 | 10.84 | 155.32 |
The fMRI results showed highly significant and repeatable activation patterns across all three subjects. Specifically, for all three levels of isometric wrist force generation, consistent activation was observed in all three subjects in the contralateral (i.e., the left) primary motor cortex, the primary sensory cortex, and the right superioparietal regions (Fig. 7). The consistency of the activation loci suggests that the wrist device allow reliable quantification of the coupling between a specific type of task (in this case, wrist flexion) and its associated cortical responses with measurable constraints. No movement artifact from head or shoulder motion was detected at any of the force levels tested.
Fig. 7.
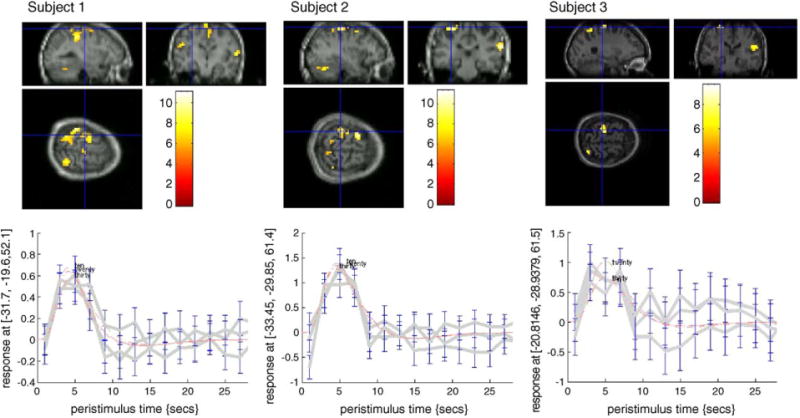
A representative scan of the motor cortex during a wrist flexion behavioral task located at 20% maximum exertion level. See text for interpretation of results.
5. Conclusion and discussion
The device described in this study offers an accurate and reproducible way to quantify and monitor motor patterns at the hand and wrist, a common protocol used in studies of neuroplasticity after stroke, inside and outside the fMRI environment. The device accurately measures isometric joint moments generated at the wrist with a user-friendly interface, contains an easy to follow visual display for bio-feedback of performance, as well as for monitoring purposes by the experimenter, does not introduce noise or movement artifacts in the fMRI data, and is not influenced by the large magnetic fields in the scanner.
Measurement of isometric joint moments as a behavioral task in neuroimaging studies of motor recovery after stroke is extremely useful (Ward, 2004; Ward and Cohen, 2004). First, from a biomechanics standpoint, forces and moments generated at our joints precede limb movement. So by scaling these forces and moments, we are in essence studying change in motor out flow to the affected limbs. Along those lines, by eliminating limb motion tracking, the task is simplified as the need to plan and then execute a movement trajectory is eliminated.
The second reason we believe that a motor task based on isometric force tracking is viable for fMRI studies is that it allows for patients with limited motor function to be studied accurately. For example, early after stroke, many patients have poor motor control in their distal joints (e.g. fingers and wrist) so that trying to execute a finger tapping task is difficult if not impossible for them to accomplish. Because of the high sensitivity of the load cell in this device, we can measure torques under 1N m which expands the possibility to test even the lowest functioning patients. In addition, eliminating limb motion may help to minimize abnormal synergy patterns and spastic contractions.
A final reason why isometric force tracking may be a good alternative to motion paradigms during fMRI testing is that because the joint moments are normalized to the maximum exertion capabilities of subjects at any given time, as subjects recover following neurological injuries such as stroke, fMRI data obtained through the recovery process can be compared. For example, a subject can be asked to target match 10–30% of their maximum ability at any point in their recovery, so that brain activations can be compared on a relative scale that to some extent normalizes for the degree of effort required to implement the task.
The technology presented in this paper has now been expanded to the lower limb, where isometric ankle, knee, and hip moments are being studied in healthy individuals and also those following stroke. The stroke studies will be used to try and determine how changes in brain activation patterns lead to improved motor recovery.
Acknowledgments
Portions of this work were supported by the National Rehabilitation Hospital and through grant number DAMD 17-02-2-0032 which is awarded and administered through the U.S. Army Medical Research Acquisition, 820 Chandler Street, Fort Detrick MD 21702-5014. This information does not necessarily reflect the position or the policy of the Government. No official endorsement should be inferred.
References
- Calautti C, Baron JC. Functional neuroimaging studies of motor recovery after stroke in adults: a review. Stroke. 2003;34(6):1553–66. doi: 10.1161/01.STR.0000071761.36075.A6. [DOI] [PubMed] [Google Scholar]
- Carey JR, Kimberley TJ, et al. Analysis of fMRI and finger tracking training in subjects with chronic stroke. Brain. 2002;125(Pt 4):773–88. doi: 10.1093/brain/awf091. [DOI] [PubMed] [Google Scholar]
- Craig JJ. An introduction to robotics: mechanics and control. Reading MA: Addison–Wesley Publishing; 1989. [Google Scholar]
- Cramer SC, Benson RR, et al. Use of functional MRI to guide decisions in a clinical stroke trial. Stroke. 2005;36(5):e50–2. doi: 10.1161/01.STR.0000163109.67851.a0. [DOI] [PubMed] [Google Scholar]
- Dettmers C, Connelly A, Stephan KM, Turner R, Friston KJ, Frackowiak RS, et al. Quantitative comparison of functional magnetic resonance imaging with positron emission tomography using a force-related paradigm. Neuroimage. 1996;4(3 Pt 1):201–9. doi: 10.1006/nimg.1996.0071. [DOI] [PubMed] [Google Scholar]
- Ehrsson HH, Fagergren A, Jonsson T, Westling G, Johansson RS, Forssberg H. Cortical activity in precision- versus power-grip tasks: an fMRI study. J Neurophysiol. 2000;83(1):528–36. doi: 10.1152/jn.2000.83.1.528. [DOI] [PubMed] [Google Scholar]
- Friston KJ, Frith CD, Turner R, Frackowiak RS. Characterizing evoked hemodynamics with fMRI. Neuroimage. 1995;2(2):157–65. doi: 10.1006/nimg.1995.1018. [DOI] [PubMed] [Google Scholar]
- Gribble PL, Mullin LI, Cothros N, Mattar A. Role of cocontraction in arm movement accuracy. J Neurophys. 2003;89:2396–405. doi: 10.1152/jn.01020.2002. [DOI] [PubMed] [Google Scholar]
- Hidler JM, Mbwana J, Hodics T, Zeffiro T. MRI compatible force sensing system for real-time monitoring of wrist moments during fMRI testing. International Congress on Rehabilitation Robotics. 2005 [Google Scholar]
- Johansen-Berg H, Dawes H, et al. Correlation between motor improvements and altered fMRI activity after rehabilitative therapy. Brain. 2002;125(Pt 12):2731–42. doi: 10.1093/brain/awf282. [DOI] [PubMed] [Google Scholar]
- Kim YH, Park JW, et al. Plastic changes of motor network after constraint-induced movement therapy. Yonsei Med J. 2004;45(2):241–6. doi: 10.3349/ymj.2004.45.2.241. [DOI] [PubMed] [Google Scholar]
- Kimberley TJ, Lewis SM, et al. Electrical stimulation driving functional improvements and cortical changes in subjects with stroke. Exp Brain Res. 2004;154(4):450–60. doi: 10.1007/s00221-003-1695-y. [DOI] [PubMed] [Google Scholar]
- Levy CE, Nichols DS, et al. Functional MRI evidence of cortical reorganization in upper-limb stroke hemiplegia treated with constraint-induced movement therapy. Am J Phys Med Rehabil. 2001;80(1):4–12. doi: 10.1097/00002060-200101000-00003. [DOI] [PubMed] [Google Scholar]
- Lindberg P, Schmitz C, et al. Effects of passive-active movement training on upper limb motor function and cortical activation in chronic patients with stroke: a pilot study. J Rehabil Med. 2004;36(3):117–23. [PubMed] [Google Scholar]
- Liu JZ, Dai TH, Elster TH, Sahgal V, Brown RW, Yue GH. Simultaneous measurement of human joint force, surface electromyograms, and functional MRI-measured brain activation. J Neursci Meth. 2000;101:49–57. doi: 10.1016/s0165-0270(00)00252-1. [DOI] [PubMed] [Google Scholar]
- Luft AR, McCombe-Waller S, et al. Repetitive bilateral arm training and motor cortex activation in chronic stroke: a randomized controlled trial. Jama. 2004;292(15):1853–61. doi: 10.1001/jama.292.15.1853. [DOI] [PMC free article] [PubMed] [Google Scholar]
- Pariente J, Loubinoux I, et al. Fluoxetine modulates motor performance and cerebral activation of patients recovering from stroke. Ann Neurol. 2001;50(6):718–29. doi: 10.1002/ana.1257. [DOI] [PubMed] [Google Scholar]
- Schaechter JD, Kraft E, et al. Motor recovery and cortical reorganization after constraint-induced movement therapy in stroke patients: a preliminary study. Neurorehabil Neural Repair. 2002;16(4):326–38. doi: 10.1177/154596830201600403. [DOI] [PubMed] [Google Scholar]
- Thickbroom GW, Phillips BA, Morris I, Byrnes ML, Mastaglia FL. Isometric force-related activity in sensorimotor cortex measured with functional MRI. Exp Brain Res. 1998;121(1):59–64. doi: 10.1007/s002210050437. [DOI] [PubMed] [Google Scholar]
- Turner R, Howseman A, Rees GE, Josephs O, Friston K. Functional magnetic resonance imaging of the human brain: data acquisition and analysis. Exp Brain Res. 1998;123(1/2):5–12. doi: 10.1007/s002210050538. [DOI] [PubMed] [Google Scholar]
- Ward NS. Functional reorganization of the cerebral motor system after stroke. Curr Opin Neurol. 2004;17(6):725–30. doi: 10.1097/00019052-200412000-00013. [DOI] [PubMed] [Google Scholar]
- Ward NS, Brown MM, et al. Neural correlates of outcome after stroke: a cross-sectional fMRI study. Brain. 2003;126(Pt 6):1430–48. doi: 10.1093/brain/awg145. [DOI] [PMC free article] [PubMed] [Google Scholar]
- Ward NS, Cohen LG. Mechanisms underlying recovery of motor function after stroke. Arch Neurol. 2004;61(12):1844–8. doi: 10.1001/archneur.61.12.1844. [DOI] [PMC free article] [PubMed] [Google Scholar]


