Abstract
Clear cell renal cell carcinoma (ccRCC), the most frequent form of kidney cancer1, is characterized by elevated glycogen and fat deposition2. These consistent metabolic alterations are associated with normoxic stabilization of hypoxia inducible factors (HIFs)3, secondary to von hippel-lindau (VHL) mutations that occur in over 90% of ccRCC tumours4. However, kidney-specific VHL deletion in mice fails to elicit ccRCC-specific metabolic phenotypes and tumour formation5, suggesting that additional mechanisms are essential. Recent large-scale sequencing analyses revealed loss of several chromatin remodelling enzymes in a subset of ccRCC (polybromo 1 [PBRM1] ~40%, SET domain containing 2 [SETD2] ~15%, BRCA1 associated protein-1 [BAP1] ~15%, etc.)6–9, indicating that epigenetic perturbations are likely important contributors to the natural history of this disease. Here we utilized an integrative approach comprising pan-metabolomic profiling and metabolic gene set analysis, and determined that the gluconeogenic enzyme fructose-1, 6-bisphosphatase 1 (FBP1)10 is uniformly depleted in over six hundred ccRCC tumours examined. Importantly, the human FBP1 locus resides on chromosome 9q22, whose loss is associated with poor prognosis for ccRCC patients11. Our data further indicate that FBP1 inhibits ccRCC progression through two distinct mechanisms: 1) FBP1 antagonizes glycolytic flux in renal tubular epithelial cells, the presumptive ccRCC cell of origin12, thereby inhibiting a potential “Warburg effect”13,14, and 2) in pVHL-deficient ccRCC cells, FBP1 restrains cell proliferation, glycolysis, and the pentose phosphate pathway in a catalytic activity-independent manner, by inhibiting nuclear HIF function via direct interaction with the HIF “inhibitory domain”. This unique dual function of the FBP1 protein explains its ubiquitous loss in ccRCC, distinguishing FBP1 from previously-identified tumour suppressors (PBRM1, SETD2, BAP1, etc.) which are not consistently mutated in all tumours6,7,15.
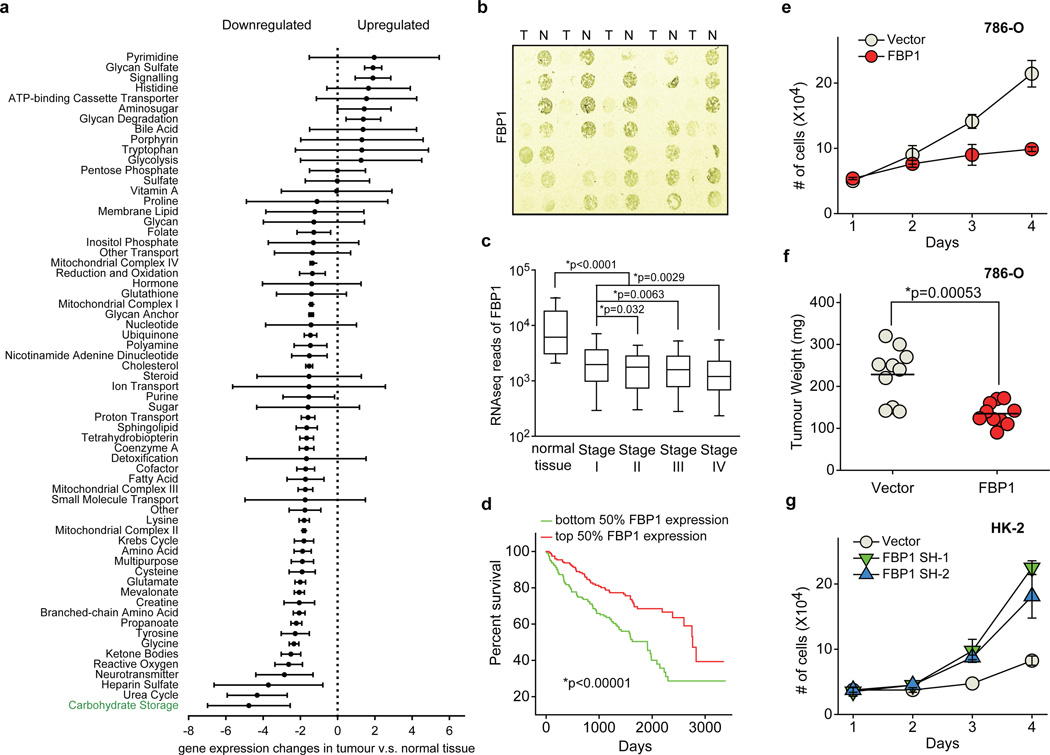
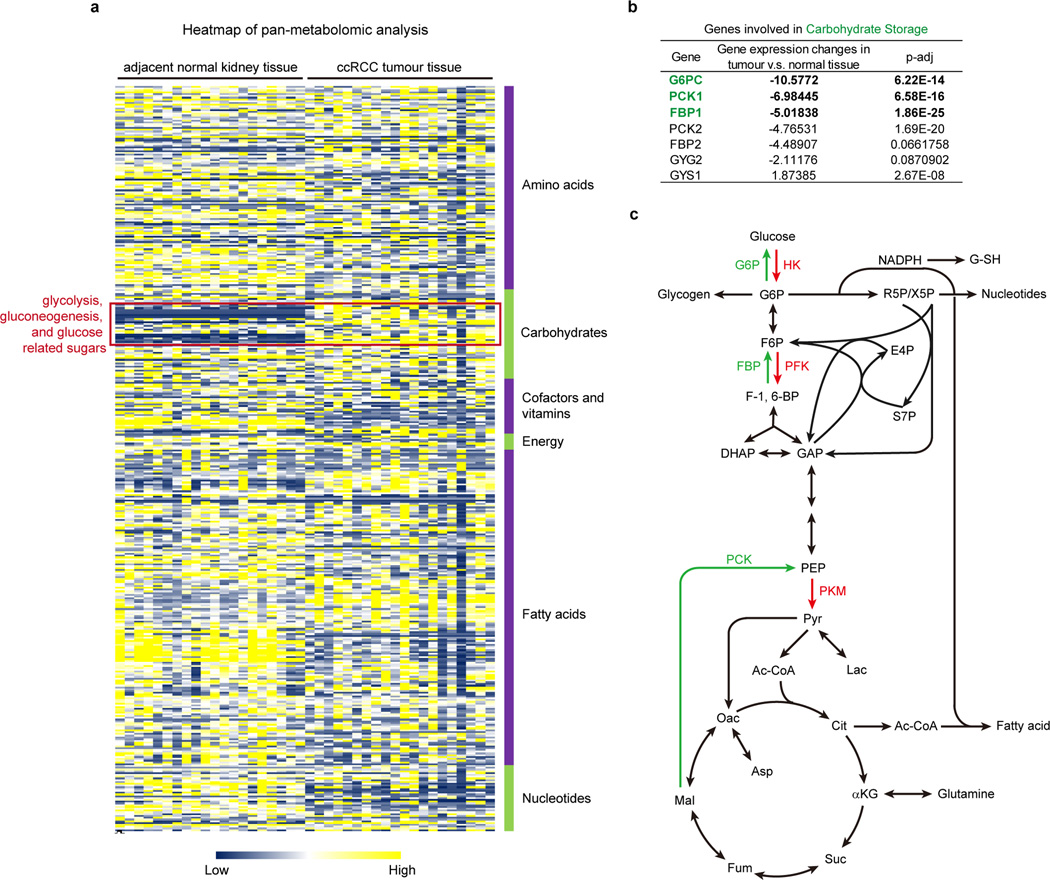
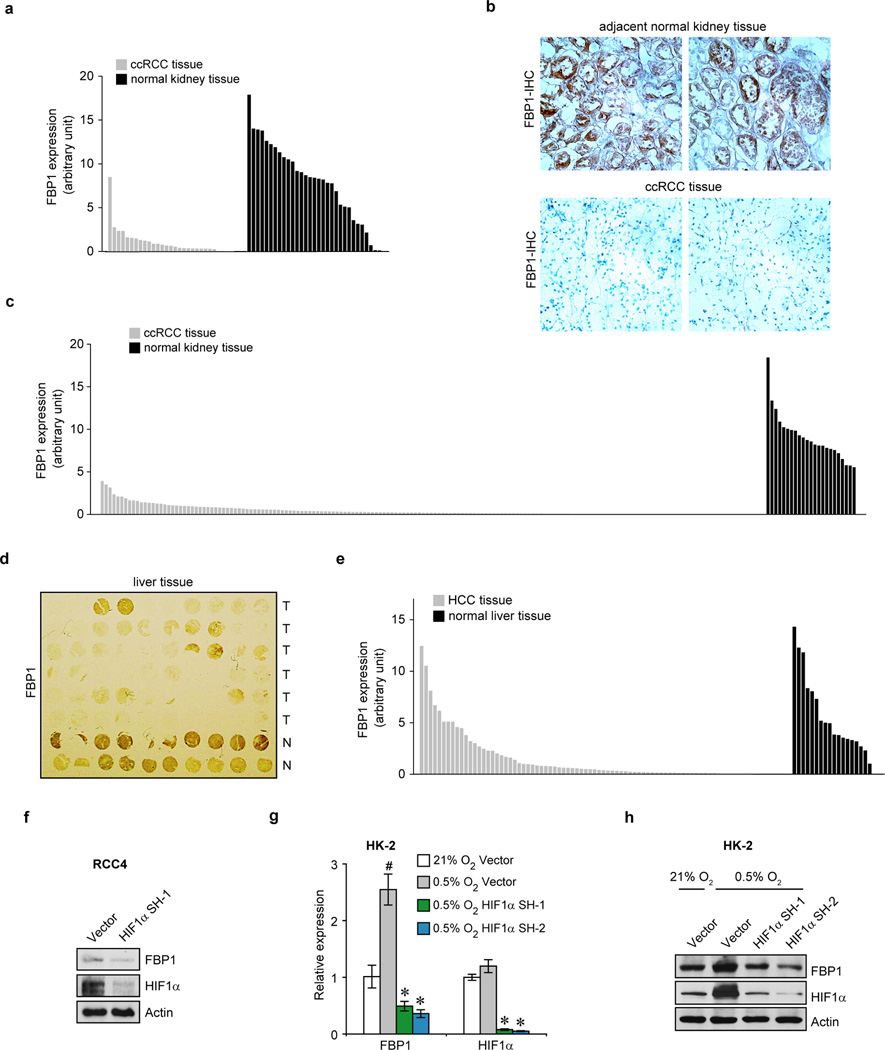
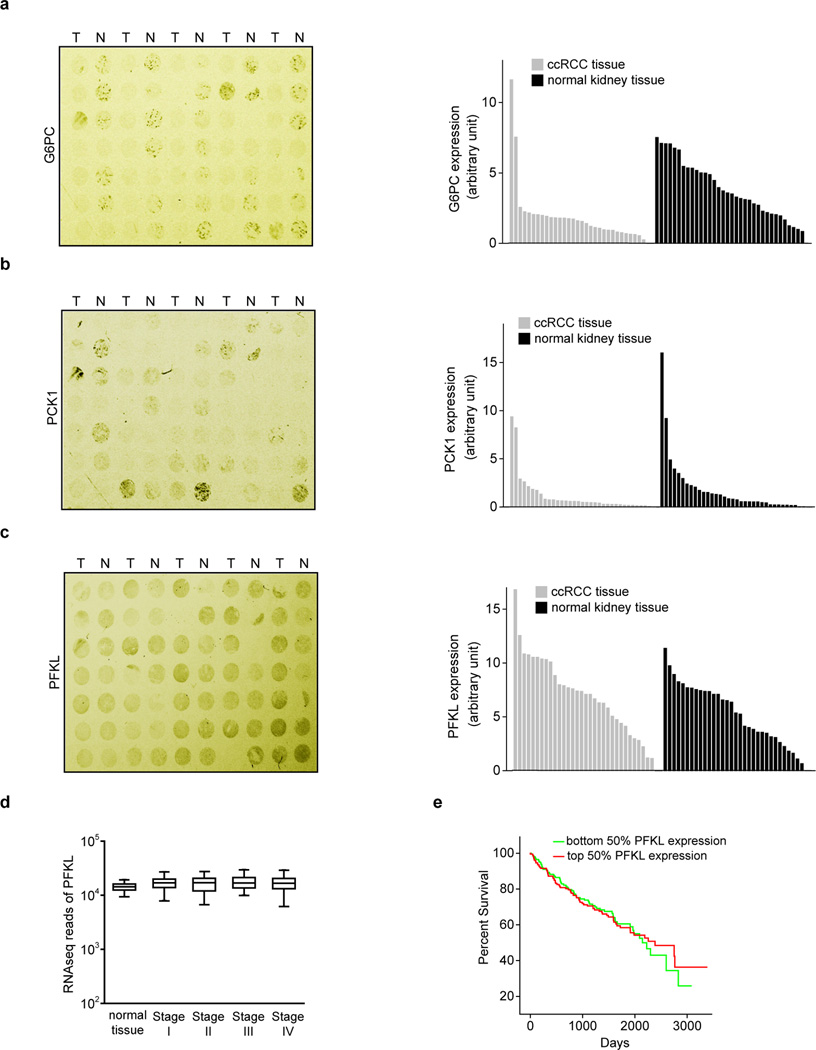
We performed pan-metabolomic analysis (Methods) on 20 primary human ccRCC tumours and matching normal kidney tissues. Levels of metabolites involved in glycolysis, gluconeogenesis, and glucose-related sugar metabolism were highly elevated in tumours, suggesting that reprogramming of glucose metabolism is critical for ccRCC progression (Extended Data Fig. 1a). Furthermore, metabolic gene set analysis16 on TCGA ccRCC RNAseq data indicated that the “carbohydrate storage” group was the most significantly underexpressed gene set in ccRCC tumours (Fig. 1a), including three genes controlling renal gluconeogenesis17 (glucose-6-phosphatase, catalytic subunit [G6PC], phosphoenolpyruvate carboxykinase 1 [PCK1], and fructose-1, 6-bisphosphatase 1 [FBP1]) (Extended Data Fig. 1b–c). Elevated HIF activity in ccRCC tumours stimulates aerobic glycolysis by increasing the expression of glycolytic genes, including phosphoglycerate kinase 1 (PGK1) and lactate dehydrogenase A (LDHA), and shunting glycolytic flux away from the TCA cycle by activating pyruvate dehydrogenase kinase 1 (PDK1)3. However, our integrative analyses identified suppression of gluconeogenesis as an additional component of glucose regulation in ccRCCs. Next, we determined that the rate-limiting gluconeogenic enzyme FBP1 was inhibited at the level of protein accumulation in almost 100% of ccRCC tumours examined (n>200, Fig. 1b and Extended Data Fig. 2a–c) compared to normal kidney tissue. Similar results were observed for hepatocellular carcinomas and normal liver tissue (Extended Data Fig. 2d–e). FBP1 inhibition is not mediated by ccRCC-associated HIF activation, because HIF1α ablation failed to de-repress FBP1 expression in RCC4 ccRCC cells (Extended Data Fig. 2f). Moreover, HK-2 proximal tubule cells (from which ccRCCs appear to be derived12) exhibited HIF1α-dependent induction of FBP1 under hypoxia (Extended Data Fig. 2g–h). Compared to FBP1, the other two gluconeogenic enzymes G6PC and PCK1 were either modestly suppressed (G6PC), or exhibited no consistent change (PCK1) in ccRCC tumours (Extended Data Fig. 3a–b). Interestingly, the glycolytic enzyme phosphofructokinase (liver type, PFKL), which functionally antagonizes FBP1 in glycolysis (Extended Data Fig. 1c), was expressed at equal levels in ccRCC and normal kidney tissues (Extended Data Fig. 3c). In addition, lower FBP1 expression correlates significantly with advanced tumour stage and worse patient prognosis (Fig. 1c–d), whereas PFKL expression does not (Extended Data Fig. 3d–e), suggesting that FBP1 may harbour novel, non-enzymatic function(s).
Figure 1. Integrative analyses reveal that FBP1 is ubiquitously inhibited and exhibits tumour-suppressive functions in ccRCC.
a, Metabolic gene set analysis of RNAseq data provided by the TCGA ccRCC project (http://cancergenome.nih.gov). 480 ccRCC tumour and 69 adjacent normal tissues were included. 2,752 genes encoding all known human metabolic enzymes and transporters were classified according to KEGG (http://www.genome.jp/kegg/). Generated metabolic gene sets were ranked based on their median fold expression changes in ccRCC tumour vs. normal tissue, and plotted as median ± median absolute deviation. b, Immunohistochemistry staining of a representative kidney tissue microarray with FBP1 antibody. T: ccRCC tumours; N: adjacent normal kidney. c, Normalized RNASeq reads of FBP1 in 69 normal kidneys and 480 ccRCC tumours grouped into Stage I–IV by TCGA. d, Kaplan-Meier survival curve of 429 ccRCC patients enrolled in the TCGA database. Patients were equally divided into two groups (top and bottom 50% FBP1 expression) based on FBP1 expression levels in their tumours. e, Growth of 786-O ccRCC cells in low serum medium (1% FBS), with or without ectopic FBP1 expression. f, Xenograft tumour growth of 786-O cells with or without ectopic FBP1 expression. End-point tumour weights were measured and plotted. g, Growth of human HK-2 proximal renal tubule cells with or without FBP1 inhibition in 1% serum medium. Values represent mean±s.d. (four technical replicates, from two independent experiments). *p<0.01.
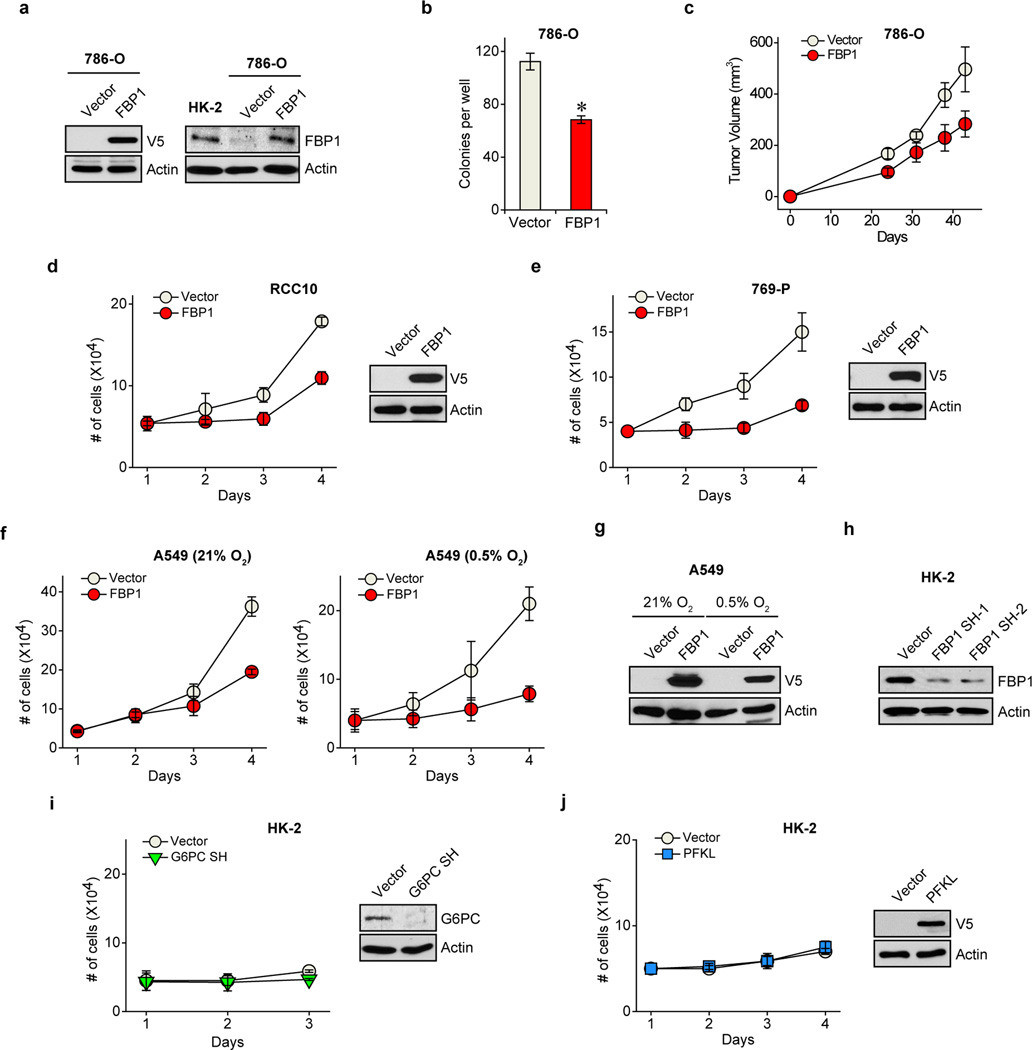
To investigate functional roles for FBP1 in ccRCC progression, we ectopically expressed FBP1 in 786-O ccRCC tumour cells to levels observed in HK-2 proximal tubule cells (Extended Data Fig. 4a). FBP1 expression significantly inhibited 2D culture (Fig. 1e), anchorage-independent (Extended Data Fig. 4b), and xenograft tumour growth (Fig. 1f and Extended Data Fig. 4c). Similarly, enforced FBP1 expression inhibited growth of RCC10 and 769-P ccRCC cells (Extended Data Fig. 4d–e), and A549 lung cancer cells preferentially under hypoxia (Extended Data Fig. 4f and 4g). These results demonstrated that FBP1 can suppress ccRCC and other tumour cell growth, an effect significantly pronounced when coupled with HIF activation. In HK-2 cells, FBP1 depletion, but not G6PC ablation or ectopic PFKL expression, was sufficient to promote HK-2 cell growth (Fig. 1g and Extended Data Fig. 4h–j).
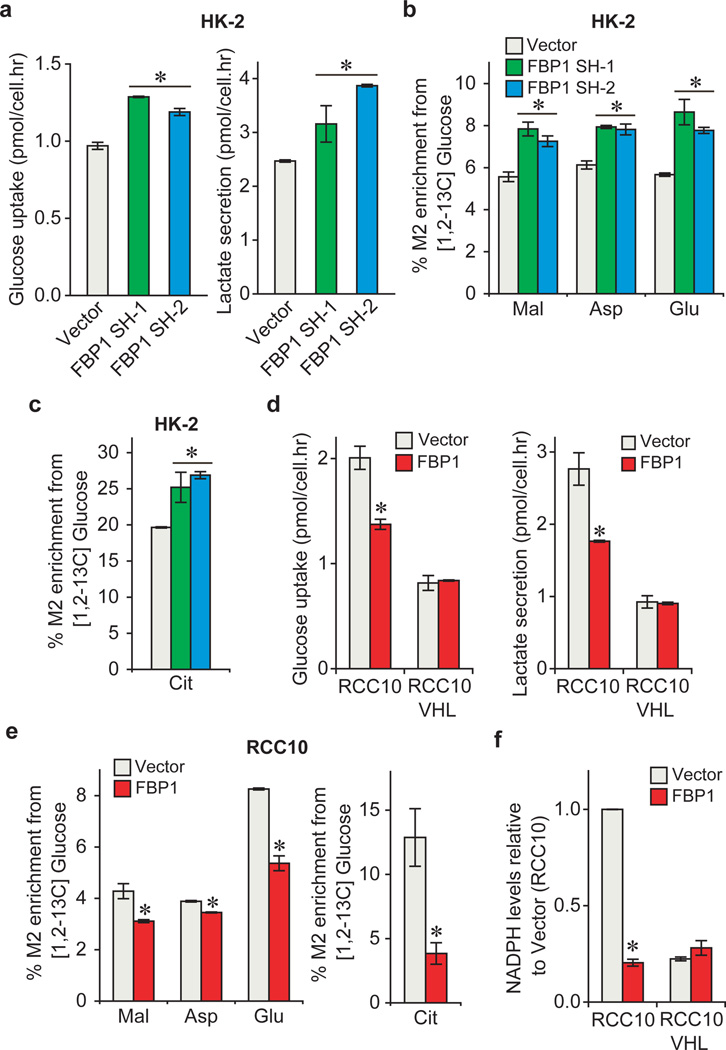
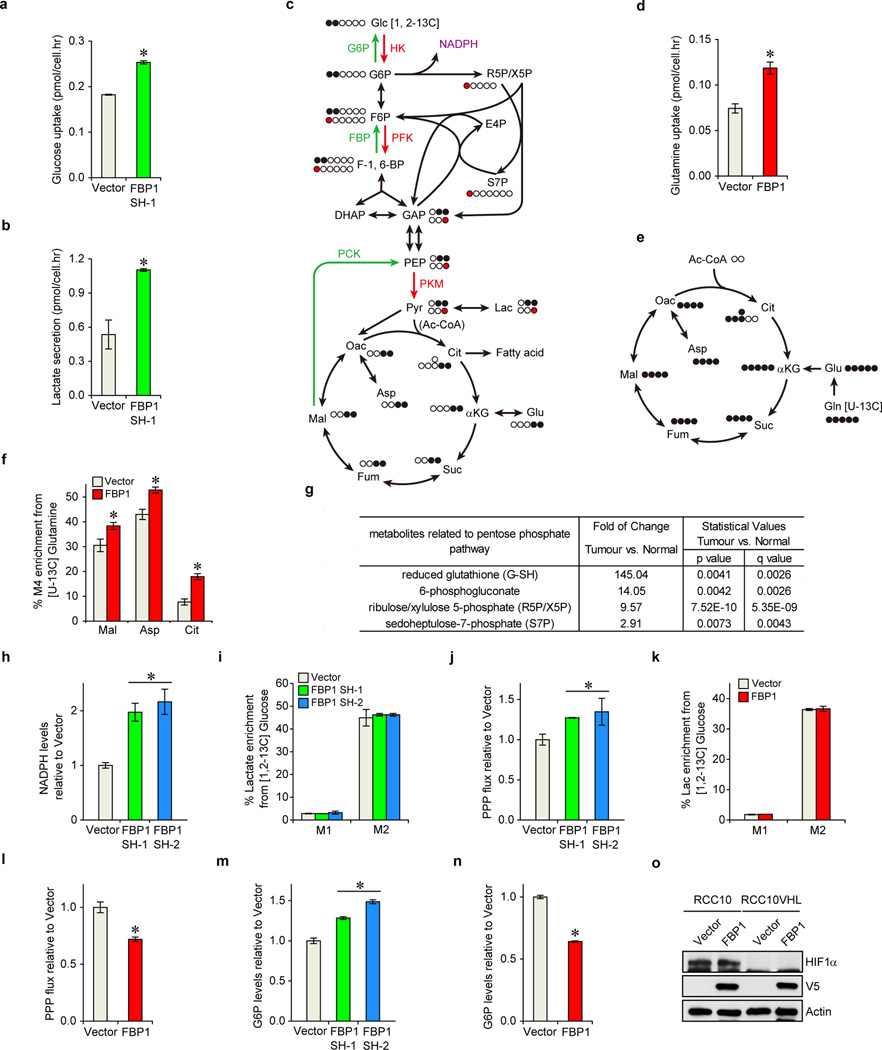
Since FBP1 is the rate-limiting enzyme in gluconeogenesis10, we manipulated FBP1 expression in renal cells and measured glucose metabolism. FBP1 inhibition increased glucose uptake and lactate secretion in HK-2 cells cultured in 10 mM glucose, (Fig. 2a), an effect augmented by lowering glucose levels to 1 mM (Extended Data Fig. 5a–b). To assess glycolytic flux, we performed isotopomer distribution analysis using [1, 2-13C] glucose as the tracer, which produces glycolytic and TCA intermediates containing two 13C atoms (M2 species), as well as corresponding M1 species from the pentose phosphate pathway (PPP; Extended Data Fig. 5c). We observed elevated M2 enrichment of four TCA intermediates (malate, aspartate, glutamate, and citrate) in FBP1-depleted HK-2 cells (Fig. 2b–c). In contrast, G6PC inhibition failed to promote glucose-lactate turnover (data not shown), suggesting that FBP1, but not G6PC, is a critical regulator of glucose metabolism in renal cells. Consistent with this result, ectopic FBP1 expression in a VHL-deficient ccRCC cell line (RCC10) reduced glucose uptake, lactate secretion, and glucose-derived TCA cycle intermediates (Fig. 2d–e). Reduced glucose-dependent TCA flux is known to increase anaplerotic glutamine flux18, and we also observed elevated glutamine uptake and enrichment of glutamine-derived TCA cycle intermediates (M4 species) in [U-13C] glutamine-labelled RCC10 cells expressing FBP1 (Extended Data Fig. 5d–f).
Figure 2. FBP1 regulates glycolysis and NADPH levels.
a, Glucose uptake and lactate secretion in HK-2 cells with or without FBP1 inhibition. M2 isotopomer distribution of indicated metabolites (b) and citrate (c) in HK-2 cells with or without FBP1 ablation, labelled with [1, 2-13C] glucose. % M2 enrichment represents the mole percent excess of M2 species above natural abundance. d, Glucose uptake and lactate secretion in RCC10 and RCC10VHL cells ectopically expressing vector or FBP1. RCC10VHL cells are RCC10 cells where wild-type pVHL has been reintroduced. e, M2 isotopomer distribution of indicated metabolites in RCC10 cells expressing vector or FBP1, labelled with [1, 2-13C] glucose. f, Relative NADPH levels in RCC10 and RCC10VHL cells as indicated in (d). Values represent mean±s.d. (three experimental replicates). *p<0.05.
Pan-metabolomic analyses of ccRCC tumours revealed a marked elevation of reduced glutathione (G-SH)19 (Extended Data Fig. 5g). G-SH synthesis requires the reduced form of nicotinamide adenine dinucleotide phosphate (NADPH), generated primarily though the PPP in human cells19 (Extended Data Fig. 5c). Consistent with increased PPP flux, ccRCC tumours display significant accumulation of G-SH and PPP-related metabolites (Extended Data Fig. 5g), an effect partially recapitulated in FBP1-depleted HK-2 cells (Extended Data Fig. 5h–j). Conversely, FBP1 re-expression in RCC10 cells significantly reduced NADPH levels and PPP flux (Fig. 2f and Extended Data Fig. 5k–l). Interestingly, FBP1-mediated changes in PPP flux (Extended Data Fig. 5j and 5l) were comparable to the changes in glucose 6-phosphate (G6P; Extended Data Fig. 5m–n), the entry metabolite of PPP pathway (Extended Data Fig. 5c), suggesting that FBP1 affects PPP flux primarily through regulating glycolysis. Surprisingly, the ability of FBP1 to reduce glycolysis and NADPH levels was completely abolished in RCC10VHL cells (Fig. 2d and 2f), where wild-type pVHL was introduced into RCC10 to exclude normoxic HIF expression (Extended Data Fig. 5o), indicating that HIF proteins are required for FBP1-mediated effects on glucose metabolism in ccRCC tumour cells.
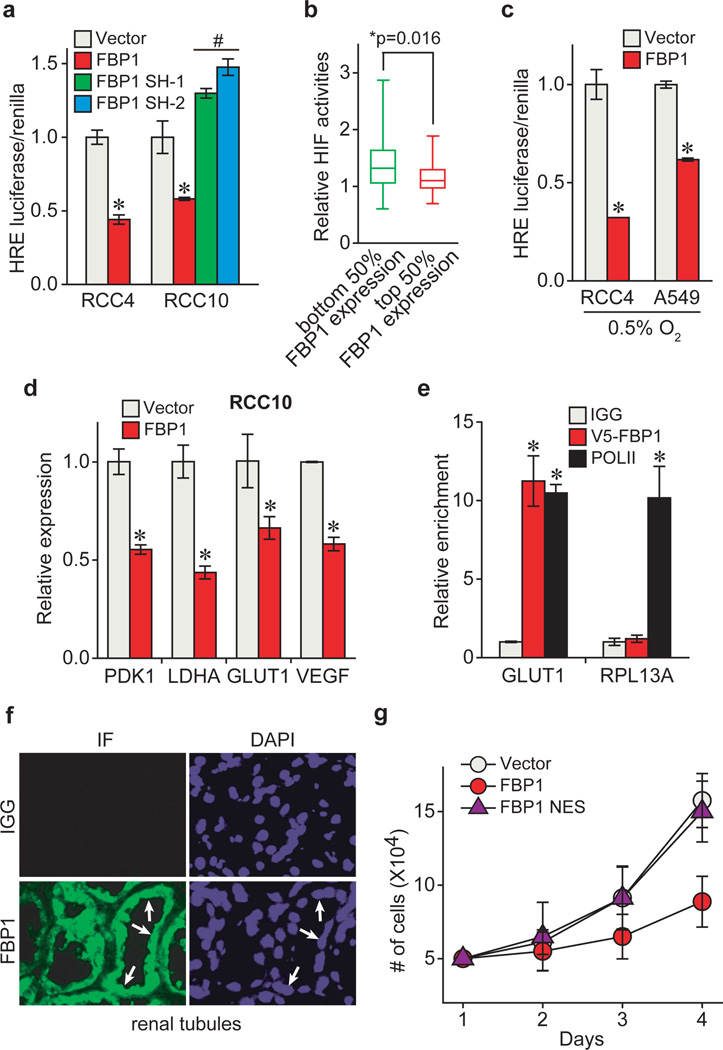
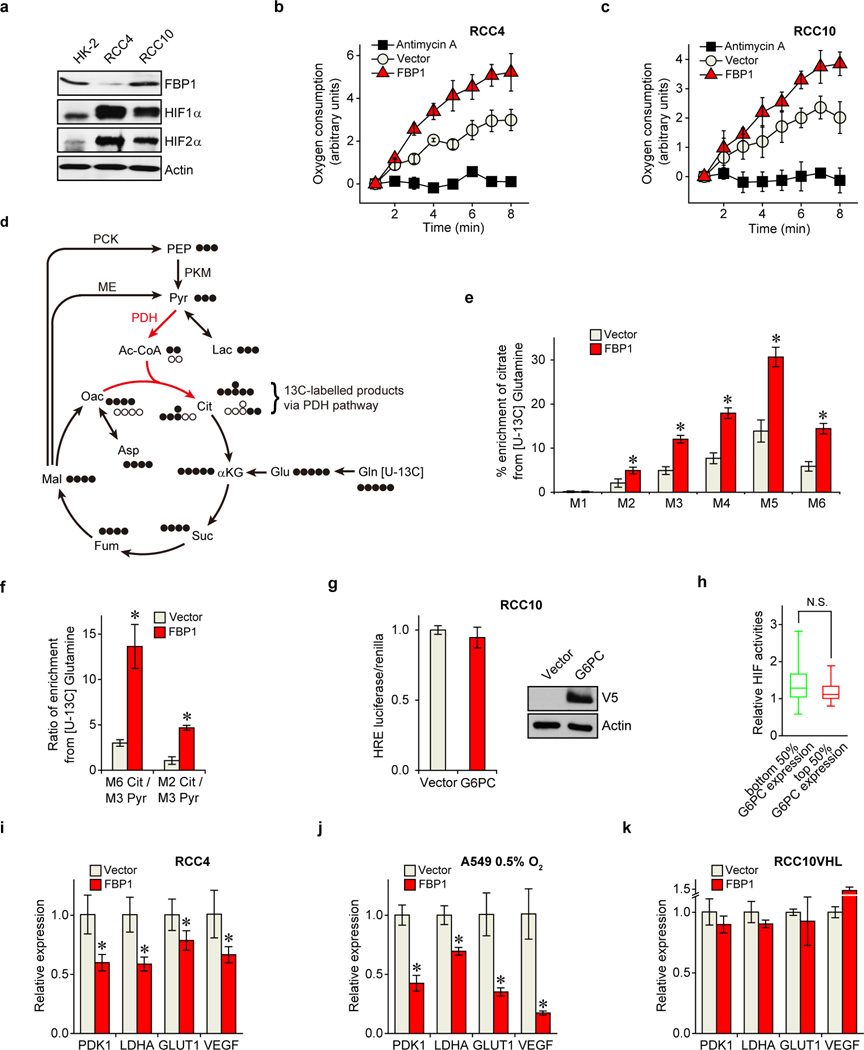
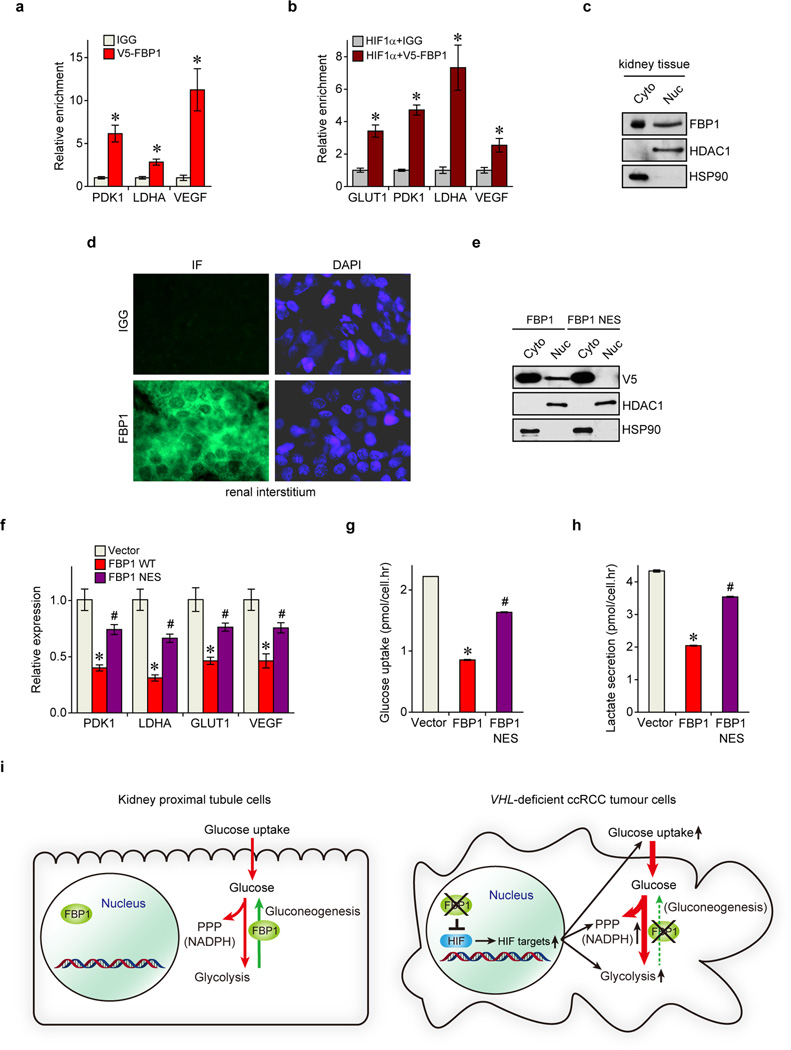
To investigate a mechanistic link between FBP1 expression and HIF activity, we employed two VHL-deficient ccRCC lines, RCC4 and RCC10, which express both HIF1α and HIF2α (Extended Data Fig. 6a). HIF1α and HIF2α are induced at different stages of ccRCC and play cooperating and contrasting roles in tumour progression3. HIF1α and HIF2α function by binding hypoxia response elements (HREs) within target genes, including those modulating cellular metabolism20. Interestingly, ectopic FBP1 expression suppressed HIF activity (Fig. 3a) and promoted oxygen consumption in RCC4 and RCC10 cells (Extended Data Fig. 6b–c). Furthermore, FBP1 expression in RCC10 cells restored PDH activity (Extended Data Fig. 6d–f), which was otherwise inhibited by HIF1α3. Conversely, FBP1 ablation enhanced HIF activity in RCC10 cells, which express detectable levels of FBP1 (Fig. 3a and Extended Data Fig. 6a). This inverse correlation between FBP1 expression and HIF activity was recapitulated in primary ccRCC tumours (Fig. 3b). In contrast, G6PC expression did not correlate with HIF activity in ccRCC cells or tumour tissues (Extended Data Fig. 6g–h). Interestingly, FBP1 also inhibited HIF activity in A549 lung cancer cells cultured at 0.5% O2 (Fig. 3c), demonstrating that this effect is not specific to renal cells. Moreover, FBP1 expression reduced canonical HIF target (PDK1, LDHA, glucose transporter 1 [GLUT1, also known as SLC2A1], and vascular endothelial growth factor [VEGF]) mRNA levels in RCC4, RCC10, and hypoxic A549 cells, but not in normoxic RCC10VHL cells (Fig. 3d and Extended Data Fig. 6i–k). Chromatin Immunoprecipitation (ChIP) analyses indicated that FBP1 was enriched at the HREs of PDK1, LDHA, GLUT1, and VEGF promoters, but not in the non-hypoxia responsive ribosomal protein L13A (RPL13A) promoter (Fig. 3e and Extended Data Fig. 7a). ChIP-reChIP analyses revealed co-localization of HIF1α and FBP1 at these HREs (Extended Data Fig. 7b), suggesting that FBP1 directly inhibits HIF in the nucleus, a conclusion supported by cellular fractionation and immunofluorescent staining of primary human kidney tissue (Fig. 3f and Extended Data Fig. 7c–d). Furthermore, a nucleus-excluded form of FBP1 (FBP1 NES) containing a potent nuclear export sequence21 fused to the FBP1 C-terminus (Extended Data Fig. 7e) failed to inhibit HIF target gene expression as efficiently as wild-type FBP1 (Extended Data Fig. 7f). Expression of FBP1 NES neither suppressed RCC10 cell growth nor altered glucose-lactate turnover, in contrast to wild-type FBP1 (Fig. 3g and Extended Data Fig. 7g–h). Collectively, these data demonstrated that nuclear FBP1 is required for inhibiting HIF and glucose metabolism in VHL–deficient ccRCC cells (Extended Data Fig. 7i).
Figure 3. FBP1 inhibits HIF activity in the nucleus.
a, HIF reporter activity measured in RCC4 and RCC10 cells transfected with pHRE-luciferase, in the presence of vector, FBP1 cDNA, or two different FBP1 shRNAs. Transfection efficiencies were normalized to co-transfected pRenilla-luciferase. b, 480 ccRCC tumours from the TCGA database were equally divided into two groups (top and bottom 50% FBP1 expression) based on FBP1 expression levels, and their relative HIF activities were quantified and plotted as described in Methods. c, HIF reporter activity in hypoxic RCC4 and A549 cells (0.5% O2) with or without ectopic FBP1 expression. d, qRT-PCR analysis of HIF target genes in RCC10 cells expressing vector or FBP1. e, ChIP assays evaluating the chromatin binding of FBP1 to HREs in the GLUT1 promoter, or to a non-hypoxia responsive region of the RPL13A locus. RNA Polymerase II antibody was used as a positive control. f, Immunofluorescent staining of primary human kidney tissue (tubular region) with FBP1 antibody. Arrows point to three representative sites with nuclear FBP1. Rabbit IgG was used as a negative control, and DAPI is a fluorescent nuclear dye. g, Growth of RCC10 cells expressing vector, FBP1, or FBP1 NES (FBP1 linked to a C-terminal nuclear export sequence) cultured in 1% serum. Error bars represent s.d. (three experimental replicates) except in (e), which indicates s.e.m. (three technical replicates from a representative experiment). *p<0.05.
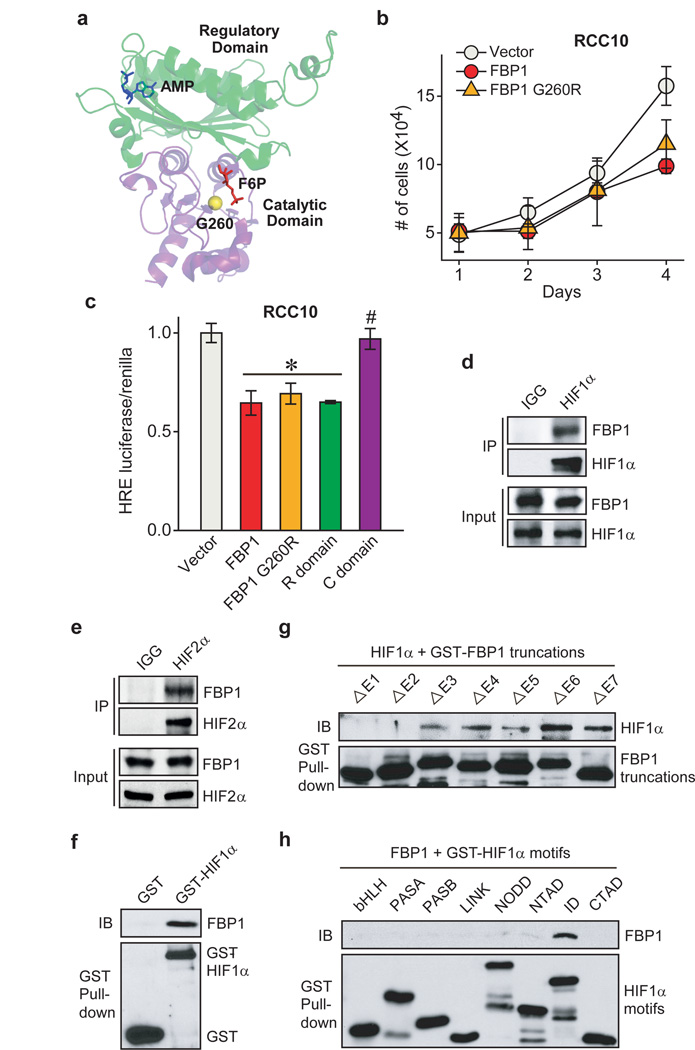
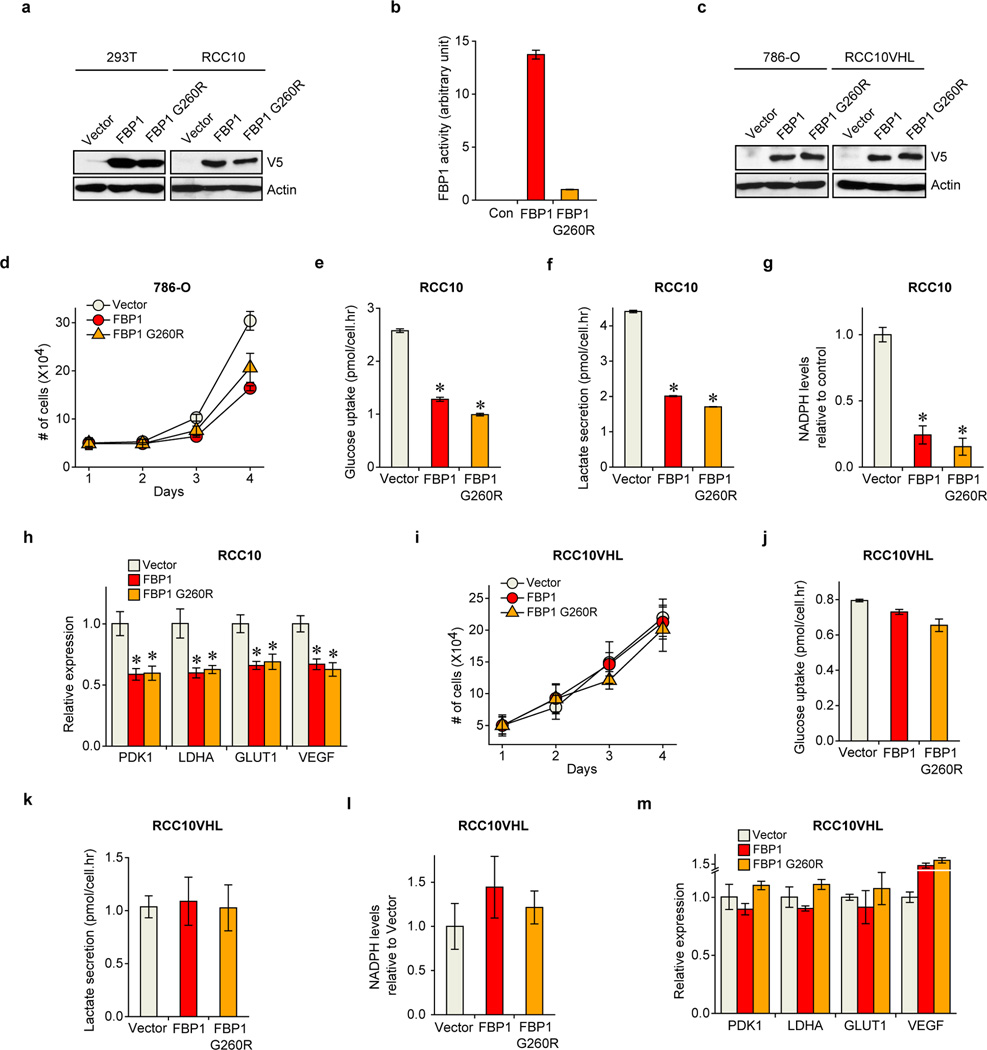
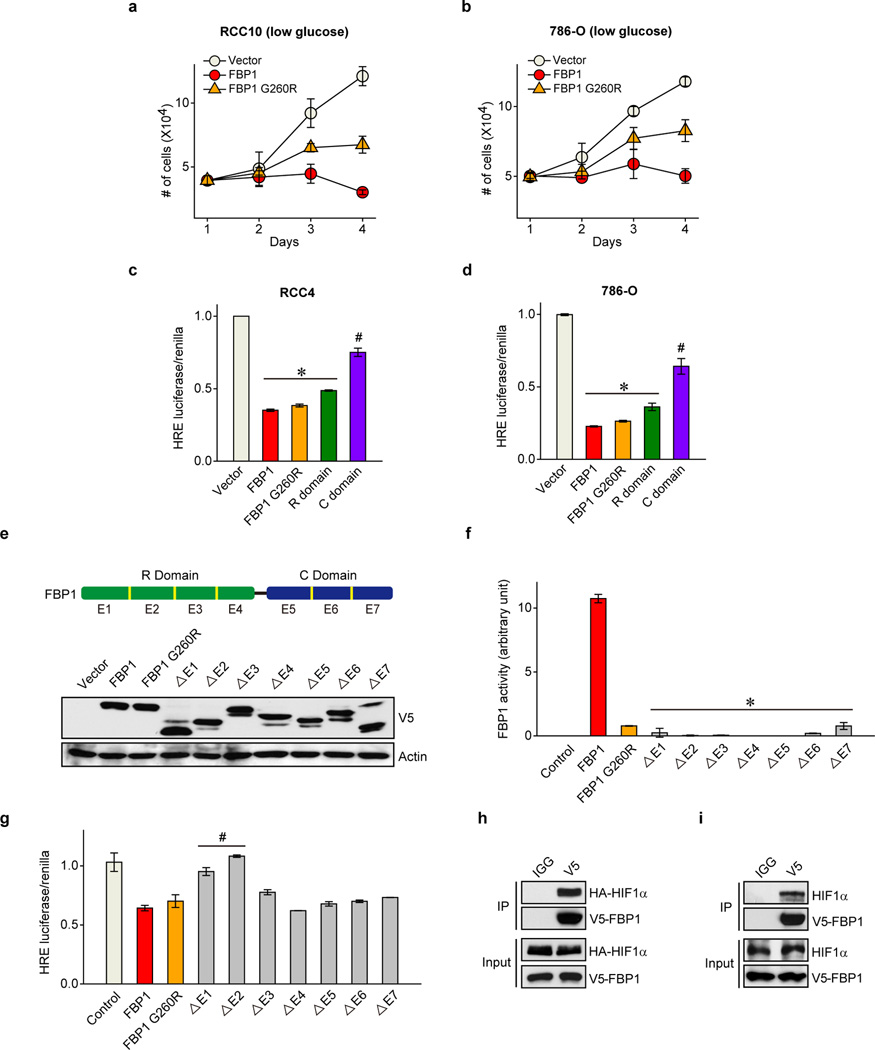
To determine whether FBP1 enzymatic activity is required to inhibit HIF, we expressed a previously described, catalytically inactive FBP1 G260R mutant22,23 (Fig. 4a and Extended Data Fig. 8a–b) in RCC10 and 786-O cells (Extended Data Fig. 8a and 8c). FBP1 G260R inhibited cell growth to a comparable level of wild-type FBP1 at 10 mM glucose (Fig. 4b and Extended Data Fig. 8d). FBP1 also inhibited glucose metabolism, NADPH production, and HIF target gene expression to the same extent of wild-type FBP1 in RCC10 cells (Extended Data Fig. 8e–h). These results suggest that FBP1 interferes with HIF function through a catalytic activity-independent mechanism. In normoxic RCC10VHL cells (low HIF activity), the ability of the FBP1 G260R mutant to inhibit cell growth, glucose metabolism, NADPH production, and HIF target gene expression was abolished (Extended Data Fig. 8c and 8i–m), further confirming that FBP1 impacts ccRCC cell metabolism and growth by regulating HIF, independent of its enzymatic activity. Nevertheless, wild-type FBP1 suppressed RCC10 and 786-O (Extended Data Fig. 9a–b) cell growth more potently than the G260R mutant under low glucose conditions, presumably because the enzymatic inhibition of glycolysis by wild-type FBP1 is more profound when glucose supply becomes limited.
Figure 4. FBP1 inhibits HIF independent of its enzymatic activity, through direct interaction with a HIFα “inhibitory domain”.
a, Crystal structure (PDB ID: 1EYJ) of porcine FBP1 in complex with AMP (blue) and fructose 6-phosphate (F6P, red). The N-terminal regulatory domain of FBP1 is coloured in green, and the C-terminal catalytic domain is coloured in violet. The G260 residue is highlighted in yellow. b, Growth of RCC10 cells ectopically expressing vector, FBP1, or FBP1 G260R in 1% serum medium. c, HIF reporter activity in RCC10 cells expressing vector, FBP1, FBP1 G260R, the regulatory domain of FBP1 (“R” domain), and catalytic domain of FBP1 (“C” domain). RCC10 cell lysates were immunoprecipitated with IgG, HIF1α antibody (d), or HIF2α antibody (e) and blotted for endogenous FBP1. f, GST pull-down analysis between recombinant FBP1 and recombinant GST or GST-tagged HIF1α. IB: immunoblot. g, GST pull-down analysis between recombinant HIF1α and recombinant GST-tagged, FBP1 exon truncations. h, GST pull-down analysis between recombinant FBP1 and GST-tagged HIF1α motifs. Values represent mean±s.d. (three experimental replicates). *p<0.01.
To explore the molecular mechanism(s) whereby FBP1 inhibits HIF activity, we separated the FBP1 protein into an N-terminal regulatory (“R”) domain containing allosteric regulatory sites and a C-terminal (“C”) domain containing the catalytic site (Fig. 4a). Interestingly, ectopically expressing the FBP1 “R” domain in RCC10, RCC4, and 786-O cells was sufficient to inhibit HIF activity, whereas expressing the “C” domain was not (Fig. 4c and Extended Data Fig. 9c–d). As 786-O cells express HIF2α but not functional HIF1α24, we conclude that FBP1 inhibits both HIF1α and HIF2α, presumably through a similar mechanism. To further map critical FBP1 regions for HIF recognition, we systematically deleted each exon from full-length FBP1 (Extended Data Fig. 9e). All seven FBP1 truncations exhibited minimal catalytic activity (Extended Data Fig. 9f), whereas only the N-terminal Exon 1 and Exon 2 truncations significantly lost their ability to inhibit HIF (Extended Data Fig. 9g).
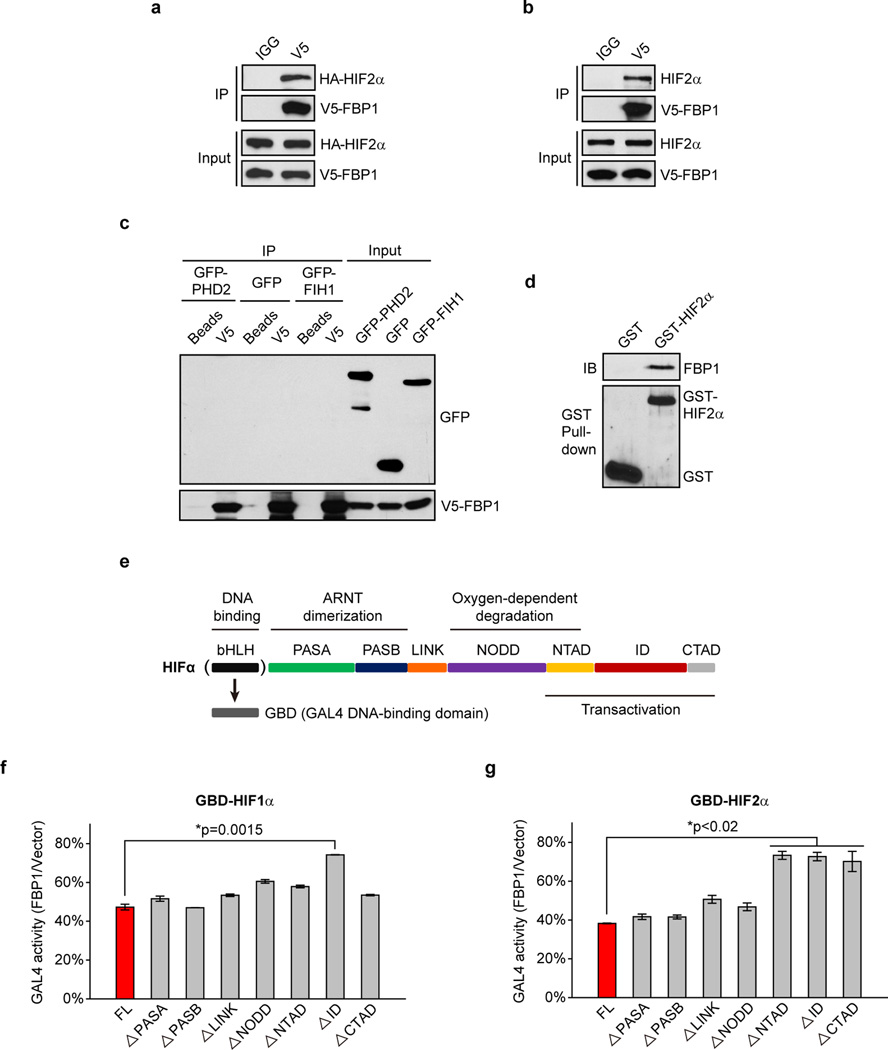
We further demonstrated the association of FBP1 and HIF1α by co-immunoprecipitating epitope-tagged and/or endogenous proteins from 293T or RCC10 cell lysates (Fig. 4d and Extended Data Fig. 9h–i). FBP1 also associated with HIF2α (Fig. 4e and Extended Data Fig. 10a–b), but not with PHD2 or FIH1, two well-documented HIFα regulators3 (Extended Data Fig. 10c). Interestingly, GST pull-down assays revealed that HIF1α or HIF2α proteins bound directly to full-length FBP1 (Fig. 4f and Extended Data Fig. 10d), and the interaction between HIF1α and FBP1 is dependent on FBP1 Exon 1 or Exon 2 (Fig. 4g). Furthermore, FBP1 associates with the relatively uncharacterized HIF “inhibitory domain” (ID)25 (Fig. 4h and Extended Data Fig. 10e). To examine whether FBP1 inhibits HIF activity through ID recognition, we replaced the HIFα DNA binding domain with a GAL4 DNA binding domain (GBD) and performed GAL4 transactivation assays (Extended Data Fig. 10e) (see Methods for details). Consistent with HIF reporter assays (Fig. 3a, 3c, 4c and Extended Data Fig. 9g), FBP1 suppressed full-length HIF1α-GBD activity by approximately 50% (Extended Data Fig. 10f, red column). Importantly, removal of the HIF1α ID largely relieved the FBP1 inhibitory effect (Extended Data Fig. 10f). In HIF2α, the critical region mediating FBP1 inhibition extended to the entire C-terminus (Extended Data Fig. 10g). Therefore, FBP1 suppresses HIF1α and HIF2α activity by interacting with their C-terminal regions, especially the ID motif.
Apart from VHL loss, ccRCCs exhibit remarkable genetic heterogeneity26. Recent large-scale analyses identified frequent mutations in three epigenetic genes PBRM1, SETD2, and BAP1, all of which reside in a 43 Mb region on chromosome 3p that encompasses VHL6–9. Histologically, ccRCC is characterized by the “clear cell” phenotype resulting from glycogen and lipid accumulation2, suggesting that metabolic perturbations are a defining feature of these tumours. Here we demonstrate that the gluconeogenic enzyme FBP1 is ubiquitously depleted in ccRCCs, consistent with our previous copy number analyses27. Moreover, FBP1 exhibits dual tumour-suppressive functions mediated by two separate domains, explaining the universal loss of FBP1 expression in ccRCC tumours. Collectively, our data reveal an intriguing regulatory relationship between FBP1 and hypoxic responses in renal carcinoma, which has implications for the metabolic regulation of all gluconeogenic tissues (Supplementary Discussion).
Methods
Antibodies and reagents
Antibodies detecting HDAC1 (5356), HSP90 (4877), GST (2625), HA (3724), and normal IgG isotopic controls (rabbit-2729, mouse-5415) were purchased from Cell Signaling Technology. Antibodies detecting HIF1α (NB100-134) and HIF2α (NB100-122) were obtained from Novus, and antibodies against PCK1 (ab28455), G6PC (ab83690), and PFKL (ab37583) were from Abcam. D-fructose-1, 6-bisphosphate trisodium salt (47810), 2-hydroxyethyl agarose (A4018), and antibodies detecting FBP1 (SAB1405798 and HPA005857) were purchased from Sigma.
Cell culture
786-O, RCC4, RCC10, 769-P, A549 and 293T cells were tested to confirm they are mycoplasma negative, and cultured in DMEM containing 10% FBS and antibiotics. HK-2 proximal tubular epithelial cells were cultured in Keratinocyte-SFM medium supplemented with human recombinant epidermal growth factor 1–53 and bovine pituitary extract (Life Technologies). Hypoxic conditions (0.5% O2) were achieved in a Ruskinn in vivO2 400 workstation, by supplementing ambient air with balanced N2 and CO2. For metabolic labelling assays, cells were maintained in glucose-free DMEM (Life Technologies) supplemented with 10% dialyzed FBS (Gemini Bio Products) and 10 mM [1, 2-13C] glucose (Cambridge isotope), or glutamine-free DMEM (Life Technologies) supplemented with 10% dialyzed FBS and 2 mM [U-13C] glutamine (Cambridge isotope).
Constructs
An HRE (hypoxia response element) reporter construct was generated by introducing triplicate HRE motifs derived from the human PGK1 promoter in front of a luciferase expression cassette in the pGL2-TK vector. ShRNA plasmids targeting human FBP1, G6PC and HIF1A mRNAs were purchased from Open Biosystems. The antisense short-hairpin sequences against human FBP1 are 5’-ATGTTGGAAGATCCATCAAGG-3’ (SH-1) and 5’-AACATGTTCATAACCAGGTCG-3’ (SH-2). The antisense sequence against human G6PC is 5’- TTCAAGGAGTCAAAGACGTGC-3’, and sequences against human HIF1A is 5’-TAACTTCACAATCATAACTGG-3’ (SH-1) and 5’-ATTCGGTAATTCTTTCATCAC-3’ (SH-2). FBP1, G6PC, and PFKL expression plasmids were constructed by cloning the open reading frame of each cDNA into the multiple cloning site of PCDNA3.1-V5 vector. The FBP1 G260R mutant was generated using Stratagene's QuikChange II mutagenesis Kit (Agilent). FBP1 NES was generated by linking an efficient nuclear export sequence (LALKLAGLDIGS) to the FBP1 C-terminus of its expression cassette. FBP1 exon truncations were generated by subcloning the following coding regions from full-length FBP1 (1–338): ΔE1 (58–338), ΔE2 (1–57, 112–338), ΔE3 (1–111, 143–338), ΔE4 (1–142, 189–338), ΔE5 (1–188, 236–338), ΔE6 (1–235, 276–338), ΔE7 (1–275). Full-length FBP1, HIF1α, and HIF2α were cloned into the pGEX-6P-1 vector to create GST-tagged protein constructs. Various GST-tagged HIF1α motifs were generated by subcloning the following regions from full-length HIF1α (1–826) into the pGEX-6P-1 vector: bHLH (1–80), PASA (81–235), PASB (236–329), LINK (330–392), NODD (393–531), NTAD (532–603), ID (604–786), CTAD (787–826). For GAL4 transactivation assays, HIFα sequences lacking the bHLH DNA binding motif were cloned into the pBIND vector (Promega), which is in frame with a GAL4 DNA binding domain (GBD) at the N-terminus. A series of GBD-HIF1α truncations were created by removing indicated HIF1α motifs. Similarly, GBD-HIF2α truncations were generated by individually deleting the following motifs from HIF2α sequences (1–870): PASA (80–236), PASB (237–331), LINK (332–395), NODD (396–495), NTAD (496–581), ID (582–830), CTAD (831–870). GFP-FIH1 and GFP-PHD2 constructs were obtained from Dr. Eric Metzen via Addgene.
Plasmid transfection and virus infection
Expression constructs were transfected into cancer cell lines using Lipofectamine LTX reagent (Life Technologies) by following the manufacturer’s protocol. Lentivirus was produced by co-transfecting 293T cells with pRSV-Rev, pMD2.G, pMDLg/pRRE, and pLKO.1-puro shRNA or pCDH-puro expression vectors. Virus was harvested after 48 hours by filtering the virus-containing medium through 0.45 µM Steriflip filter (Millipore). Virus infection was performed by incubating cells with medium containing indicated virus and 8 µg/mL polybrene (Sigma) for 24 hours. Cells were allowed to recover in complete medium for 24 hours and then selected with puromycin for 24 hours (mRNA analysis) or 48 hours (protein and phenotypic analyses). Surviving pools were subjected to indicated experiments. Note that HK-2 cells undergoing virus infection and puromycin selection typically need 10–14 days recovery time before subjected to experiments.
TCGA RNAseq analysis
Raw RNAseq data for 480 ccRCC tumour and 69 normal kidney tissues were downloaded from the TCGA ccRCC project (http://cancergenome.nih.gov) on April 2, 2013. Data was analysed for differential gene expression using DeSeq (Bioconductor Version 2.12). Normalized counts, p-values, false discovery rate-adjusted p values (p-adj), and fold expression change for each gene were exported. To perform the gene set analysis, a comprehensive list of 2,752 genes encoding all known human metabolic enzymes and transporters were clustered into functional sets according to the metabolic pathways annotated by KEGG (http://www.genome.jp/kegg/). The cut-off value of p-adj was set to 0.1 to exclude genes not consistently detected by RNAseq. To examine tumour-associated HIF activities, raw data of each sequenced gene were rescaled to set the median equal to 1, and HIF activities were quantified by averaging the normalized expression of 44 HIF target genes including those encoding IGFBP3, EDN2, PFKFB4, FLT1, TFR2, BNIP3L, TGFA, BNIP3, PGK1, EGLN1, LDHA, EGLN3, CP, TGFB3, PFKFB3, HK1, TFRC, EDN1, CDKN1A, CA9, ADM1, HMOX1, SERPINE1, LOX, NDRG1, CA12, PDK1, VEGFA, ERO1L, RORA, P4HA1, MXI1, SLC2A1(GLUT1), STC2, MIF, DDIT4, ENO1, CXCR4, PLOD1, P4HA2, GAPDH, PGAM1, TMEM45A, and PIM128.
Metabolites quantification
The rate of glucose uptake and lactate secretion was determined using a YSI 7100 Multiparameter Bioanalytical System (YSI Life Sciences). NAPDH levels were measured using NADP+/NADPH Quantification Kit (BioVision) by following the manufacturer’s protocol. Glucose 6-phosphate (G6P) levels were determined using PicoProb G6P Fluorometric Assay Kit (BioVision) by following the manufacturer’s protocol. Absolute NADPH or G6P levels were normalized to vector control cells by set the vector control levels equal to 1. Pan-metabolomic analysis was performed on 20 primary ccRCC tumours and 20 adjacent normal kidney tissues (obtained from Cooperative Human Tissue Network) with the assistance of Metabolon. Specifically, sample preparation was carried out using the automated MicroLab STAR® system (Hamilton). Standards were added prior to the first extraction step for quality control purposes. Metabolite extracts were divided into two fractions; one fraction was analysed by a gas chromatography – mass spectrometer (GC-MS) and the other by liquid chromatography - tandem mass spectrometry (LC-MS/MS). Samples for GC-MS analysis were dried under vacuum desiccation for 24 hours prior to derivatization under nitrogen with bistrimethyl-silyl-triflouroacetamide (BSTFA) treatment. The GC column was 5% phenyl and the temperature ramp was from 40 to 300 °C in a 16-minute period. Samples were analysed by a Thermo-Finnigan Trace DSQ fast-scanning single-quadrupole mass spectrometer using electron impact ionization. The LC-MS/MS portion of this analysis was based on a Waters ACQUITY UPLC and a Thermo-Finnigan LTQ mass spectrometer, which consists of an electrospray ionization (ESI) source and linear ion-trap (LIT) mass analyser. Sample extracts were split into two aliquots, dried, and reconstituted separately in acidic or basic solvents. One aliquot was analysed in acidic positive ion optimized conditions and the other in basic negative ion optimized conditions using dedicated columns. Extracts reconstituted in acidic conditions were gradient eluted using water and methanol containing 0.1% formic acid, while the basic extracts were eluted using water and methanol containing 6.5 mM ammonium bicarbonate. The MS analysis alternated between MS and MS/MS scans using dynamic exclusion. Compounds were identified by comparison to an in-house metabolomic library with purified standards. More than 3000 commercially-available standard compounds have been registered for determination of their analytical characteristics. The combination of chromatographic properties and mass spectra gave an indication of a match to a specific compound or an isobaric entity. For studies spanning multiple days, a data normalization step was included to correct variation resulted from instrumental tuning differences. To generate the end report, raw data of each metabolite were rescaled to set the median equal to 1. For pair-wise comparison of pentose phosphate pathway-related metabolites, Welch’s t-tests were performed. A q-value is also reported to describe the false discovery rate in multiple testing.
13C-metabolic flux analysis
To measure the 13C enrichment in TCA cycle intermediates, [1, 2-13C] glucose-labelled (48 hours at 37 °C) or [U-13C] glutamine-labelled cells (3 hours at 37 °C) were extracted by 4% perchloric acid (PCA) as previously described29. Briefly, cells were washed twice with PBS and then incubated with 4% PCA for 30 min at 4 °C on a rocking platform. Cell extracts were collected and neutralized using 5M KOH. After centrifugation, supernatants were subjected to an AG-1 column (100–200 mesh, 0.5 × 2.5 cm, Bio-rad) for enriching the organic acids, glutamate, and aspartate, which were then converted to t-butyldimethylsilyl derivatives. Isotopic enrichment in 13C glutamate isotopomers was monitored using ions at m/z 432, 433, 434, 435, 436 and 437 for M0, M1, M2, M3, M4 or M5 (containing 1 to 5 13C atoms above M0, the natural abundance), respectively. Isotopic enrichment in 13C aspartate isotopomers was monitored using ions at m/z 418, 419, 420, 421 and 422 for M0, M1, M2, M3 and M4 (containing 1 to 4 13C atoms above M0, the natural abundance), respectively. Isotopic enrichment in 13C lactate was determined using ions at m/z 261, 262, 263 and 264 for M0, M1, M2 and M3 (containing 1 to 3 13C atoms above natural abundance), respectively. Isotopic enrichment in 13C pyruvate isotopomers was monitored using ions at m/z 259, 260, 261and 262 for M0, M1, M2 and M3 (containing 1 to 3 13C atoms above natural abundance), respectively. Isotopic enrichment in 13C malate isotopomers was evaluated using ions at m/z 419, 420, 421, 422 and 423 for M0, M1, M2, M3 and M4 (containing 1 to 4 13C atoms above natural abundance), respectively, and 13C enrichment in 13C citrate isotopomers was assayed using ions at m/z 459, 460, 461, 462, 463, 464 and 465 for M0, M1, M2, M3, M4, M5 and M6 (containing 1 to 6 13C atoms above natural abundance), respectively. Isotopic enrichment in 13C ribose 5-phosphate isotopomers was determined using a LC-MS system as previously described29. For ribose in MRM mode, we measured ion-pairs 561-175, 562-175, 563-175, 564-175, 565-175 and 566-175 for determination of M0, M1, M2, M3, M4 and M5, respectively (containing 1 to 5 13C atoms above natural abundance).
Quantification of the pentose phosphate pathway
Metabolic flux going through the pentose phosphate pathway (PPP) was quantified based on a previously-described method30, using [1, 2-13C] glucose as the labelling tracer. Briefly, direct glycolysis of [1, 2-13C] glucose (without going through the PPP) produces M2 labelled lactate, while flux going through the oxidative portion of PPP removes the first carbon from glucose and releases it in the form of CO2. The resultant M1 labelled intermediates are recycled back to glycolysis to produce M1 labelled lactate through the non-oxidative potion of PPP. The ratio of M1 to M2 labelled lactate indicates the ratio of flux going through the PPP versus flux directly going through glycolysis. Therefore, PPP flux was calculated based on the following formula: PPP flux = glucose consumption rate (measured by YSI analyser as described above) × M1 lactate enrichment / (M1 lactate enrichment + M2 lactate enrichment). Calculated PPP flux was then normalized to vector control cells by setting the vector control flux equal to 1. An important assumption for this model is that most PPP-generated M1 intermediates are recycled back to glycolysis, rather than exported for nucleotide synthesis30. We have measured the isotopic distribution of ribose 5-phosphate using LC-MS and found that the enrichment of M1 labelled ribose 5-phosphate was undetectable, confirming that most M1 labelled intermediates generated in PPP were recycled back to glycolysis.
Cell growth assay
Multiple cultures of ccRCC or A549 cells were plated in 6-well dishes at a density of 5×10⁴ cells/well supplemented with DMEM containing 1% FBS. For growth assays performed in low glucose conditions, cells were maintained in glucose-free DMEM supplemented with 10% dialyzed FBS and 1 mM glucose. Each day one set of cultures was collected and counted.
Anchorage-independent growth assay
786-O cells stably expressing vector control or FBP1 were plated at a density of 6×10³ cells/ml in complete medium containing 0.3% agarose, onto underlays composed of medium containing 0.6% agarose. Cultures were fed every week, and after three weeks of growth the colonies were quantified.
Immunoprecipitation and Western blot analysis
Cells were lysed with mammalian cell lysis buffer consisting of 25 mM Tris, 100 mM NaCl, 1% Triton X-100, 1 mM EDTA, 1 mM DTT, 1 mM NaVO4, 1 mM β-glycerol phosphate, and protease inhibitor cocktail (Roche Diagnostics). For immunoprecipitation experiments, cells were harvested in lysis buffer containing 0.3% CHAPS instead of 1% Triton X-100 as the detergent. 2 mg whole cell lysates were pre-cleared with 30 µL protein G beads (Life Technologies), and then incubated with 2 µg isotype-matched IgG control or indicated antibodies for 2 hours on a rocking platform. 50 µL protein G beads were added and mixed for another 2 hours. The immunoprecipitates were collected by centrifugation and then resolved by SDS-PAGE. Separated proteins were transferred to nitrocellulose membranes and the filters incubated with indicated primary antibodies diluted in TBST (20 mM Tris, 135 mM NaCl, and 0.02% Tween 20) supplemented with 5% bovine serum albumin (Sigma). Primary antibodies were detected with horseradish peroxidase-conjugated secondary antibodies (Cell Signaling Technology) followed by exposure to ECL reagents (Pierce).
Quantitative RT-PCR
Total RNA was isolated from cells using RNAeasy purification kit (Qiagen). cDNA was synthesized using a High Capacity RNA-to-cDNA Master Mix from Applied Biosystems. qRT-PCR analysis was performed using TaqMan Universal PCR regents mixed with indicated cDNAs and TaqMan primers in an ViiA7 Real-Time PCR system (Applied Biosystems). Pre-designed TaqMan primers were obtained from Applied Biosystems detecting the following genes: FBP1 (ID: Hs00983323_m1), HIF1A (ID: Hs00153153_m1), PDK1 (ID: Hs01561850_m1), LDHA (ID: Hs00855332_g1), GLUT1 (SLC2A1, ID: Hs00892681_m1), VEGF (VEGFA, ID: Hs00900055_m1), 18S (RN18S1, Hs03928985_g1).
Chromatin Immunoprecipitation (ChIP) and ChIP-reChIP assay
ChIP Assays were performed using Imgenex QuikChIP kit (Novus). Briefly, three million RCC10 cells stably expressing V5-FBP1 were cross-linked by 1% formaldehyde for 15 min at 37 °C. The cross-linking reaction was quenched by glycine and cells were lysed in SDS buffer containing protease inhibitor cocktail. Cell lysates were sonicated to shear chromatin DNA into fragments with 200–1,000 base pairs in size and then subjected to immunoprecipitation with 5 µg IgG (Cell Signaling Technology), V5 (Life Technologies), or Polymerase II (Imgenex) antibodies. After washing with a series of low salt and high salt washing buffers, immunoprecipitated DNA fragments were de-crosslinked at 65 °C in high salt condition, purified using QIAquick PCR purification kit (Qiagen), and then analysed by qRT-PCR. For ChIP-reChIP assays, the first ChIP was performed using HIF1α antibody (5 µg, Novus), until the washing steps. The immunoprecipitated protein-DNA complexes were incubated in ChIP-reChIP elution buffer (10 mM Tris, 1 mM EDTA, 2% SDS, and 20 mM DTT, PH 7.5) for 30 min at 37 °C. After centrifugation, the isolated supernatant was diluted at least 20 times and subjected to the second ChIP using 5 µg IgG or V5 antibodies. In both ChIP and ChIP-reChIP assays, qRT-PCR was performed using the following primers: PDK1-HRE: 5'-CGCGTTTGGATTCCGTG-3' and 5'-CCAGTTATAATCTGCCTTCCCTATTATC-3'; LDHA-HRE: 5'-TTGGAGGGCAGCACCTTACTTAGA-3' and 5'-GCCTTAAGTGGAACAGCTATGCTGAC-3'; GLUT1-HRE: 5'-CAAATGTGTGGATGTGAGTTGC-3' and 5'-CCATCACGGTCCTTCTTCATG-3'; VEGF-HRE: 5'-CAGGAACAAGGGCCTCTGTCT-3' and 5'-GCACTGTGGAGTCTGGCAAA-3'; RPL13A-nonHRE: 5'-GAGGCGAGGGTGATAGAG-3' and 5'-ACACACAAGGGTCCAATTC-3'.
Luciferase reporter and GAL4 transactivation assay
0.5 mg of HRE reporter construct was transfected into cells grown in 6-well plates together with 0.05 mg Renilla luciferase and 1 mg indicated expression or shRNA plasmids. Luciferase activities were measured 48 hours later using Dual Luciferase assay kit (Promega). Reporter luciferase activities were normalized to Renilla luciferase, and then rescaled to set the vector control signals equal to 1. In GAL4 transactivation assay, 0.3 mg GBD-HIFα construct (using pBIND vector as backbone) was transfected into 769-P (GBD-HIF1α) or A549 (GBD-HIF2α) cells together with 0.3 mg UAS (Upstream Activation Sequence)-luciferase reporter and 0.4 mg indicated expression plasmids. Luciferase activities were measured as described above. Transfection efficiencies were normalized to Renilla luciferase expressed from the pBIND backbone.
Subcellular fractionation
Cytosolic and nuclear fractionation of indicated cells and tissues were performed using NE-PER nuclear and cytoplasmic extraction reagents (Pierce) by following the manufacturer’s protocol.
Enzymatic activity assay
20 µg lysates of 293T cells expressing vector, FBP1, or FBP1 G260R were added to 100 µL reaction buffer containing 50 mM Tris, 10 mM MgCl2, and 100 µM D-fructose 1, 6-bisphosphate trisodium salt. The reaction was started by incubating solutions at 37 °C for 15 min and stopped by a deproteinization protocol using deproteinizing sample preparation kit (BioVision). FBP1 catalytic activity was quantified according to the yield of fructose 6-phosphate (enzymatic product), measured by using PicoProb fructose-6-phosphate fluorometric assay kit (BioVision).
Oxygen consumption assay
RCC4 or RCC10 cells ectopically expressing vector or FBP1 were seeded into black opaque 96-well plate at a density of 70, 000 cells per well. After attachment, culture medium within each well was replaced with 150 µL oxygenated fresh medium, supplemented with 10 µL MitoXpess probe solution (Cayman Chemical). Antimycin A was used as negative control. 100 µL mineral oil was dispensed to overlay each well, and the whole plate was monitored using SpectraMax m2e microplate reader (Molecular Devices) at 37 °C. Wavelengths are set to 380 nm for excitation and 650 nm for emission.
Protein purification
Constructs encoding indicated GST-tagged proteins were transformed into BL21-DE3 chemically competent E. coli (Life Technologies), grown in rocking LB media at 37 °C to an OD600 value of 0.8. Protein expression was induced by adding 1 mM IPTG (Denville Scientific) to the LB cultures, which were rocked at 37 °C for another 3 hours or at room temperature overnight. After centrifugation, collected bacterial pellets were resuspended in STE buffer (50 mM Tris, 150 mM NaCl, and 1 mM EDTA) supplemented with protease inhibitor cocktail (Sigma). GST-tagged proteins were further purified using the GST inclusion body solubilisation and renaturation kit (Cell Biolabs) by following the manufacturer’s protocol.
GST pull-down assay
Assay was performed using GST Protein Interaction Pull-Down Kit (Pierce) by following the manufacturer’s protocol. Breifly,100 µg indicated GST-tagged “bait” proteins were incubated with 50 µL prewashed glutathione agarose (Pierce) in 500 µL GST pull-down buffer (20 mM Tris, 150 mM NaCl, 2 mM MgCl2, 0.1% NP-40, and 20 µg/mL BSA) for 1 hour at 4 °C. Meanwhile, 50 µg indicated “prey” proteins was precleared with 50 µL prewashed glutathione agarose in 500 µL GST pull-down buffer for 1 hour at 4 °C. Precleared “prey” solutions were combined with the “bait-agarose” solutions and mixed for another 2 hours at 4 °C. Protein-bound agarose was washed 3 times and boiled in SDS sample buffer. Supernatants were subjected to SDS-PAGE and Western blot analysis.
Tissue immunohistochemistry and immunofluorescence
Normal kidney tissue sections (from Cooperative Human Tissue Network) and tissue microarray slides (KD801, KD208, BC07114, BC07115, LV804, LV208 from US Biomax) were deparaffinized by baking slides at 60 °C for 30 min. The slides were rehydrated in series of ethanol solutions and endogenous peroxidase activities were quenched by 3% H2O2 in distilled water for 30 min. After three washes in TT buffer (500 mM NaCl, 10 mM Trizma, and 0.05% Tween-20), antigen retrieval was performed by boiling slides for 20 min in a citrate-based antigen unmasking solution (Vector Labs). After cooling down to room temperature, slides were incubated with 4% normal goat serum in TT buffer for 1 hour, and then blocked with avidin and biotin solutions (avidin/biotin blocking Kit, Vector Labs). Next, tissue slides were incubated with various primary antibodies at 4°C overnight. After three washes in TT buffer, biotinylated secondary antibody was added onto these slides for 1 hour, following by 1 hour treatment of ABC reagents (Vectastain ABC Kit, Vector Labs). After three TT washes, the slides were processed with either chromogen (ImmPACT DAB Substrate, Vector Labs) and hematoxylin solutions for immunohistochemistry staining, or with Alexa Fluor 488 tyramide (TSA Kit #22, Life Technologies) for immunofluorescent experiments. Finally, slides were either dehydrated and mounted with paramount solution (for immunohistochemistry), or directly mounted with ProLong Gold antifade reagents (Life Technologies) supplemented with DAPI (for immunofluorescence).
Animal studies
Xenograft tumour experiments were approved by the Animal Care and Use Committee at the University of Pennsylvania. Briefly, five female NIH-III nude mice (Charles River, 4–6 weeks) were injected subcutaneously into both flanks with five million 786-O cells stably expressing vector or FBP1. Before each injection, cells were resuspended in 150 µL DMEM mixed with an equal volume of matrigel (BD Bioscience). Once palpable tumours were established, tumour size was measured once a week with a digital calliper. After four weeks mice were sacrificed by CO2 inhalation, and xenograft tumours were dissected and weighed. Randomization and blinding are not applicable in this experiment.
Human subjects
Primary human kidney samples were obtained from the Cooperative Human Tissue Network and handled at the University of Pennsylvania with the approval of its institutional review board committees. All tissues are collected with the donor being informed and given consent. Related procedures were performed in accordance with ethical and legal standards.
Survival analysis
Available patient survival data were obtained from the TCGA ccRCC project. Patients were ranked based on their tumour expressions of indicated genes shown in TCGA RNAseq data. The top half of ranked patients was defined as the “top 50% expression” group and the lower half was defined as the “bottom 50% expression” group. Kaplan-Meier survival analyses and log-rank significance tests were performed on these two patient groups accordingly.
Statistics
All results reported in main and extended data figures are presented as mean±s.d. unless otherwise specified. Data were reported as biological replicates except in qRT-PCR assays, where technical replicates from a representative experiment were used. Data beyond two standard deviations from the mean are treated as outliers. p values were calculated based on two-tailed, unpaired Student’s t-tests. p<0.05 was considered statistically significant.
Extended Data
Extended Data Figure 1. Pan-metabolomic analysis of ccRCC tumour and adjacent normal kidney tissues.
a, Heatmap showing the relative concentration of 418 metabolites detected in 20 primary ccRCC tumours and adjacent normal kidneys. Metabolites were extracted from frozen tissue samples and analysed by the Thermo-Finnigan GC-MS and LC-MS/MS systems. Raw data of each metabolite was rescaled to set the median equal to 1. All metabolites were clustered according to their related pathways (based on KEGG) and then plotted as a heatmap. b, Metabolic genes involved in “carbohydrate storage” differentially expressed in ccRCC tumour vs. normal tissue. G6PC, glucose-6-phosphatase, catalytic subunit; PCK1, phosphoenolpyruvate carboxykinase 1; FBP1, fructose-1, 6-bisphosphatase 1. c, Illustration of central carbon metabolism, including glycolysis, gluconeogenesis, pentose phosphate pathway, and the TCA cycle. Enzymes controlling glycolysis (HK, hexokinase; PFK, phosphofructokinase; PKM, pyruvate kinase type M) are highlighted in red, while enzymes controlling gluconeogenesis (G6P, glucose-6-phosphatase; FBP, fructose-1, 6-bisphosphatase; PCK, phosphoenolpyruvate carboxykinase) are highlighted in green. G6P, glucose 6-phosphate; F6P, fructose 6-phosphate; F-1, 6-BP, fructose 1, 6-bisphosphate; DHAP, dihydroxyacetone phosphate; GAP, glyceraldehyde 3-phosphate; R5P, ribose 5-phosphate; X5P, xylulose 5-phosphate; E4P, erythrose 4-phosphate; S7P, sedoheptulose 7-phosphate; PEP, phosphoenolpyruvate; Pyr, pyruvate; Ac-CoA, acetyl-CoA; Lac, lactate; Cit, citrate; αKG, alpha-ketoglutarate; Glu, glutamate; Suc, succinate; Fum, fumarate; Mal, malate; Oac, oxaloacetate; Asp, aspartate; G-SH, reduced glutathione.
Extended Data Figure 2. FBP1 protein expression is dramatically reduced in ccRCC tumours.
a, Quantification of the immunohistochemical (IHC) staining shown in Fig. 1(b). b, Microscopic evaluation of IHC staining of two representative ccRCC tumour and adjacent normal kidney tissues, with FBP1 antibody (brown) and hematoxylin counterstain (blue). c, Quantification of IHC staining of additional 170 ccRCC tumours and 23 normal kidney tissues with FBP1 antibody. d, Immunohistochemistry staining of a representative liver tissue microarray with FBP1 antibody. T: hepatocellular carcinoma (HCC) tissues; N: normal liver tissues. e, Quantification of IHC staining of 80 HCC tumours and 18 normal liver tissues with FBP1 antibody. f, Western blot analysis of indicated proteins in RCC4 cells with or without HIF1α inhibition. qRT-PCR of indicated genes (g) and Western blot analysis of indicated proteins (h) in HK-2 cells cultured under normoxia (21% O2) or hypoxia (0.5% O2) with or without HIF1α ablation. RT-PCR values represent mean±s.d. (three technical replicates from a representative experiment). *p<0.01.
Extended Data Figure 3. FBP1, but not PFKL, expression decreases in ccRCC tumours and correlates with tumour stages and patient prognosis.
IHC staining of the kidney tissue microarray as shown in Fig. 1(b) with G6PC (a), PCK1 (b), and PFKL (c) antibodies. T: ccRCC tumour; N: adjacent normal kidney. Quantification of each staining is shown on the right. d, Normalized RNASeq reads of PFKL in 69 normal kidneys and 480 ccRCC tumours grouped into Stage I-IV by TCGA. e, Kaplan-Meier survival curve of 429 ccRCC patients enrolled in the TCGA database. Patients were equally divided into two groups (top and bottom 50% PFKL expression) based on PFKL expression levels in their tumours.
Extended Data Figure 4. FBP1 expression affects cell proliferation.
a, Shown on the left is the western blot analysis of V5-tagged FBP1 and actin in 786-O cells ectopically expressing vector or V5-FBP1; On the right are protein levels of FBP1 and actin in HK-2 cells and 786-O cells with or without ectopic FBP1 expression. b, Anchorage-independent growth assay of 786-O cells expressing vector or V5-FBP1. c, Xenograft growth curves as performed in Fig. 1(f). Low serum growth curve of RCC10 (d) and 769-P (e) cells expressing vector or V5-FBP1. Western blot analyses confirming FBP1 expression are shown on the right. f, Growth of A549 lung cancer cells under normoxia (21% O2) or hypoxia (0.5% O2) cultured in low serum medium (1% FBS), with or without FBP1 expression. g, Protein levels of V5-FBP1 and actin in A549 lung cancer cells as indicated in (f). h, Western blot analysis confirming the effect of FBP1 ablation in HK-2 cells. Growth curves of HK-2 cells with G6PC inhibition (i) or V5-PFKL expression (j), as compared to vector control cells in 1% serum medium. Western blot analyses of indicated proteins are shown on the right. All values represent mean±s.d. (four technical replicates, from two independent experiments). *p<0.01.
Extended Data Figure 5. FBP1 regulates glycolysis, glutamine metabolism, and pentose phosphate pathway (PPP) in renal cells.
Glucose uptake (a) and lactate secretion (b) in HK-2 cells with or without FBP1 inhibition, cultured in medium containing 1 mM glucose. c, Carbon fate map showing the isotopomer distribution of indicated metabolites derived from [1, 2-13C] glucose. 13C atoms are depicted as filled circles. 13C atoms directly going through the glycolytic pathway are coloured in black, while 13C atoms going through the PPP and recycled back to glycolysis are coloured in red. d, Glutamine uptake in RCC10 cells ectopically expressing vector or FBP1. e, Carbon fate map showing the isotopomer distribution of indicated metabolites derived from [U-13C] glutamine. f, M4 isotopomer distribution of indicated metabolites in RCC10 cells expressing vector or FBP1, labelled with [U-13C] glutamine. % M4 enrichment represents the mole percent excess of M4 species above natural abundance. g, Fold changes of PPP-related metabolites detected in ccRCC tumours vs. adjacent normal kidney. Note that generation of reduced glutathione (G-SH) requires NADPH, a major reducing product of PPP. p value is calculated based on Welch’s paired t-test. q value is the estimation of false discovery rate in multiple testing. h, Relative NADPH levels in HK-2 cells with or without FBP1 inhibition. i, M1 and M2 isotopomer distribution of lactate in in HK-2 cells with or without FBP1 inhibition. j, Calculated PPP flux (relative to vector control) in HK-2 cells with or without FBP1 inhibition. M1 and M2 isotopomer distribution of lactate (k) and calculated PPP flux (l) in RCC10 cells expressing vector or FBP1. Relative glucose 6-phosphate (G6P) levels in HK-2 cells with or without FBP1 ablation (m), and in RCC10 cells expressing vector or FBP1 (n). o, Western blot analysis of indicated proteins in RCC10 and RCC10VHL cells ectopically expressing vector or FBP1. Experiments were performed in triplicates. Values represent mean±s.d. *p<0.05.
Extended Data Figure 6. FBP1 inhibits HIF and pseudohypoxia in ccRCC tumour cells.
a, Western blot analysis of indicated proteins in HK-2, RCC4, and RCC10 cells. Oxygen consumption in RCC4 (b) and RCC10 (c) cells expressing vector or FBP1 was measured using the MitoXpress dye as described in Methods. Antimycin A (an inhibitor of mitochondrial respiration) was used as negative control. d, Carbon fate map showing the isotopomer distribution of indicated metabolites derived from [U-13C] glutamine. Filled circles indicate 13C carbons derived from [U-13C] glutamine, whereas open circles represent carbons derived from endogenous sources. Note that by the PCK or ME pathway, M4 malate generates M3 pyruvate, which re-enters the TCA cycle through the PDH flux (coloured in red) to produce M6 or M2 citrate. ME, malic enzyme; PDH, pyruvate dehydrogenase. e, M1-M6 isotopomer distribution of citrate in RCC10 cells expressing vector or FBP1, labelled with [U-13C] glutamine. f, The enrichment ratio of M6 or M2 citrate to M3 pyruvate in RCC10 cells expressing vector or FBP1, labelled with [U-13C] glutamine. Note that this ratio is an indication of PDH activity. g, HIF reporter activity in RCC10 cells transfected with vector or V5-tagged G6PC. Protein levels of expressed V5-G6PC are shown on the right. h, 480 ccRCC tumours from TCGA database were equally divided into two groups (top and bottom 50% G6PC expression) based on G6PC expression levels, and their relative HIF activities were quantified and plotted as described in Methods. N.S., not significant. qRT-PCR analysis of HIF target genes in RCC4 (i), hypoxic A549 (j), or normoxic RCC10VHL (k) cells ectopically expressing vector or FBP1. Experiments were repeated twice. Values represent mean±s.d. (technical triplicates from a representative experiment) *p<0.05.
Extended Data Figure 7. Nuclear FBP1 co-localizes with HIF at HREs and inhibits HIF activity.
a, ChIP assays evaluating FBP1 chromatin binding to HREs in the PDK1, LDHA, and VEGF promoters. b, ChIP-reChIP analysis examining the co-localization of HIF1α and FBP1 at HREs in the GLUT1, PDK1, LDHA, and VEGF promoters. c, FBP1 protein levels detected in cytosolic and nuclear fractions of human kidney tissue. HDAC1, a nuclear protein, and HSP90, a cytosolic protein, reflect the purity of respective subcellular fractionations. d, Immunofluorescent staining of human kidney tissue (interstitial region) with FBP1 antibody. Rabbit IgG was used as a negative control, and DAPI is a fluorescent nuclear dye. e, Western blot analysis of V5-tagged FBP1 or FBP1 NES (FBP1 linked to a C-terminal nuclear export sequence) in the cytosolic and nuclear fractions of transfected RCC10 cells. f, qRT-PCR analysis of HIF target genes in RCC10 cells expressing vector, FBP1, or FBP1 NES. Glucose uptake (g) and lactate secretion (h) in RCC10 cells expressing vector, FBP1, or FBP1 NES. i, Models depicting the metabolic status of normal kidney proximal tubular epithelial cells (left), and VHL-deficient ccRCC tumour cells where FBP1 expression is inhibited (right). Error bars represent s.d. except in (a) and (b), which indicate s.e.m. Error bars were calculated based on three technical replicates from a representative experiment, and experiments were repeated twice to confirm the results. *p<0.05.
Extended Data Figure 8. FBP1 regulates glucose metabolism and HIF activity in a catalytic activity-independent manner.
a, Protein levels of ectopically expressed V5-FBP1 and V5-FBP1 G260R mutant in 293T and RCC10 cells. Actin was used as a loading control. b, FBP1 enzymatic activity in the 293T cell lysates as shown in (a). c, Western blot analysis of V5-tagged proteins and actin in 786-O and RCC10VHL cells ectopically expressing vector, V5-FBP1, and V5-FBP1 G260R. d, Growth of 786-O cells expressing vector, FBP1, or FBP1 G260R in 1% serum medium. Glucose uptake (e), lactate secretion (f), relative NADPH levels (g), and indicated HIF target gene expression (h) in RCC10 cells expressing vector, FBP1, or FBP1 G260R. i, Growth of RCC10VHL cells expressing vector, FBP1, or FBP1 G260R in 1% serum medium. Glucose uptake (j), lactate secretion (k), relative NADPH levels (l), and indicated HIF target gene expression (m) in RCC10VHL cells expressing vector, FBP1, or FBP1 G260R. Experiments were repeated twice. Values represent mean±s.d. (technical triplicates from a representative experiment) *p<0.01.
Extended Data Figure 9. FBP1 N-terminus is essential for HIF inhibition.
Growth of RCC10 (a) and 786-O (b) cells expressing vector, FBP1, or FBP1 G260R in medium containing 1 mM glucose. HIF reporter activity in RCC4 (c) and 786-O (d) cells ectopically expressing vector, FBP1, FBP1 G260R, FBP1 “R” domain, and FBP1 “C” domain. e, Western blot analysis of V5-tagged proteins and actin in 293T cells expressing vector, V5-FBP1, V5-FBP1 G260R, and indicated V5-FBP1 exon truncations. A schematic representation of FBP1 exons is shown above both blots. Note that the FBP1 “R” domain is encoded by exons 1 to 4, while the “C” domain by exons 5 to 7. f, FBP1 enzymatic activity in 293T cells expressing indicated constructs as shown in (e). g, HIF reporter activity in RCC10 cells expressing indicated constructs as shown in (e). h, Lysates of 293T cells expressing V5-FBP1 and HA-HIF1α (P402A/P564A double mutant) were immunoprecipitated with IgG or V5 antibody and blotted for HA. i, Lysates of RCC10 cells expressing V5-FBP1 were immunoprecipitated with IgG or V5 antibody and blotted for endogenous HIF1α. Experiments were repeated twice. Values represent mean±s.d. (technical triplicates from a representative experiment) *p<0.01.
Extended Data Figure 10. FBP1 directly interacts with HIFα C-terminus.
a, Lysates of 293T cells ectopically expressing V5-FBP1 and HA-HIF2α (P405A/P531A double mutant) were immunoprecipitated with IgG or V5 antibody and blotted for HA. b, Lysates of RCC10 cells expressing V5-FBP1 were immunoprecipitated with IgG or V5 antibody and blotted for endogenous HIF2α. c, Lysates of 293T cells expressing V5-FBP1 and GFP, GFP-PHD2, or GFP-FIH1 were immunoprecipitated with or without V5 antibody and blotted for GFP. d, GST pull-down analysis between recombinant FBP1 and recombinant GST or GST-tagged HIF2α. e, Schematic representation of HIFα structural motifs. Note that in GAL4 transactivation assays, the HIFα bHLH DNA-binding domain was replaced by a GAL4 DNA-binding domain (GBD). The ratio of GAL4 activity in the presence/absence of FBP1 (FBP1/Vector), measured in cells expressing indicated HIF1α (f) or HIF2α (g) truncations in which the HIF bHLH DNA-binding domain was replaced by a GAL4 DNA-binding domain (GBD). Transfection efficiencies were normalized to co-expressed pRenilla-luciferase. Values represent mean±s.d. (n=3, technical replicates). Experiments were repeated twice.
Supplementary Material
Acknowledgements
We thank Y. Daikhin, O. Horyn, and Ilana Nissim for assistance with the isotopomer enrichment analysis in the Metabolomic Core facility, Children's Hospital of Philadelphia. We also thank J. Tobias for help with processing the TCGA RNAseq data. This work was supported by the Howard Hughes Medical Institute, NIH Grant CA104838 to M.C.S. and DK053761 to I.N. M.C.S. is an Investigator of the Howard Hughes Medical Institute.
Footnotes
Supplementary Information is linked to the online version of the paper at www.nature.com/nature.
Author Contributions B.L., I.N., and M.C.S. designed this study. B.L., B.Q., D.L., Z.W., and J.O. performed the experiments. B.L., L.M., A.M., T.G., I.N., and M.C.S. analysed data. B.L., I.N., B.K., and M.C.S. wrote the paper.
The authors declare no competing financial interests.
References
- 1.Rini BI, Campbell SC, Escudier B. Renal cell carcinoma. Lancet. 2009;373:1119–1132. doi: 10.1016/S0140-6736(09)60229-4. [DOI] [PubMed] [Google Scholar]
- 2.Valera VA, Merino MJ. Misdiagnosis of clear cell renal cell carcinoma. Nat Rev Urol. 2011;8:321–333. doi: 10.1038/nrurol.2011.64. [DOI] [PubMed] [Google Scholar]
- 3.Keith B, Johnson RS, Simon MC. HIF1alpha and HIF2alpha: sibling rivalry in hypoxic tumour growth and progression. Nat. Rev. Cancer. 2012;12:9–22. doi: 10.1038/nrc3183. [DOI] [PMC free article] [PubMed] [Google Scholar]
- 4.Nickerson ML, et al. Improved identification of von Hippel-Lindau gene alterations in clear cell renal tumors. Clin. Cancer. Res. 2008;14:4726–4734. doi: 10.1158/1078-0432.CCR-07-4921. [DOI] [PMC free article] [PubMed] [Google Scholar]
- 5.Rankin EB, Tomaszewski JE, Haase VH. Renal cyst development in mice with conditional inactivation of the von Hippel-Lindau tumor suppressor. Cancer Res. 2006;66:2576–2583. doi: 10.1158/0008-5472.CAN-05-3241. [DOI] [PMC free article] [PubMed] [Google Scholar]
- 6.Sato Y, et al. Integrated molecular analysis of clear-cell renal cell carcinoma. Nat. Genet. 2013;45:860–867. doi: 10.1038/ng.2699. [DOI] [PubMed] [Google Scholar]
- 7.The Cancer Genome Atlas Research Network. Comprehensive molecular characterization of clear cell renal cell carcinoma. Nature. 2013;499:43–49. doi: 10.1038/nature12222. [DOI] [PMC free article] [PubMed] [Google Scholar]
- 8.Dalgliesh GL, et al. Systematic sequencing of renal carcinoma reveals inactivation of histone modifying genes. Nature. 2010;463:360–363. doi: 10.1038/nature08672. [DOI] [PMC free article] [PubMed] [Google Scholar]
- 9.Varela I, et al. Exome sequencing identifies frequent mutation of the SWI/SNF complex gene PBRM1 in renal carcinoma. Nature. 2011;469:539–542. doi: 10.1038/nature09639. [DOI] [PMC free article] [PubMed] [Google Scholar]
- 10.Tejwani GA. Regulation of fructose-bisphosphatase activity. Adv. Enzymol. Relat. Areas. Mol. Biol. 1983;54:121–194. doi: 10.1002/9780470122990.ch3. [DOI] [PubMed] [Google Scholar]
- 11.Moore LE, et al. Genomic copy number alterations in clear cell renal carcinoma: associations with case characteristics and mechanisms of VHL gene inactivation. Oncogenesis. 2012;1:e14. doi: 10.1038/oncsis.2012.14. [DOI] [PMC free article] [PubMed] [Google Scholar]
- 12.Cohen HT, McGovern FJ. Renal-cell carcinoma. N Engl J Med. 2005;353:2477–2490. doi: 10.1056/NEJMra043172. [DOI] [PubMed] [Google Scholar]
- 13.Vander Heiden MG, Cantley LC, Thompson CB. Understanding the Warburg effect: the metabolic requirements of cell proliferation. Science. 2009;324:1029–1033. doi: 10.1126/science.1160809. [DOI] [PMC free article] [PubMed] [Google Scholar]
- 14.DeBerardinis RJ, Thompson CB. Cellular metabolism and disease: what do metabolic outliers teach us? Cell. 2012;148:1132–1144. doi: 10.1016/j.cell.2012.02.032. [DOI] [PMC free article] [PubMed] [Google Scholar]
- 15.Hakimi AA, et al. Adverse outcomes in clear cell renal cell carcinoma with mutations of 3p21 epigenetic regulators BAP1 and SETD2: a report by MSKCC and the KIRC TCGA research network. Clin. Cancer. Res. 2013;19:3259–3267. doi: 10.1158/1078-0432.CCR-12-3886. [DOI] [PMC free article] [PubMed] [Google Scholar]
- 16.Possemato R, et al. Functional genomics reveal that the serine synthesis pathway is essential in breast cancer. Nature. 2011;476:346–350. doi: 10.1038/nature10350. [DOI] [PMC free article] [PubMed] [Google Scholar]
- 17.Gerich JE, Meyer C, Woerle HJ, Stumvoll M. Renal gluconeogenesis: its importance in human glucose homeostasis. Diabetes Care. 2001;24:382–391. doi: 10.2337/diacare.24.2.382. [DOI] [PubMed] [Google Scholar]
- 18.Metallo CM, et al. Reductive glutamine metabolism by IDH1 mediates lipogenesis under hypoxia. Nature. 2012;481:380–384. doi: 10.1038/nature10602. [DOI] [PMC free article] [PubMed] [Google Scholar]
- 19.Salway JG. Metabolism at a Glance. 3rd edn. Malden, Massachusetts, USA: Blackwell Pub.; 2004. [Google Scholar]
- 20.Majmundar AJ, Wong WJ, Simon MC. Hypoxia-inducible factors and the response to hypoxic stress. Mol. Cell. 2010;40:294–309. doi: 10.1016/j.molcel.2010.09.022. [DOI] [PMC free article] [PubMed] [Google Scholar]
- 21.Wen W, Meinkoth JL, Tsien RY, Taylor SS. Identification of a signal for rapid export of proteins from the nucleus. Cell. 1995;82:463–473. doi: 10.1016/0092-8674(95)90435-2. [DOI] [PubMed] [Google Scholar]
- 22.Asberg C, et al. Fructose 1,6-bisphosphatase deficiency: enzyme and mutation analysis performed on calcitriol-stimulated monocytes with a note on long-term prognosis. J Inherit Metab Dis. 2010;33(Suppl 3):S113–S121. doi: 10.1007/s10545-009-9034-5. [DOI] [PubMed] [Google Scholar]
- 23.Choe JY, Fromm HJ, Honzatko RB. Crystal structures of fructose 1,6-bisphosphatase: mechanism of catalysis and allosteric inhibition revealed in product complexes. Biochemistry. 2000;39:8565–8574. doi: 10.1021/bi000574g. [DOI] [PubMed] [Google Scholar]
- 24.Shen C, et al. Genetic and functional studies implicate HIF1alpha as a 14q kidney cancer suppressor gene. Cancer Discov. 2011;1:222–235. doi: 10.1158/2159-8290.CD-11-0098. [DOI] [PMC free article] [PubMed] [Google Scholar]
- 25.Jiang BH, Zheng JZ, Leung SW, Roe R, Semenza GL. Transactivation and inhibitory domains of hypoxia-inducible factor 1alpha. Modulation of transcriptional activity by oxygen tension. J. Biol. Chem. 1997;272:19253–19260. doi: 10.1074/jbc.272.31.19253. [DOI] [PubMed] [Google Scholar]
- 26.Gerlinger M, et al. Intratumor heterogeneity and branched evolution revealed by multiregion sequencing. N Engl J Med. 2012;366:883–892. doi: 10.1056/NEJMoa1113205. [DOI] [PMC free article] [PubMed] [Google Scholar]
- 27.Dondeti VR, et al. Integrative genomic analyses of sporadic clear cell renal cell carcinoma define disease subtypes and potential new therapeutic targets. Cancer Res. 2012;72:112–121. doi: 10.1158/0008-5472.CAN-11-1698. [DOI] [PMC free article] [PubMed] [Google Scholar]
- 28.Ortiz-Barahona A, Villar D, Pescador N, Amigo J, del Peso L. Genome-wide identification of hypoxia-inducible factor binding sites and target genes by a probabilistic model integrating transcription-profiling data and in silico binding site prediction. Nucleic Acids Res. 2010;38:2332–2345. doi: 10.1093/nar/gkp1205. [DOI] [PMC free article] [PubMed] [Google Scholar]
- 29.Nissim I, et al. Effects of a glucokinase activator on hepatic intermediary metabolism: study with 13C-isotopomer-based metabolomics. Biochem. J. 2012;444:537–551. doi: 10.1042/BJ20120163. [DOI] [PMC free article] [PubMed] [Google Scholar]
- 30.Lee WN, et al. Mass isotopomer study of the nonoxidative pathways of the pentose cycle with [1,2-13C2]glucose. Am J Physiol. 1998;274:E843–E851. doi: 10.1152/ajpendo.1998.274.5.E843. [DOI] [PubMed] [Google Scholar]
Associated Data
This section collects any data citations, data availability statements, or supplementary materials included in this article.


