

Abstract
Expansion of a stem-like subpopulation with increased growth and survival potential is thought to drive colorectal tumor growth and progression. We investigated a CD44-positive (CD44(+)) subpopulation with extended growth and survival capacity in the human colon adenoma cell line LT97.
This subpopulation expressed elevated levels of fibroblast growth factor 18 (FGF18) and fibroblast growth factor receptor FGFR3-IIIc. Expression levels of the FGFR3-IIIb, which does not bind FGF18, were similar in CD44(+) and CD44(−). Addition of FGF18 to the medium or its overexpression from an adenoviral vector increased the colony formation capacity of CD44(+) 3-fold, and stimulated phosphorylation of ERK and GSK3β in both total LT97 populations and CD44(+) cells. FGFR3 signaling blockade by expression of a dominant-negative FGFR3-IIIc mutant led to inhibition of both colony formation and down-stream signaling in the CD44(+) cells. CD44(−) cells did not respond.
Blockade of the wnt-pathway by a dominant-negative Tcf4-mutant inhibited FGFR3 activation in LT97 cells as well as in HT29 colorectal cancer cells. The chemical wnt-inhibitor sulindac sulfide amide inhibited expression of FGF18 and FGFR3-IIIc and led to inhibition of receptor activation to less than 30% of control treated cells, both in LT97 and HT29 cultures.
Our results demonstrate that an FGF18/FGFR3-IIIc autocrine growth and survival loop is up-regulated in a wnt-dependent manner and drives tumor cell growth in a subpopulation of colon adenoma cells. This subpopulation can be regarded as a precursor of colon cancer development and can be targeted for CRC-prevention by blocking either wnt- or FGFR3-signaling.
Introduction
Self-renewal of colorectal mucosa tissue is driven by active wnt signaling that stimulates stem cells and transient amplifying cells residing in the lower half of the crypt. Wnt-activity decreases in the upper compartments of the crypt to permit differentiation and finally cell death (reviewed by [1]). The mutation in the APC tumor suppressor gene that initiates the majority of all colorectal carcinomas (CRC) causes progressive up-regulation of the wnt–pathway [2], leading to hyperproliferation, inhibition of cell death and consequently tumor formation [3,4]. Up-regulation of the ß-catenin-target gene FGF18 was found to have oncogenic impact [5,6] and to support malignant cell growth and survival in human CRC cell lines [6,7]. The growth factor acts as a survival factor in CRC cell lines and activates downstream signaling via the MAP-kinase and phosphatidyl-3-kinase pathways [6]. FGF18-dependent signaling is mediated by the FGF-receptor splice variant FGFR3-IIIc. Blockade of this receptor prevented response to FGF18, inhibited growth and induced apoptosis in colorectal cancer cells [8]. Expression of the FGFR3-IIIc receptor variant is constant or even up-regulated in high-stage CRC as compared to normal mucosa, while the FGFR3-IIIb splice variant is down-regulated. In conclusion, this leads to a significant shift in the FGFR3-IIIc/IIIb ratio during tumor progression [8]. In colorectal adenomas, wnt-signaling activity is still low in spite of the initiating APC mutation and FGF18 expression is similarly weak [6]. To model adenoma cell behaviour in vitro we have previously established the human colorectal adenoma cell line LT97 from micro-adenomas of a patient suffering from familial polyposis coli. LT97 cells lack both alleles of the APC tumor suppressor gene and carry a mutated Ki-ras allele, while the p53 protein is still functional, which reflects the characteristics of early adenoma stages. The growth pattern of LT97 cells is characterized by patches of rounded Ki67-positive cells dispersed in a layer of flat resting cells [9]. These 2 subpopulations are also reflected in the identification of a CD44-positive (CD44(+)) and a CD44-negative (CD44(−)) subpopulation by FACS analysis. The CD44(+) LT97 cells display robust survival and colony formation capacity and have a highly active wnt-pathway, while their CD44(−) counterparts rapidly undergo apoptosis in single cell suspensions and form only few colonies [10].
Like in CRC cells, the increased wnt-activity should also upregulate FGF18 expression and consequently FGF-dependent survival signaling in CD44(+) cells [6]. We have therefore asked, whether the increased survival capacity of LT97-CD44(+) cells may be derived from a wnt-driven establishment of the tumor-specific FGF18-induced survival signaling. To address this question, the present study aims to investigate the role of FGF18-dependent survival signals in the enhanced growth and survival capacity to CD44(+) LT97 cells. For this purpose we have studied (1) the differential expression of FGF18 and FGFR3, (2) the differential down-stream signaling and (3) the impact of FGF18 and FGFR3 on colony formation capacity in CD44(+) and CD44(−) LT97 cells. The interaction between FGFR3- and wnt-signaling was determined by blocking the wnt-pathway in LT97 cells. HT29, a CRC cell line with intermediate wnt-activity, was used for comparing adenoma- and carcinoma specific events.
Methods
Tissue culture and compounds
LT97 colon adenoma cells were established by our laboratory and kept under the conditions described [9]. hrFGF18 was obtained from PeproTech (London, UK). Sulindac sulfide amide (SSA) was synthesized and developed by G. Piazza and R. Reynolds [11].
For growth and signaling experiments FGF18 and SSA were diluted into the medium of cultures starved by withdrawal of serum and/or insulin.
Inhibition of wnt signaling
A vector expressing a dominant-negative mutant of the Tcf4 transcription factor (ΔN-Tcf4; gift from P. Petzelbauer; [12] was cloned into an adenoviral expression vector using the Gateway LR Clonase reaction (Invitrogen, Paisley, UK). Infection of cells with 10 and 50MoI of the ΔN-Tcf4-virus resulted in >100-fold overexpression of Tcf4 on mRNA level and a >50% reduction of β-catenin-dependent promoter activity in SW480 cells.
Reporter gene Assay
Reporter constructs containing the wild-type (TOP) or mutant (FOP) Tcf4-binding sites [13] were used to determine the trans-activational activity of endogenous β-catenin/Tcf4. 2×10⁴ cells per well were seeded into 24-well plates, and after 48 h were co-transfected with 1μg of TOPflash- or FOPflash-plasmid DNA and 1ng Renilla-plasmid DNA using Transfectin (BioRad, Hercules, CA). For wnt-pathway blockade cells were either cotransfected with a ΔN-Tcf4 vector or they were exposed to SSA for 24 hours.
Cell lysates were obtained by using passive lysis buffer provided with the Dual Luciferase Assay (Promega, Madison, WI) and luciferase activity determined according to the manufacturer's instructions. Quantification was calculated using the activity of Renilla as an internal control.
Flow cytometry and sorting
LT97 cells were harvested by a short trypsin treatment and washed with medium containing 2% FCS to block the protease. After washing, the cells were incubated with a PE-coupled CD44-antibody (Becton Dickinson, Franklin Lakes, NJ) and sorted on a fluorescence activated cell sorter (FACS) Calibur (BD) equipped with a 15mW argon laser exciting at 488 nm as described in [10].
Colony formation capacity
Colony formation was determined by seeding 3000 cells per 24 well. Cultures were fixed after 14 days and stained with crystal violet. The number of cells was counted in the microscope and / or evaluated using GSA-Image analysing software (GSA, Rostock, Germany).
Gene expression analysis
For quantitative Real-Time RT-PCR 2μg RNA were used to produce cDNA by incubation with 200U/μl M-MuLV reverse transcriptase (Fermentas, Harrington, Canada) at 42°C for 60 minutes. cDNA aliquots were then used to assess mRNA levels of FGF18, FGFR3-IIIb and FGFR3-IIIc as well as GAPDH as the housekeeping gene. Assays were performed using Taqman assays (ABI Foster City, CA) [9, 10] and the ΔΔct method.
Western Blot
The cells were homogenized in lysis buffer (50mM Tris/HCl pH 7.4, 500mM NaCl, 1% NP-40, 0.5% Na-DOC, 0.1% SDS) supplemented with 20μg/ml complete protease inhibitor cocktail (Roche, Mannheim, Germany), 5mM NaF and 100μM Na-vanadate. Aliquots containing 20μg of protein were analyzed by electrophoresis on 10% polyacrylamide gels and transferred to polyvinylidene-difluoride membranes. Proteins were identified using antibodies to phospho-FRS2α (Cell signalling, Boston, MA; #3861), phospho-FGFR (Cell Signalling; #3471) and FGFR3 (#sc-123, recognizes both FGFR3 splice variants; Santa Cruz Biotechnology, Inc., Dallas, TX); ERK1/2 (Upstate, Lake Placid, NY #06-182; 1:5000), phospho-ERK (Cell signalling, sampler kit: phospho-p44/42 MAP Kinase Thr202/Tyr204; 1:5000), GSK3β (Cell signalling #9315; 1:1000), phospho-GSK3β (Cell signalling #9323; 1:1000), S6 (#2212, Cell signalling, Boston, MA; 1:5000), phospho-S6 (Cell signalling #2215; 1:5000). Band intensity was quantified using ImageQuant software (GE Healthcare).
Quantification of secreted FGF18
Semi-confluent cultures were switched to serum-free medium and culture supernatants were collected after 24 hours. Concentration of FGF18 was determined using a Human FGF18 ELISA Kit obtained from Antibodies-Online (Aachen, Germany; ABIN418594) according to the manufacturer's instructions.
Statistics
PT-PCR, western blot and biological data were analyzed with Graph Pad Prism software using student's t-test, Mann-Whitney test or Kruskal-Wallis test as appropriate.
Results
Expression of FGF18 and FGFR3-IIIc is increased in CD44(+) cells
LT97 cells were sorted according to the presence of CD44 on their cell surface producing subpopulations of 65.1±3.5% and 34.9±4.7% for CD44(+) and CD44(−) cells respectively [10]. RNA was isolated from each fraction and expression of FGF18 and the receptor splice variants FGFR3-IIIb and -IIIc was analyzed by quantitative RT-PCR (qRT-PCR). FGFR3-IIIc mRNA level in CD44(+) cells was 2.5-fold higher than in CD44(−) cells and expression of FGF18 was increased by 50% (figure 1a). FGFR3-IIIb expression did not differ between the CD44(+) and CD44(−) cells, resulting in a distinctly lower IIIb/IIIc ratio in the CD44(+) cells. The higher expression of the growth factor receptor FGFR3-IIIc and its ligand, FGF18, in the CD44(+) population suggests an increased responsiveness of signal transduction pathways. To investigate this possibility, signaling down-stream of FGFR3-IIIc via the MAPK- and the PI3K/Akt-pathway, which are activated in response to FGF18 in colorectal cancer cells [6], was examined for signs of increased activation. To determine down-stream signaling activity in CD44(+) and CD44(−) cells, protein lysates of the sorted cell populations were analyzed by phosphorylation-specific western blotting. Specifically, ERK was analyzed to show MAPK-pathway activity and S6 was determined as PI3K/Akt pathway marker. GSK3β was included in the analysis, because in addition to being an Akt-substrate and activity marker for Akt-activity, it also mediates cross-talk with the wnt-pathway [14] (figure 1b). Area density of the bands was quantified using data from three consecutive experiments and total protein, phosphorylated protein and relative phosphorylation levels are depicted in figure 1c. ERK phosphorylation was increased to 2.3-fold (2.8±0.2 as compared to 1.2±0.2) in the CD44(+) subpopulation, while total ERK protein levels were not affected. GSK3β protein expression was increased 3.3-fold in CD44(+) as compared to CD44(−) (8.0±0.8 vs. 2.4±0.4), while specific GSK3β phosphorylation remained high in both. Finally, for S6 both protein level and specific phosphorylation were increased to 5-fold and 3.3-fold respectively in CD44(+) as compared to CD44(−) cells.
Figure 1. Differential expression of FGF18 and FGFR3 in CD44(+) and CD44(−) LT97 human adenoma cells.

a: Immediately after fluorescence-activated cell sorting, RNA was isolated from CD44(+) and CD44(−) cells and expression of FGF18 and FGFR3 was determined by qRT-PCR. For FGFR3, primers and probes specific for the IIIb and IIIc splice variants were used [10]. Gene expression was calculated from the Δct value relative to expression the GAPDH housekeeping gene.
b, c: In a parallel experiment protein lysates were produced using RIPA buffer containing the phosphatase inhibitors sodium fluoride and sodium orthovanadate. Down-stream signaling was then analyzed by western blotting using phosphospecific antibodies. Representative gels are shown in (b). Semi-quantification of Western blot bands was done by Image Quant software from 3 representative blots and is shown in panel (c).
## indicates a decrease at p<0.01 as compared to the CD44(+) group; ns indicates no statistically significant difference.
Impact of FGF signaling on colony formation
Longevity and unlimited growth potential are important characteristics of tumor stem cells, that are also exhibited by a tumor stem-like cell model such as the CD44(+) population in LT97 cells [10]. To determine whether they are facilitated by FGF18/ FGFR3-IIIc signaling, the viability and growth potential of CD44(+) and CD44(−) LT97 subpopulations was assessed in the presence and absence of FGF18 by colony formation assays, using 3000 cells/ 1.8cm2 in 24-well plates. Cultures were exposed to 10ng/ml FGF18 and colonies were stained for counting after 14 days. CD44(−) cells formed only few small colonies (figure 2a). Colonies in CD44(+) cultures grew larger, and their number was increased with 41.7±3.2 colonies/well for CD44(+) compared to 24.3±8.6 colonies/well for CD44(−). Addition of FGF18 to the medium further increased colony number in the CD44(+) subpopulation to 60.7±11.7 colonies/well (figure 2b). In addition, the mean area of colonies increased from 121.3±9.1μm2 to 857.8±66.1μm2 (Figure 2c). The CD44(−) subpopulation did not respond to FGF18 addition (figure 2 a, b).
Figure 2. Colony formation of CD44(+) and CD44(−) LT97 adenoma cells.

After sorting, CD44(+) and CD44(−) cell populations were plated at the density of 3000 cells/well and were left to grow for 14 days with or without 10ng/ml FGF18.
Colonies were stained (a), counted (b) and their area determined (c) using GSA image analyzer software. The figure shows the pooled results of three experiments (mean±SD). ** and *** indicate an increase at p≤0.01 and p≤0.001 as compared to the CD44(+) control cultures; ## indicates a decrease as compared to the CD44(+) control at p≤0.01.
Similar results were obtained when cells were infected with an FGF18-expressing adenovirus and sorted 24 hours later. Virus transduced cells secreted 818±99pg/ml FGF18 into the culture supernatant. Autocrine factor production in the infected cells did not alter the fraction of CD44(+) cells (data not shown). The colony formation assays using CD44(+) cells produced 63.7±6.3 colonies/well as compared to 40.6±5.1 colonies/well in the control group (1.5-fold; figure 3a,b). The mean area of the colonies in the growth assay increased from 121.0±9.1μm2 to 382.1±41.4μm2 (3.2-fold; figure 3c). Infection with an adenovirus expressing the dominant-negative kinase-dead FGFR3-IIIc mutant KD3, which competes with endogenous FGFR3-IIIc for FGF18 binding, reduced colony formation of the CD44(+) subpopulation by 70% (13.8±4.2 colonies/well). The colony size was not affected by the KD3 virus (figure 3c). CD44(−) colonies were significantly fewer than CD44(+) and did not respond to increased FGF18 production, but were slightly inhibited by the KD3 virus without achieving statistical significance due to the low overall colony numbers and high inter-experimental variation (figure 3a, b).
Figure 3. Colony formation of virally transduced CD44(+) and CD44(−) LT97 adenoma cells.

LT97 cells were transduced with adenoviral vectors expressing FGF18 or a kinase-dead FGFR3-IIIc mutant (KD3) using 10MoI. 24h later cells were harvested and sorted into CD44(+) and CD44(−) cell populations. The cells were then plated for colony formation assays as described in the legend to figure 2.
(a) depicts CD44(+) colonies after 14 days of growth, (b) gives colony number and (c) colony size after. The results are pooled from three experiments and presented as mean±SD. ** indicates an increase at p≤0.01 as compared to the CD44(+) control cultures; ### indicate a reduction at p≤0.001 as compared to control.
Impact of FGF on down-stream signaling
We have previously shown activation of both the MAPK and PI3K/Akt pathways in colorectal cancer cells exposed to FGF18 [6]. To investigate whether the LT97 adenoma cells are also sensitive to FGF18 stimulation we have added 10ng/ml FGF18 to starved LT97 and CD44(+)-LT97 cultures and harvested total cellular protein 15 minutes later. The lysates were analyzed by western blot using phosphorylation-specific antibodies to ERK and GSK3β. A typical blot is shown in figure 4a. The pooled results from 3 independent experiments are depicted in figure 4b. Addition of FGF18 increased phosphorylation of both ERK and GSK3β 3-fold in LT97 cells. In CD44(+)-LT97 cells the control phosphorylation level was higher than in LT97 cells (figure 4a) and after normalization to the respective control the stimulation was only about 2-fold (figure 4b).
Figure 4. FGF18-dependent down-stream signaling in LT97 adenoma cells.

(a, b) Starved LT97 adenoma cells and CD44(+) cells were exposed to 10ng/ml FGF18. Down-stream signaling activity was determined by western blot of protein lysates using phospho-specific antibodies recognizing ERK and GSK3β.
(c, d) Down-stream signaling in CD44(+) cells transduced with adenoviral vectors expressing FGF18, the dominant-negative KD3 mutant or no functional product was similarly analyzed.
(a, c) show representative western blots.
(b, d) Band intensities were measured using ImageQuant software and relative phosphorylation levels were determined by dividing the p-protein band intensities by the respective total protein numbers. The diagrams depict the mean±SD from 3 independent experiments. *; # and ## indicate a significant increase or decrease at p≤0.05 and p≤0.01 by students' t-test.
In a second set of experiments, we have infected LT97 cultures with adenoviral vectors expressing either FGF18 or KD3. Protein lysates for western blot analysis were obtained 24 hours after infection and analyzed as described above (figure 4c, d). Under these conditions an impact on ERK and GSK3β phosphorylation was only observed in CD44(+) cells. Effects on ERK-phosphorylation were moderate – a 20% increase due to Ad-FGF18 infection and an inhibition of about 20% caused by Ad-KD3. Impact on GSK3β was stronger with Ad-FGF18 stimulating phosphorylation by 66% and Ad-KD3 inhibiting phosphorylation by 50% (figure 4d).
To assess the crosstalk between FGF18 and wnt-dependent promoter activity, we performed luciferase assays in HT29 cells in the absence and presence of 10ng/ml FGF18. The growth factor stimulated β-catenin-dependent promoter activity by about 50% (figure 5).
Figure 5. Impact of FGF18 on β-catenin-dependent promoter activity.
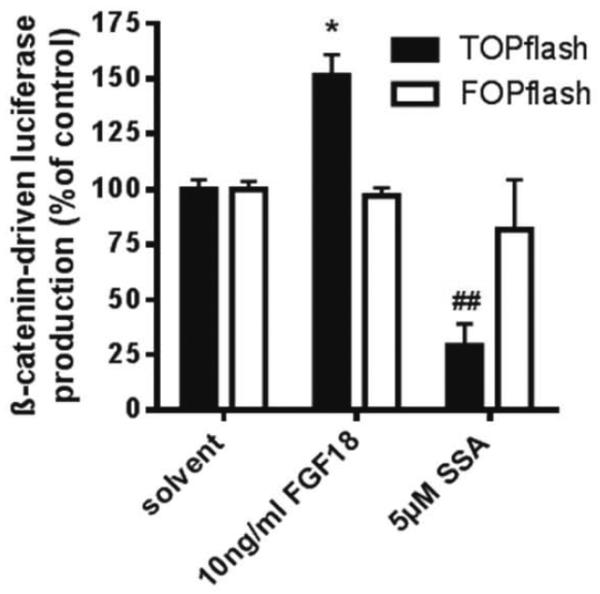
TOPflash or FOPflash vectors were introduced into HT29 cells by lipofection 24 hours before exposure to 10ng/ml FGF18 or 5μM SSA. CMV/renilla was co-transfected for standardization. Cultures were lysed for luciferase assays 24 hours later.
* indicates an increase as compared to control at p≤0.05; ## indicates a decrease at p≤0.01 as compared to controls all calculated by students' t-test.
Impact of wnt-signaling activity
To address the question whether the regulation FGF18 and FGFR3 expression was actually dependent on wnt-signaling activity, β-catenin-dependent gene expression in LT97 colon adenoma cells was blocked by transduction with a dominant-negative mutant of the Tcf4 transcription factor (ΔN-Tcf4) [12]. The construct reduced β-catenin-dependent promoter activity to 67% in LT79 cells and to 50% in HT29 cells (figure 6a). Infection with 50MoI of the ΔN-Tcf4 virus caused a strong decrease of the CD44-dependent fluorescence of LT97 cells, so that most of the population shifted below the threshold of 100 fluorescence units (figure 6b). The CD44-dependent mean fluorescence intensity decreased from 769.5±62.5 to 189.7±64.5 (figure 6c). The impact on logarithmic growth was minimal as compared to cells infected with a control virus. Sorted CD44(+) LT97 cells were more sensitive, so that colony formation was reduced to about 40% of controls already with 10MoI of the blocking virus (figure 6d).
Figure 6. Impact of the dominant-negative ΔN-Tcf4 mutant on wnt-pathway activity and the CD44(+) compartment.

(a) LT97 and HT29 cells were transfected with a vector expressing the ΔN-Tcf4 mutant together with the TOPflash or FOPflash reporter constructs and a renilla control vector. 24 hours later luciferase activity was determined from whole cell lysates.
(b, c) LT97 cells were infected with an adenoviral vector expressing the ΔN-Tcf4 mutant. 24 hours later cells were harvested by trypsinization and CD44 on the cell surface was analyzed by flow cytometry. (b) representative histograms, (c) pooled mean fluorescence intensity from 3 independent experiments (mean±SD).
(d) the CD44(+) cells were plated at 3000 cells / 24-well to determine colony formation capacity.
#, ##, and ### indicate a statistically significant decrease as compared to the control at p≤0.05, p≤0.01, and p≤0.001 respectively.
Blocking of the wnt pathway had a pronounced impact on FGF18 and FGFR3 expression levels. The mRNA expression levels of FGF18 and FGFR3-IIIc in virus-transduced LT97 cells were too close to the detection limit for reliable analysis, but receptor protein level and signaling activity could be analyzed. FGFR3 protein expression was reduced by 50%, and FGFR phosphorylation was strongly repressed in ΔN-Tcf4 transfected LT97 cells (figure 7a). Band area densities were quantified using ImageQuant software and data from three experiments were pooled (figure 7b), showing FGFR3 and pFGFR and the pFGFR/FGFR3 ratio, which describes relative receptor phosphorylation. As levels of FGF18 secreted into the supernatant of control cultures were very low, suppression of FGF18 protein by wnt-pathway blockade could not be verified directly.
Figure 7. Impact of wnt-pathway blockade on FGFR3-dependent signaling in LT97 cells.
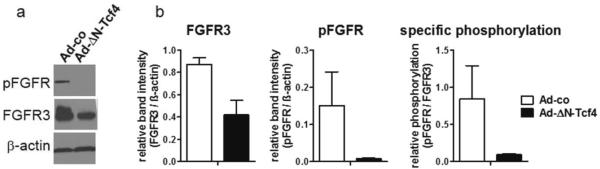
LT97 colon adenoma cells were transduced with an adenoviral vector expressing the ΔN-Tcf4 mutant and protein lysates were harvested 24 hours later. FGFR3 activation was determined by western blot using antibodies recognizing FGFR3 and p-FGFR.
(a) representative western blot
(b) Band intensities were measured using ImageQuant software and calculated relative to β-actin. Relative phosphorylation levels were determined by dividing the p-protein band intensities by the respective total protein numbers. The diagrams depict the mean±SD from 3 independent experiments. ## and ### indicates a significant decrease at p≤0.01 and p≤0.001 respectively by students' t-test.
To overcome the problems that low expression levels caused in the analysis of the impact wnt signaling has on FGF18/FGFR3-IIIc expression and activation levels, parallel experiments were performed with HT29 cells. These cells have higher wnt-pathway activity than LT97 (figure 6a), and permitted determination of mRNA expression levels for FGF18, FGFR3-IIIc and FGFR3-IIIb in ΔN-Tcf4 infected cultures (figure 8a). The mRNA levels of both FGF18 and FGFR3-IIIc were reduced by 50MoI of the virus, while FGFR3-IIIb mRNA levels were only slightly reduced without achieving statistical significance (figure 8a). Secreted FGF18 protein could be detected at a concentration of 162.7±65.8pg/ml in the culture supernatant of HT29 cells and was reduced to the detection limit (28.7±53.8pg/ml) by 50MoI ΔN-Tcf4. FGFR3 protein in ΔN-Tcf4-infected cells was unaltered, but FGFR phosphorylation was significantly decreased (figure 8b, c).
Figure 8. Impact of wnt-pathway blockade on FGFR3-dependent signaling in HT29 cells.

HT29 colon carcinoma cells were transduced with an adenoviral vector expressing the ΔN-Tcf4 mutant and RNA as well as protein lysates were harvested 24 hours later.
(a) FGF18 and FGFR3 mRNA levels were determined by qRT-PCR and calculated relative to GAPDH as housekeeping gene.
(b, c) FGFR3 activation was determined by western blot using antibodies recognizing FGFR3 and p-FGFR.
(b) representative western blot
(c) Band intensities were measured using ImageQuant software and calculated relative to β-actin. Relative phosphorylation levels were determined by dividing the phospho-protein band intensities by the respective total protein numbers. The diagrams depict the mean±SD from 3 independent experiments. # and ### indicates a significant decrease at p≤0.05 and p≤0.001 respectively by students' t-test.
Chemical inhibition of the wnt pathway with sulindac sulfide amide (SSA)
As an alternative to blocking wnt signaling by virus transduction of ΔN-Tcf4, the sulindac derivative SSA [11] was used as a small molecule inhibitor of the wnt-pathway [15,16]. 5μM of the compound reduced β-catenin-dependent luciferase activity in HT29 cells to 36.6±8.4% of the control, and reduced cell viability in a concentration dependent manner with IC50 concentrations of 9.5μM (CI95% 7.8–11.5μM) for LT97 and 5.5μM (CI95% 4.3–7.0μM) for HT29. Colony formation of CD44(+) LT97 cells was reduced to 33.7±3.4% of the control by 5μM SSA (data not shown).
For analysis of mRNA expression, LT97 and HT29 cells were incubated with 10μM SSA, or as a control with the solvent only, and RNA was isolated after 24 hours. The compound repressed both FGF18 and FGFR3-IIIc mRNA to about 50% of the control in LT97 adenoma cells, but inter-experimental variations were large due to the low expression level of both genes. The results were more reproducible in HT29 cells, with expression levels of about 50% of control for FGF18 and 73% for FGFR3-IIIc, while FGFR3-IIIb expression was not significantly altered in either cell line (figure 9a). Secreted FGF18 protein in the culture supernatant of HT29 cells dropped below the detection limit in SSA exposed cells. As a measure of FGF-dependent signaling, we analyzed phosphorylation of the FGFR-substrate FRS2α. FRS2α was found to be decreased to 50% of the control in LT97 cells exposed to SSA and to 40% of the control in HT29 (figure 9c, d).
Figure 9. Inhibition of FGF18 and FGFR3 expression and activity by SSA.

(a) LT97 colon adenoma cells and HT29 carcinoma cells were starved and exposed to 10μM SSA. RNA was isolated after 24 hours and expression of FGF18 and FGFR3-IIIc and FGFR3-IIIb was determined by qRT-PCR as described in figure 1. Results were normalized to the respective control and pooled from 3 independent experiments and #, ## and ### indicates a significant decrease as compared to controls at p≤0.05, p≤0.01 and p≤0.001 respectively calculated by Mann-Whitney test.
(b, c) Proteins were harvested and phospho-FRS2α determined by western blot with specific antibodies.
(b) shows a typical example of western blot gels. (c) Band intensity was determined using ImageQuant software. The graphs show the pooled results of 3 experiments (mean±SD) and # and ## indicate a reduction as compared to control at p≤0.05 and p≤0.01.
Discussion
To acquire malignant characteristics, tumor cells have to accumulate several genetic as well as regulatory alterations in a process that requires many years [17]. Consequently, the cells of origin from which a cancer arises should be distinguished by a long life span and high survival capacity. In the human colorectal adenoma cell line LT97, a CD44(+) subpopulation displays these characteristics. CD44(+) cells are characterized by an activated wnt-pathway, and they are protected from apoptosis induced by the loss of cell-cell and cell-substrate contacts during the isolation procedure [10]. Among the wnt-target genes that are up-regulated in colon cancer cells, FGF18 [5] is a strong survival factor for the tumor cells and contributes prominently to tumor growth in the colon [6]. Its impact is mediated via the FGFR3-IIIc receptor variant [8], whose expression is retained or even up-regulated during tumor progression, while the FGFR3-IIIb variant is down-regulated resulting in a significant shift in the IIIb/IIIc ratio with tumor progression [8].
This study now reports that FGF18 and FGFR3-IIIc are differentially regulated in the CD44(+) and CD44(−) subpopulations of LT97 human adenoma cells, providing the basis for autocrine survival signals already in early adenoma cells. While expression of both FGF18 and FGFR3-IIIc is low in growing LT97 cells [6,8], mRNA levels are increased in the CD44(+) subpopulation that displays enhanced growth and survival capacity [10]. CD44(+) cells showed a robust increase of FGFR3-IIIc expression, that reduced the IIIb/IIIc ratio for this subpopulation by a factor of 2 compared to CD44(−). The difference was less pronounced for FGF18, but the growth factor can synergize with the increased FGFR3-IIIc receptor numbers to produce enhanced FGF-dependent signaling activity in the CD44(+) subpopulation. This is reflected in increased down-stream signaling via the ERK and Akt pathways, that have been shown to be stimulated by FGF18 in colorectal tumor cells in an earlier study [6]. The findings of this study now demonstrate that FGF18 stimulates down-stream signaling via the ERK and Akt pathways in LT97 adenoma cells as well, and that the CD44(+) LT97 cells are more sensitive to FGF18 overexpression and FGFR signaling blockade. Specifically, FGF18 increases phosphorylation of GSK3β, which inactivates the enzyme and further decreases phosphorylation and degradation of β-catenin [18]. Moreover, phosphorylation of both ERK and GSK3β could be inhibited by the dominant-negative KD3 mutant in CD44(+)-LT97 cells, demonstrating that FGFR3 is involved in the signaling activation.
In normal intestinal mucosa, expression of FGFR3 is mainly localized in the lower third of the crypt [19], where wnt-signaling activity is high and CD44 is expressed [20,21]. Moreover, the receptor was shown to play a role in gut development and the differentiation of Paneth cells [22]. Differential analysis of the FGFR3-IIIb and IIIc splice variants in developing and regenerating intestinal mucosa has identified the IIIb variant as the main FGFR3 in the gut, but the IIIc variant was also found [23]. In addition, both FGF 9 and 18 induce similar biological effects on crypt stem cells [22], which strongly argues for FGFR3-IIIc activity [24]. The increased expression of FGFR3-IIIc in CD44(+) cells suggests that they are related to, or have been derived from the stem cells and/or transit amplifying cells located in the lower crypt compartments [25].
Our results also demonstrate that expression of both FGF18 and the FGFR3-IIIc receptor is driven by wnt-activity. Specific wnt-pathway inhibition by the dominant negative Δ-Tcf4 mutant attenuated FGF-dependent signaling in both the LT97 adenoma cells and the HT29 carcinoma cells. In the carcinoma cell line, down-regulation of FGFR3-IIIc as well as FGF18 mRNA levels have been shown. Therefore, FGFR3-IIIc-dependent stimulation has to be regarded as a down-stream effector of wnt in our colon adenoma model. Stimulation may be achieved through FGF9, that has been shown to modulate paneth cell differentiation [22] or by the wnt-regulated FGFs 18 and 20 that are both up-regulated in colon carcinomas [5,6,26].
In normal intestinal mucosa, FGFR3-dependent signaling has been shown to modulate wnt-pathway activity via phosphorylation of GSK3β. This also appears to be the case in the LT97 adenoma cell model. FGF18 acts to stimulate wnt-activity as shown by reporter gene assays, thus establishing a cross-talk that enhances both wnt- and FGFR3-dependent activity. This hyperactivation could explain the strong but transient shift of β-catenin into the nucleus observed in freshly plated CD44(+) cultures [10], and provide a strong pro-tumorigenic impuls in vivo.
The functional role of FGF18/FGFR3-IIIc is demonstrated by the strong stimulatory effect on colony formation that we observed in response to both addition of the growth factor to the medium and its overexpression from an adenoviral vector. Colony formation from sparse cultures is a hallmark of malignant cells and can be used to assess malignant growth and survival potential [8]. Colony number was increased about 1.5-fold due to FGF18 addition or expression. Moreover, growth stimulation was obvious from the larger size of the FGF18-stimulated colonies. FGF-signaling blockade by the kinase-dead receptor mutant KD3 had a potent inhibitory effect on colony formation demonstrating that FGFR3-dependent signaling was essential for the survival effect. Even CD44(−) cells showed some inhibition, albeit this did not reach statistical significance.
In FGFR3−/− mice, crypt fission is defective because the number of crypt stem cells is too low to sustain the process, suggesting a defect in stem cell proliferation [19]. At the same time, lineage allocation and differentiation are also dependent on FGFR3 activity, suggesting multiple roles for the receptor probably depending on the FGF-ligand and the receptor splice variant involved [22]. During colorectal tumor development, up-regulation of FGF18 and FGFR3-IIIc has been shown to increase tumor cell survival and migration [6,8]. The present study shows that this effect is already present in CD44(+) early adenoma cells, marking them as the precursor cells for further tumor development.
Targeting this subpopulation could result in effective prevention of colorectal tumor growth. In the present study, wnt-signaling inhibition was achieved by a dominant-negative mutant Δ-Tcf4, which suppressed β-catenin-dependent promoter activity and reduced the size and colony formation capacity of the CD44(+) subpopulation. As a chemical inhibitor of wnt-signaling, we have used SSA, a sulindac derivative that does not inhibit cyclooxygenase activity [11]. Sulindac has been shown to interact with wnt-signaling by affecting either the degradation [27] or the gene expression [16] of β-catenin. This constitutes a mechanism that modulates wnt-signaling independent of APC and β-catenin mutations. In a min-mouse model, sulindac has been shown to target oncogenic stem cells [28]. Our observation of a reduced size and colony formation capacity of the CD44(+) subpopulation in LT97 adenoma cultures are well in line with this report. SSA has also been shown to induce apoptosis and inhibit Akt/mTOR signaling [29]. The authors have not assessed whether this activity was dependent on the wnt-inhibition and our results suggest the inhibition of FGF-dependent survival signaling may contribute to the effect. In summary, this indicates that SSA could be a useful chemopreventive drug that interrupts a pro-tumorigenic wnt/ FGFR3 stimulation loop and targets the very cell population from which tumor progression proceeds. Furthermore, SSA is a sulindac derivative without COX-inhibitory activity, which avoids COX-related side effects.
Supplementary Material
Acknowledgements
The authors wish to acknowledge P.Koll and D. Mejri for expert technical assistance.
Grant Support The study was supported by the Ludwig Boltzmann Society (Cluster Oncology) and by the Herzfelder'sche Familienstiftung to BM and by the NIH grants 1R01CA131378 and 1R01CA148817 to GP.
Abbreviations
- CRC
Colorectal cancer
- ERK
External signal regulated kinase
- FGF(R)
Fibroblast growth factor (receptor)
- FRS2α
FGFR substrate 2 alpha
- GSK3β
Glycogensynthase kinase 3 beta
- (q)RT-PCR
(quantitative) reverse transcriptase polymerase chain reaction
- SSA
Sulindac sulfide amide
References
- 1.van der Flier LG, Clevers H. Stem cells, self-renewal, and differentiation in the intestinal epithelium. Annual review of physiology. 2009;71:241–260. doi: 10.1146/annurev.physiol.010908.163145. [DOI] [PubMed] [Google Scholar]
- 2.Fearon ER, Vogelstein B. A genetic model for colorectal tumorigenesis. Cell. 1990;61(5):759–767. doi: 10.1016/0092-8674(90)90186-i. [DOI] [PubMed] [Google Scholar]
- 3.Reya T, Clevers H. Wnt signalling in stem cells and cancer. Nature. 2005;434(7035):843–850. doi: 10.1038/nature03319. [DOI] [PubMed] [Google Scholar]
- 4.Vries RGJ, Huch M, Clevers H. Stem cells and cancer of the stomach and intestine. Molecular Oncology. 2010;4(5):373–384. doi: 10.1016/j.molonc.2010.05.001. [DOI] [PMC free article] [PubMed] [Google Scholar]
- 5.Shimokawa T, Furukawa Y, Sakai M, et al. Involvement of the FGF18 Gene in Colorectal Carcinogenesis, as a Novel Downstream Target of the {beta}-Catenin/T-Cell Factor Complex. Cancer Res. 2003;63(19):6116–6120. [PubMed] [Google Scholar]
- 6.Sonvilla G, Allerstorfer S, Stattner S, et al. FGF18 in colorectal tumour cells: autocrine and paracrine effects. Carcinogenesis. 2008;29(1):15–24. doi: 10.1093/carcin/bgm202. [DOI] [PubMed] [Google Scholar]
- 7.Radtke F, Clevers H. Self-renewal and cancer of the gut: two sides of a coin. Science. 2005;307(5717):1904–1909. doi: 10.1126/science.1104815. [DOI] [PubMed] [Google Scholar]
- 8.Sonvilla G, Allerstorfer S, Heinzle C, et al. Fibroblast growth factor receptor 3-IIIc mediates colorectal cancer growth and migration. Br J Cancer. 2010;102:1145–1156. doi: 10.1038/sj.bjc.6605596. [DOI] [PMC free article] [PubMed] [Google Scholar]
- 9.Richter M, Jurek D, Wrba F, et al. Cells obtained from colorectal microadenomas mirror early premalignant growth patterns in vitro. Eur J Cancer. 2002;38(14):1937–1945. doi: 10.1016/s0959-8049(02)00158-2. [DOI] [PubMed] [Google Scholar]
- 10.Schulenburg A, Cech P, Herbacek I, et al. CD44-positive colorectal adenoma cells express the potential stem cell markers musashi antigen (msi1) and ephrin B2 receptor (EphB2) J Pathol. 2007;213(2):152–160. doi: 10.1002/path.2220. [DOI] [PubMed] [Google Scholar]
- 11.Piazza GA, Keeton AB, Tinsley HN, et al. A novel sulindac derivative that does not inhibit cyclooxygenases but potently inhibits colon tumor cell growth and induces apoptosis with antitumor activity. Cancer prevention research (Philadelphia, Pa. 2009;2(6):572–580. doi: 10.1158/1940-6207.CAPR-09-0001. [DOI] [PMC free article] [PubMed] [Google Scholar]
- 12.Holnthoner W, Pillinger M, Gröger M, et al. Fibroblast Growth Factor-2 Induces Lef/Tcf-dependent Transcription in Human Endothelial Cells. Journal of Biological Chemistry. 2002;277(48):45847–45853. doi: 10.1074/jbc.M209354200. [DOI] [PubMed] [Google Scholar]
- 13.Hoshikawa M, Yonamine A, Konishi M, Itoh N. FGF-18 is a neuron-derived glial cell growth factor expressed in the rat brain during early postnatal development. Brain Res Mol Brain Res. 2002;105(1–2):60–66. doi: 10.1016/s0169-328x(02)00393-5. [DOI] [PubMed] [Google Scholar]
- 14.Katoh M. Cross-talk of WNT and FGF signaling pathways at GSK3beta to regulate beta-catenin and SNAIL signaling cascades. Cancer Biol Ther. 2006;5(9):1059–1064. doi: 10.4161/cbt.5.9.3151. [DOI] [PubMed] [Google Scholar]
- 15.Boon EMJ, Keller JJ, Wormhoudt TAM, et al. Sulindac targets nuclear [beta]-catenin accumulation and Wnt signalling in adenomas of patients with familial adenomatous polyposis and in human colorectal cancer cell lines. Brit J Cancer. 2004;90(1):224–229. doi: 10.1038/sj.bjc.6601505. [DOI] [PMC free article] [PubMed] [Google Scholar]
- 16.Li N, Xi Y, Tinsley HN, et al. Sulindac Selectively Inhibits Colon Tumor Cell Growth by Activating the cGMP/PKG Pathway to Suppress Wnt/β-Catenin Signaling. Molecular Cancer Therapeutics. 2013;12(9):1848–1859. doi: 10.1158/1535-7163.MCT-13-0048. [DOI] [PMC free article] [PubMed] [Google Scholar]
- 17.Hanahan D, Weinberg RA. The hallmarks of cancer. Cell. 2000;100(1):57–70. doi: 10.1016/s0092-8674(00)81683-9. [DOI] [PubMed] [Google Scholar]
- 18.Clevers H. Wnt/beta-catenin signaling in development and disease. Cell. 2006;127(3):469–480. doi: 10.1016/j.cell.2006.10.018. [DOI] [PubMed] [Google Scholar]
- 19.Vidrich A, Buzan JM, Brodrick B, et al. Fibroblast growth factor receptor-3 regulates Paneth cell lineage allocation and accrual of epithelial stem cells during murine intestinal development. American journal of physiology Gastrointestinal and liver physiology. 2009;297(1):G168–178. doi: 10.1152/ajpgi.90589.2008. [DOI] [PMC free article] [PubMed] [Google Scholar]
- 20.Rudzki Z, LeDuy L, Jothy S. Changes in CD44 expression during carcinogenesis of the mouse colon. Exp Mol Pathol. 1997;64(2):114–125. doi: 10.1006/exmp.1997.2214. [DOI] [PubMed] [Google Scholar]
- 21.Simons BD, Clevers H. Stem cell self-renewal in intestinal crypt. Experimental Cell Research. 2011;317(19):2719–2724. doi: 10.1016/j.yexcr.2011.07.010. [DOI] [PubMed] [Google Scholar]
- 22.Brodrick B, Vidrich A, Porter E, Bradley L, Buzan JM, Cohn SM. Fibroblast Growth Factor Receptor-3 (FGFR-3) Regulates Expression of Paneth Cell Lineage-specific Genes in Intestinal Epithelial Cells through both TCF4/β-Catenin-dependent and - independent Signaling Pathways. Journal of Biological Chemistry. 2011;286(p21):18515–18525. doi: 10.1074/jbc.M111.229252. [DOI] [PMC free article] [PubMed] [Google Scholar]
- 23.Vidrich A, Buzan JM, Ilo C, Bradley L, Skaar K, Cohn SM. Fibroblast growth factor receptor-3 is expressed in undifferentiated intestinal epithelial cells during murine crypt morphogenesis. Dev Dyn. 2004;230(1):114–123. doi: 10.1002/dvdy.20018. [DOI] [PubMed] [Google Scholar]
- 24.Zhang X, Ibrahimi OA, Olsen SK, Umemori H, Mohammadi M, Ornitz DM. Receptor Specificity of the Fibroblast Growth Factor Family: the complete mammalian FGF family. J Biol Chem. 2006;281(23):15694–15700. doi: 10.1074/jbc.M601252200. [DOI] [PMC free article] [PubMed] [Google Scholar]
- 25.Potten CS, Loeffler M. Stem cells: attributes, cycles, spirals, pitfalls and uncertainties. Lessons for and from the crypt. Development. 1990;110(4):1001–1020. doi: 10.1242/dev.110.4.1001. [DOI] [PubMed] [Google Scholar]
- 26.Katoh M. FGF signaling network in the gastrointestinal tract (review) Int J Oncol. 2006;29(1):163–168. [PubMed] [Google Scholar]
- 27.Rice PL, Kelloff J, Sullivan H, et al. Sulindac metabolites induce caspase- and proteasome-dependent degradation of beta-catenin protein in human colon cancer cells. Mol Cancer Ther. 2003;2(9):885–892. [PubMed] [Google Scholar]
- 28.Qiu W, Wang X, Leibowitz B, et al. Chemoprevention by nonsteroidal anti-inflammatory drugs eliminates oncogenic intestinal stem cells via SMAC-dependent apoptosis. Proceedings of the National Academy of Sciences. 2010;107(46):20027–20032. doi: 10.1073/pnas.1010430107. [DOI] [PMC free article] [PubMed] [Google Scholar]
- 29.Gurpinar E, Grizzle WE, Shacka JJ, et al. A Novel Sulindac Derivative Inhibits Lung Adenocarcinoma Cell Growth through Suppression of Akt/mTOR Signaling and Induction of Autophagy. Molecular Cancer Therapeutics. 2013;12(5):663–674. doi: 10.1158/1535-7163.MCT-12-0785. [DOI] [PMC free article] [PubMed] [Google Scholar]
Associated Data
This section collects any data citations, data availability statements, or supplementary materials included in this article.