Abstract
Online monitoring of viable cell volume (VCV) is essential to the development, monitoring, and control of bioprocesses. The commercial availability of steam-sterilizable dielectric-spectroscopy probes has enabled successful adoption of this technology as a key noninvasive method to measure VCV for cell-culture processes. Technological challenges still exist, however. For some cell lines, the technique's accuracy in predicting the VCV from probe-permittivity measurements declines as the viability of the cell culture decreases. To investigate the cause of this decrease in accuracy, divergences in predicted vs. actual VCV measurements were directly related to the shape of dielectric frequency scans collected during a cell culture. The changes in the shape of the beta dispersion, which are associated with changes in cell state, are quantified by applying a novel “area ratio” (AR) metric to frequency-scanning data from the dielectric-spectroscopy probes. The AR metric is then used to relate the shape of the beta dispersion to single-frequency permittivity measurements to accurately predict the offline VCV throughout an entire fed-batch run, regardless of cell state. This work demonstrates the possible feasibility of quantifying the shape of the beta dispersion, determined from frequency-scanning data, for enhanced measurement of VCV in mammalian cell cultures by applying a novel shape-characterization technique. In addition, this work demonstrates the utility of using changes in the shape of the beta dispersion to quantify cell health. © 2013 American Institute of Chemical Engineers Biotechnol. Prog., 30:479–487, 2014
Keywords: dielectric spectroscopy, capacitance, permittivity, viable cell volume (VCV), frequency scanning, process control, mammalian CHO, biomass probe
Introduction
Online monitoring is essential to the development, monitoring, and control of bioprocesses.1–4 In bioreactors, one of the most important online measurements is total biomass, or viable cell volume (VCV), because concentration measurements of the media must be normalized to VCV to yield useful information about the cell state.5–9 Several methods have been developed in an attempt to achieve this observability online, including oxygen-demand analysis,10 turbidity analysis,11 and dielectric spectroscopy,12–14 as well as at-line methods (i.e., sterile autosampling) and more-traditional methods (e.g., trypan blue dye exclusion).15 Of these methods, dielectric spectroscopy offers numerous advantages including sensitivity to cell numbers, a high scan rate, and maintenance of bioreactor sterility, as well as the capability to measure cell properties not easily accessed by other online methods.12,16
In dielectric spectroscopy, the dielectric permittivity of cells in a population—that is, their ability to store electrical charge—is measured as a function of the frequency of the applied electrical field using a dielectric probe. Any cell with an intact membrane can act as a dielectric material when subjected to an electric field by means of a well-known phenomenon called Maxwell–Wagner polarization.17 Since each cell stores electrical charge independently at cell densities relevant to a bioreactor, the total permittivity is proportional to the cell volume fraction.
In industrial settings, dielectric probes are mainly used to measure total VCV online in bioreactors. For this application, permittivity is usually measured at only one or two frequencies. However, dielectric spectroscopy has also been investigated extensively in academic settings to measure the permittivity characteristics of dielectrics across a frequency spectrum using frequency scanning. Several informative reviews have been published on the behavior of the dielectric spectrum as it pertains to cells.17–20 Some of the key physics are reviewed briefly here.
Background
Overview of frequency scanning
If the frequency of the applied electric field is varied, a frequency-dependent response can be observed in the measured permittivity values. This characteristic response (or dielectric relaxation) is known as the beta dispersion, and occurs mainly between 0.1 and 100 MHz for mammalian cells. Beta dispersions may consist of a single relaxation or a sum of multiple relaxations, as illustrated in Figure 1. Dielectric relaxation phenomena are commonly characterized by a Cole–Cole model, in which dielectric relaxations are characterized by a dielectric increment (Δε), critical frequency (fc), and a Cole–Cole parameter (α).21
Figure 1.
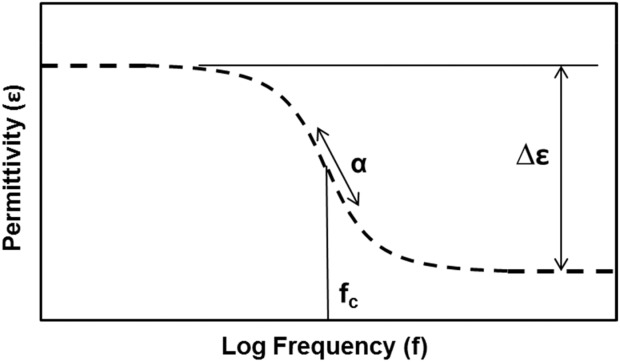
Representation of the beta dispersion.
The dielectric increment is defined as the difference between the low- and high-frequency plateaus of the measured beta dispersion. The critical frequency is defined as the frequency at which the inflection occurs in the beta dispersion and is directly related to the average dielectric relaxation time of the sample (i.e., fc = 2πτ, where τ is the dielectric relaxation time). The Cole–Cole parameter is an empirical parameter that determines the “steepness” with which the permittivity decreases with frequency and is thought to be related to the distribution of dielectric properties of the measured sample.22 The Cole–Cole equation is introduced in Eq. 1:
| (1) |
where ε(f) is the permittivity as a function of frequency (f) and εh is a permittivity offset equal to the value of the high-frequency plateau of the beta dispersion. The values of the parameters of the Cole–Cole model describing the shape of the beta dispersion depend on the properties of the dielectric being measured. Previously, many cell properties have been observed to affect the shape of the beta dispersion, including cell size23; intracellular organelle content24,25; membrane-specific capacitance25,26; and intracellular conductivity.25,27 Changes in the shape of the beta dispersion have also been reported for healthy versus nonhealthy cells28–32 and for cells undergoing other metabolic changes.23,27,33
Overview of VCV measurement techniques using dielectric spectroscopy
Information about the shape of the beta dispersion can be obtained by measuring capacitance as a function of frequency at many points along the beta dispersion, instead of measuring at only one or two frequencies. However, for simplicity, VCV is often estimated by measuring the beta dispersion only at one or two frequencies.34 When only two frequencies are used, the frequencies can be chosen so that the resulting permittivity values at those frequencies are indicative of the dielectric increment.
The dielectric increment can also be estimated by measuring at a single frequency if the high-frequency plateau of the beta dispersion is assumed to be constant. The dielectric increment is known to relate directly to the total biovolume, or cell volume fraction, of the system via the relationship.34
| (2) |
where r is the average cell radius, Φ is the total cell volume fraction, and Cm is the membrane-specific capacitance (usually assumed to be a constant).
VCV, therefore, is usually predicted assuming that (1) a linear correlation exists between VCV and dielectric increment and (2) all remaining terms in the Cole–Cole model describing the beta dispersion are constant over the entire experiment,34 as shown in Eq. 3:
| (3) |
where VCV(t) is the predicted viable cell volume at a given time (t), A is a constant of proportionality relating the VCV to Δε, and k1 is a constant offset between VCV and Δε.
The commercial availability of steam-sterilizable dielectric probes has allowed dielectric spectroscopy to be successfully used in a number of industrial applications for estimating VCV and for determining the timing of feeding and temperature shifts in bioreactors. Despite these successes, the full value of dielectric spectroscopy has not yet been realized for use in applications such as continuous feed control.16 One reason may be the large errors that have been observed for some cell lines when trying to predict VCV with this method.23,35,36
Specifically, for some mammalian cell cultures, the single-frequency permittivity correlates linearly during the growth phase with the results of offline viable cell-counting methods based on trypan blue dye exclusion. As the viability of the culture declines, however, the linear correlation (Eq. 3) becomes progressively worse at accurately predicting the actual VCV. This phenomenon has been observed previously with dielectric probes monitoring Chinese hamster ovary (CHO) cells.23,35,36 In most published cases, the measured permittivity overpredicts the actual VCV in the death phase of the culture. In at least one case, however, only negligible amounts of divergence were observed in the death phase.37
By linearly correlating the dielectric increment to VCV, the dielectric properties of each cell is assumed to be constant over time. In cell-culture processes, particularly in fed-batch mode, cell properties are known to change, sometimes drastically, over the course of the culture as nutrients are depleted, metabolic by-products accumulate, and cell aging occurs. Changes in cell size,38 metabolic state,39 viability, and growth rate, among other cell properties, have all been observed to change over the course of fed-batch cell culture. Some of these cell-property changes—particularly cell size,35,40 metabolic state,27 and degree of apoptosis28,29—have been linked to shifts in the dielectric properties of the cell population. If the dielectric properties of the cells change significantly over time or if nonviable cells produce a dielectric signal, then a divergence would be expected as the cells enter the death phase of the culture, due to the changing dielectric properties of the cells. The divergence phenomenon may be caused by nonviable cells contributing additional permittivity signal to the measured dielectric increment (i.e., cells that are counted as nonviable by trypan blue dye exclusion are still participating in Maxwell–Wagner polarization).
In the current work, it is hypothesized that nonviable cells do produce a permittivity signal. It is also hypothesized that the permittivity signal produced by nonviable cells is distinguishable from the signal produced by viable cells in terms of the frequency dependence of the signal (i.e., the shape of dielectric spectrum). If this is true, a correction is required to compensate for this additional permittivity signal to obtain a permittivity measurement that accurately predicts VCV and matches the results of the offline method. This article describes a novel method that accomplishes this.
Materials and Methods
Cell culture
A GS −/− NS/0 cell line expressing a recombinant protein was grown in a fed-batch culture in 2-L glass, autoclavable bioreactors (Broadley-James Inc., Irvine, CA). The cultivation was inoculated at 2.5 × 10⁵ cells/mL. Operating conditions were as follows: temperature 36.5°C ± 0.1°C, pH 7.2 ± 0.1, dissolved oxygen 30% ± 5% air saturation, and agitation 170 ± 5 rpm. A one-pitched blade impeller with three 45° blades was used (Metrohm Applikon BV, Schiedam, The Netherlands). The culture was fed with a chemically defined nutrient feed at a continuous flow rate after Day 3. Glucose was continuously controlled separately at 1 ± 0.5 g/L.
Offline cell viability and VCV measurements
Sampling was performed at least once daily. Samples were analyzed on a Nova Bioprofile 400 (Nova Biomedical, Waltham, MA; data not shown) and a Cedex automated cell counter (Roche Diagnostics Co., Indianapolis, IN). Samples were retained for additional analysis of metabolite concentrations and product titer (data not shown). Cell viability was determined with the Cedex instrument by trypan blue dye exclusion. Cedex images were visually spot-checked for counting and edge-finding accuracy, and determined to be sufficiently accurate. The VCV was determined from the Cedex viable cell density (VCD) and average viable cell diameter (D) data approximated as spheres using
| (4) |
where π is the numerical constant. Calculating VCV using visual cell-counting methods inherently assumes a spherical cell morphology, which is not necessarily a valid assumption for mammalian cells at low viabilities. This method for determining VCV is based on using an average viable cell diameter calculated from a complex distribution of measured cell diameters. It is known that cell size distributions change dynamically over the course of a cell culture process38 and changes in cell size distribution can be observed in the data collected here as well. In general, the size distribution appears to deviate significantly from a normal distribution at all points during the culture, with the deviation becoming even more pronounced during the death phase. Although using the mean of a complex distribution of cell sizes to calculate VCV is not ideal, gross changes in the average size distribution are still captured using this method, allowing demonstration of this proof of concept of the relationship between VCV and dielectric property measurements.
Other methods may yield more-accurate measurements of VCV. An example of another useful offline measure that is indicative of VCV is viable packed-cell volume (vPCV).35 vPCV does not require image analysis to explicitly quantify the cell morphology for determination of cell volumes, so it does not require cell morphology or a distribution of diameters to be assumed. However, it is affected by the dynamics of cell packing as well as the biovolume.
Collection of flow cytometry data
Flow cytometry data were collected on a fluorescence-activated cell sorter (FACS)-Aria instrument (BD Biosciences, San Jose, CA). Forward-scatter and side-scatter data were collected and used to gate cells into populations of “healthy” and “unhealthy” cells. The gated subpopulations had distinct side-scatter properties when gated according to the method described by Geerts et al.41 As previously observed,41 the “healthy” population linearly correlated to viable, nonstaining cells observed with trypan blue dye exclusion (R2 = 0.95). The “unhealthy” population correlated to cells that stain positive (i.e., nonviable) in trypan blue dye exclusion (R2 = 0.95). The relative amounts and scattering characteristics of each population were characterized to quantify cell morphology.
Collection of dielectric spectroscopy data
The culture was monitored by a frequency-scanning permittivity probe (iBiomass 465 monitor, Fogale Nanotech, Nimes, France). The probe was equilibrated in medium under relevant culture conditions overnight to ensure no probe drift was occurring. A blank medium scan was collected before inoculation and subtracted from subsequent scans, which were collected every 30 s. Subsequent data processing was performed in MATLAB (2010a, The MathWorks, Natick, MA). Raw scans were filtered for noise using a moving average (n = 15 samples). Electrode polarization was corrected using the method supplied in the iBiomass software. A single-relaxation Cole–Cole model (described in the Background section) was fit to the data, which was filtered and corrected for electrode polarization using the iBiomass software. The dielectric values used for the analysis described here are therefore single-term Cole–Cole model values supplied by the instrument.
Prediction of VCV from dielectric increment
A linear correlation was generated between VCV and permittivity measured at 1000 kHz. To reduce bias due to shifting cell states, only samples with viabilities above 95%, as measured by trypan blue dye exclusion, were used to build the linear correlation. The linear correlation takes the form of Eq. 3, where A and k1 are determined as the respective slope and intercept of the linear correlation.
Visualization of multifrequency permittivity spectra
The dielectric spectra (frequency scans) were analyzed in Microsoft Excel 2010 (Microsoft Corp., Redmond, WA) to visualize the shape of each frequency scan over time. To better visualize the shape of each scan relative to other scans, each frequency scan was normalized from 1 to 0, using
| (5) |
where εN(f) is the normalized permittivity as a function of frequency and εL is the lowest frequency permittivity measurement in the scan.
This method normalizes the dielectric increment, or magnitude, of each scan, enabling direct comparison of curve shapes without the dielectric increment changing due to changes in VCV.
Results and Discussion
Single-frequency permittivity results
Single-frequency permittivity values were measured using dielectric probes through all phases of a cell culture using the GS −/− NS/0 cell line, as described in Materials and Methods section. As expected, the permittivity values diverged from a linear correlation when plotted against VCV during the death phase of the culture as viability declined (Figure 2).
Figure 2.
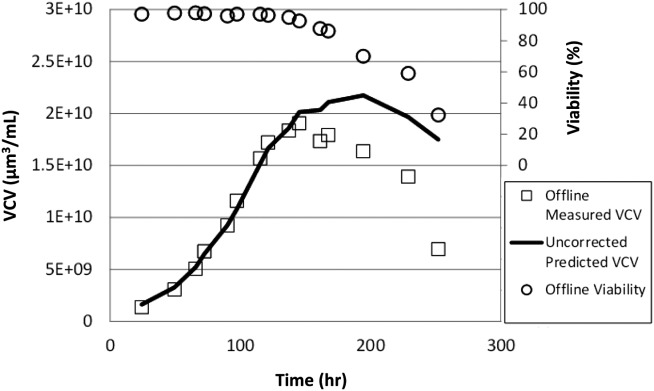
Actual VCV, viability, and predicted VCV values using uncorrected permittivities.
For the growth phase (points above 95% viability), permittivity measurements exhibited a strong linear correlation (R2 = 0.99) with the measured offline biovolume measurements, whereas for the death phase (points below 95% viability) measurements diverged progressively from the linear correlation. The divergence manifested as a higher-than-expected permittivity value for a given offline VCV measurement when compared to the growth-phase points. This fact supports the initial hypothesis that additional permittivity is being measured from a cell population that is excluded from the offline viability measurements when viabilities are low. An additional published study reports this trend for a different cell line (CHO) in a different process from the one presented here.35
The constants A and k1 in Eq. 3 were determined from the linear growth-phase correlation between permittivity and VCV for viabilities above 95% to obtain
| (6) |
when this equation was used to predict the VCV over the course of the entire culture, the death-phase divergence was clearly demonstrated, as shown in Figure 2. Any feed-control strategy attempting to tailor the feed rate to the amount of cell mass present in the reactor would have drastically overfed the culture beginning at about 150 h, when the death-phase divergence begins to manifest in the permittivity signal. At this point in the culture, the product concentration has reached only about 60% of the total achieved at the end of the culture (data not shown). Any deleterious effects caused by overfeeding would, therefore, significantly affect the ending titer and, possibly, product quality if not corrected.
Multifrequency permittivity results
Multifrequency permittivity values were also measured during the cell culture run using dielectric probes. To better visualize the changing shape of the beta dispersion over the course of the culture, frequency scans were normalized from 1 to 0, as described in the Methods. A sampling of four normalized frequency scans taken at representative time points in the culture highlights the shape change in the scans that occurs over the course of the culture (Figure 3). The scans collected at Days 3 and 6 correspond to the growth phase of the culture, when the single-frequency permittivity signal correlates linearly with VCV. These scans are so similar in shape that they overlap. The scans collected at Days 8 and 11 correspond to the death phase of the culture, when the single-frequency permittivity signal versus VCV diverges from the original linear correlation. These scans move progressively toward the higher-frequency end of the spectrum as the viability of the culture declines.
Figure 3.
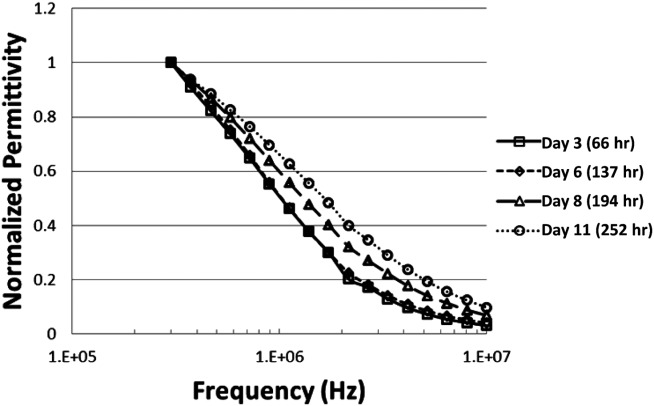
Normalized frequency scans at representative time points during the culture: Day 3 (□) and Day 6 (⋄) correspond to offline viabilities of >95% (i.e., the growth phase). Day 8 (Δ) and Day 11 (○) represent offline viabilities of <95% (i.e., the death phase).
The scans collected on Days 3 and 6 correspond to offline trypan blue viability measurements of 98% and 95%, respectively. Scans collected on Days 8 and 11 correspond to offline viability measurements of 70% and 32%, respectively.
The relative shape of each scan was quantified using a novel area ratio (AR) metric from each frequency scan. The ratio of area under the portion of each scan above a semiarbitrary frequency, fQ, over the area under the entirety of each scan is calculated as shown in Eq. 7:
 |
(7) |
where AR is the area ratio for the given scan, fH is the highest frequency of the scan, fL is the lowest frequency of the scan, and fQ is a semiarbitrary frequency chosen between fH and fL.
The AR metric was chosen to normalize VCV effects, which manifest as a changing dielectric increment, yielding equally weighted relative shape information for each scan. The AR metric also allows quantification of the relative shape of the dielectric spectrum without requiring knowledge of the nature of the curve shape a priori. Integrals were chosen as calculated quantities to decrease the noise associated with the method.
For this work, we chose 808.5 kHz as the fQ frequency. This was determined to be a good value based on a rough sensitivity analysis. Most other chosen frequencies in the middle of the scan yielded similar results. The integrals were calculated by trapezoidal rule.
For each offline VCV measurement and corresponding single-frequency permittivity measurement, a “required correction,” or distance from the linear growth-phase model defined in Eq. 6, was calculated to determine the amount that must be subtracted from each permittivity measurement to force all measurements to fall on the linear growth-phase line for VCV versus permittivity (Eq. 8):
| (8) |
where δmod is the divergence between the linear model defined in Eq. 3 and the measured permittivity and εpred is the model-predicted permittivity from Eq. 3. This calculation requires knowing the offline VCV and using it to build an initial calibration.
Next, δmod was predicted based on the AR of each corresponding frequency scan. The AR from each frequency scan (Eq. 7) was linearly correlated to the required signal correction (δmod, from Eq. 8) to yield
| (9) |
where B and k2 are the respective slope and intercept constants generated from the correlation of AR versus δmod.
Eq. 9 was then fitted to the current data set. The result was a linear correlation (R2 = 0.93), as shown in Figure 4. The constants B and k2 from Eq. 9 were determined from the respective slope and intercept of the linear correlation between δmod and AR (Figure 4) to obtain an expression for determining the correction factor from the AR measurement:
Figure 4.
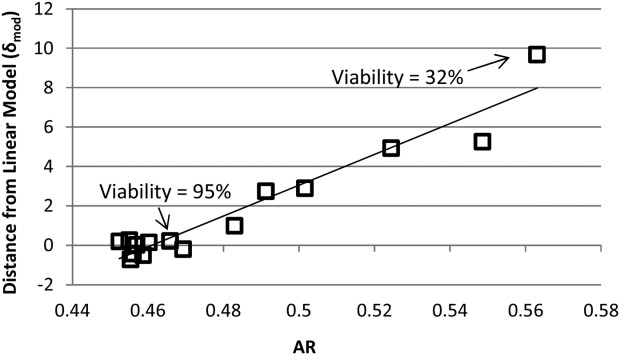
AR versus divergence from model for permittivity of linear growth phase versus VCV.
| (10) |
The fact that δmod, which quantifies the amount of divergence observed during the entire culture between the linear growth-phase model and the actual measurements, is shown to be linearly correlated with the AR metric—a measure of the shape of the dielectric spectrum and a direct consequence of the dielectric properties of the cell population—supports the hypothesis that the divergence during the death phase is related to dielectric changes in the cell population.
An expression for modifying the permittivity (i.e., applying the correction factor) for subsequent measurements based on the AR was obtained by rearranging Eq. 5 and substituting Eq. 9 for δmod to yield Eq. 11:
| (11) |
where εc is the AR-modified permittivity. When the AR-modified permittivity is plotted against the offline VCV for the current data set (Figure 5a), the prediction of all VCV measurements, regardless of culture phase, is better explained than when using the uncorrected permittivity measurements alone (Figure 5b).
Figure 5.
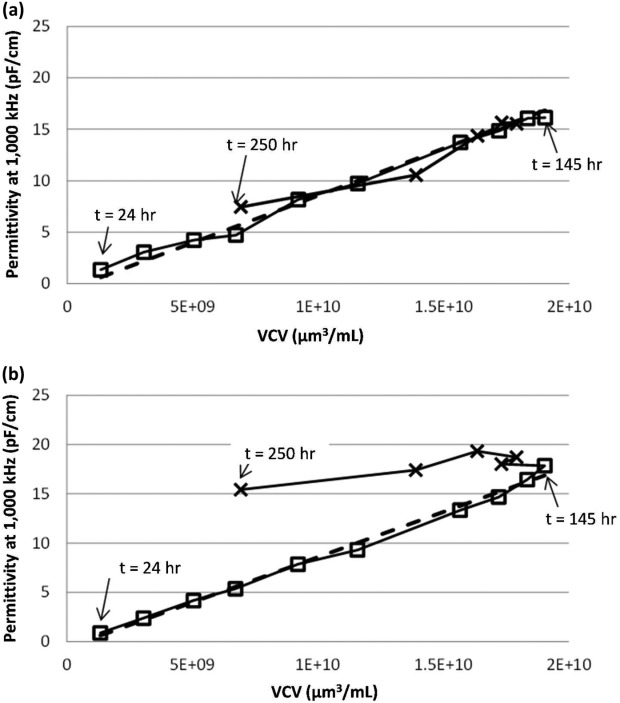
AR-modified (a) and unmodified (b) permittivity versus VCV, showing points above (□) and below (x) 95% viability by offline trypan blue dye exclusion.
In the analysis presented here, all permittivity measurements, regardless of culture viability, are corrected using the method. Since the AR values of the frequency scans collected during the high-viability growth phase correspond to a very small δmod value, very little adjustment is applied. The quality of the growth-phase prediction for biovolume for points above 95% viability (which require no correction), is not significantly impacted before (R2 = 1.00) and after (R2 = 0.99) analysis.
To obtain a new expression for prediction of VCV from the AR-modified permittivity measurements alone, Eq. 11 is substituted for ε(t) in Eq. 3 to produce the following final expression
| (12) |
where VCV(t) is the predicted VCV at time t, ε(t) is the measured permittivity at a single frequency at time t, and AR(t) is the measured AR at time t.
The measured single-frequency capacitance and AR values were then used to produce a corrected VCV using Eq. 12. The resulting prediction of VCV vs. time is greatly improved, as shown in Figure 6.
Figure 6.
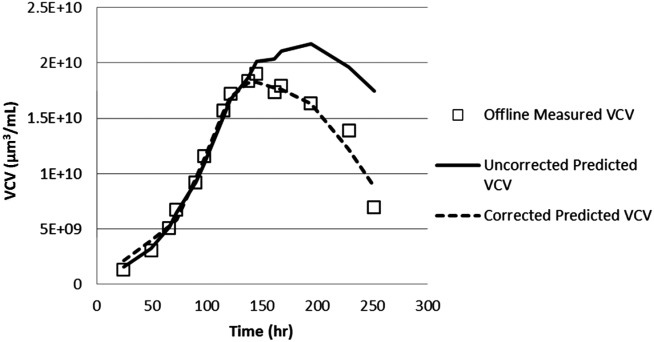
Predicted and actual VCV values using uncorrected and corrected permittivities.
Using the novel methods presented here, VCV can be accurately predicted during all phases of the culture, regardless of changing cell health. In addition, this prediction can be generated using only data collected from a frequency-scanning dielectric probe and an initial calibration curve relating A, B, k1, and k2 to VCV measurements.
To directly relate changes in the dielectric properties of a cell population to the observed changes in the single-frequency permittivity measurement of the cell population, a single cell-culture data set was used to generate a linear model relating the shape of the beta dispersion to the divergence between actual and predicted VCV measurements. This linear model was then applied to the same data set to show that a model of this type could account for the divergence between measured and predicted VCV in the data set. Importantly, the application of this method for correcting VCV in a bioreactor setting, where prediction of VCV from permittivity data is desired based on a previously generated calibration, requires that the model constants A, B, k1, and k2, are constant between runs. Since these constants correlate changes in the dielectric properties of the cell population to trypan blue dye exclusion, a fundamentally different method of determining VCV than dielectric measurements, changes in the dielectric properties associated with cell death may be expected to change the constants. Therefore, more work remains to determine the sensitivity of these constants to different culture conditions and cell lines.
Comparison of AR method to other correction methods
The analysis presented here depicts one possible method for using data obtained from frequency scanning to obtain a corrected VCV prediction. Other methods based on multivariate partial least squares (PLS) modeling have been reported by several authors.23,35,42 Additionally, other methods for quantifying the shape of the beta dispersion, such as fitting a Cole–Cole model,16–18 are well established.
Multivariate PLS methods have the advantage of using the latent structure of the data itself to determine the relative contributions of input variables (loadings) toward predicting the output, rather than defining important variables a priori. Because the loadings for multivariate models are determined by the latent structure of the data used to build the model, the addition of additional datasets typically improves the prediction of the model.43,44 This type of approach likely will result in more-accurate predications over other methods (e.g., the AR method or Cole–Cole modeling approach) when large volumes of data are available, such as late-stage process development or manufacturing.
The AR method is therefore more suitable for use in situations where a large calibration data set is unavailable, such as in early process development for a cell-culture process. In early process development, real-time prediction of VCV is often desired for process monitoring and control.16
Other techniques for quantifying the shape of the beta dispersion based on fitting Cole–Cole models to dielectric spectra have been established. To determine whether a similar correction using a Cole–Cole model to quantify the shape of the beta dispersion could be applied with similar prediction capability, the spectra from the current data set were fit to a single-term Cole–Cole model. The critical frequency (fc) term of the resulting fit model was used as a surrogate to the AR, using the same methods described in the previous section. The results are shown in Figure 7.
Figure 7.
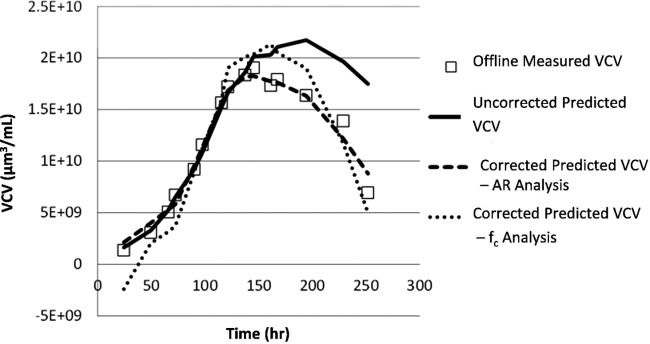
Actual and predicted VCV values using no correction, AR correction, and fc correction methods.
The results of the analysis using fc as the quantifier of beta-dispersion shape show that a correction is achieved in the advanced death phase. The correction achieved at near-peak VCV, as well as in the early growth phase, is considerably worse than the AR method, however.
The considerable bias in the early growth phase is likely due to poor fitting of the model to the beta dispersion due to the low signal obtained from low VCV. This may be improved with better model fitting or data-filtering techniques.
The prediction bias that occurs near the peak VCV is likely not attributable to model fitting, because the best signal-to-noise ratio occurs at high VCV. The existence of this bias suggests that changes in the shape of the beta dispersion, that occur in the early death phase and that are quantified by the AR, are not quantified by changes in fc. Eventually, at very low viabilities, the fc method does quantify shape changes, resulting in a similar correction at these points to the AR method. This fact may be related to modeling a system that may consist of two discrete relaxations as a single relaxation. The prediction may also be confounded by the fact that the α term, which also affects the shape of the beta dispersion, is also changing (data not shown).
Investigation of cell morphology by flow cytometry
In addition to implementing the AR method to correct for the death-phase divergence, cell samples at different points throughout the culture were analyzed via light scattering on a flow cytometer to investigate the biological/physiological nature of the link between cell health and the shape of the dielectric spectrum.
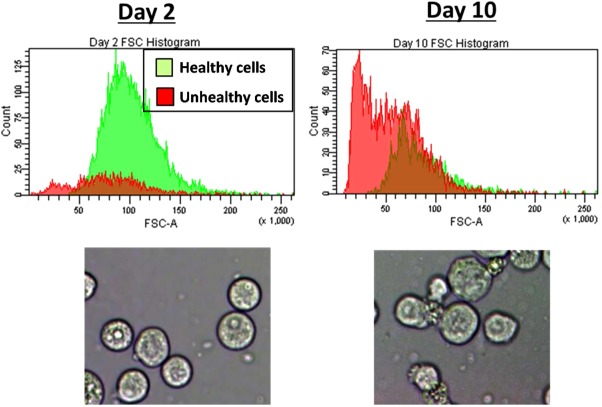
Cells were gated into “healthy” and “unhealthy” populations according to forward- and side-scattering intensities, as described in the Methods section. Histograms of forward-scattering intensity and representative visual microscope images of cell samples from Day 2 (viability = 97.5%) and Day 10 (viability = 32.3%) are shown in Figure 8. Both methods show a change in the ratio of healthy to unhealthy cells and a distinctly different morphology associated with the unhealthy population. This difference in morphology between the populations manifests in the roughly Gaussian distribution of forward-scattering intensities in the healthy population and the clearly bimodal distribution of forward-scattering intensities in the unhealthy population.
Figure 8.
Forward-scatter intensity histograms gated for healthy (red) and unhealthy (green) cell populations sampled from early in the growth phase at Day 2 and late in the death phase at Day 10.Representative light microscope images from Days 2 and 10 show distinct morphology changes between the Day 2 (high viability) and Day 10 (low viability) samples.
Correspondingly, the healthy cells show a roughly uniform and circular cell morphology, whereas the size and shape of the unhealthy cells is less uniform. The unhealthy cells are largely nonspherical and increased cell “granularity” is seen. These observations are well-known to be associated with viability changes in mammalian cells.41
Cell morphology changes of this type have previously been observed to contribute to shifts in dielectric spectra. It has been previously reported14,45 that cell size has a significant effect on the dielectric increment and the critical frequency. The observed decrease in cell size would support the observed shift of the dielectric spectrum to higher frequencies. Additionally, the bimodal nature of the forward-scattering intensity of the unhealthy cell population suggests that the observed shifts in the dielectric spectra may actually be a sum of two relatively discrete cell populations. A possibly fruitful next step could be to explicitly relate the amount of healthy and unhealthy cells measured by an offline method (such as light scattering) to the dielectric spectrum, by splitting the spectrum into two distinct relaxations—one relaxation contributed by healthy cells and the other by unhealthy cells. This type of analysis could be used to further support the hypothesis that changes in the shape of the beta dispersion are caused by permittivity of nonviable cells.
Changes to overall cell shape that do not involve changes in size have also been observed to affect the shape of the dielectric spectrum.46 Elongated, nonspherical cells may also explain the observed behavior of the dielectric spectrum.
In addition to changes in cellular morphology, the link between viability and shape of the dielectric spectrum may also be explained by intracellular effects. Significant changes in the beta dispersion associated with intracellular conductivity and membrane capacitance have been observed.25 A shift in the dielectric spectrum associated with cell size, lactate consumption, and cell viability has also been reported.14
The dominant mode of cell death in fed-batch mammalian cell cultures is apoptosis.47 Several investigators have observed differences in apoptotic and nonapoptotic populations by dielectrophoresis, a technique for measuring the frequency-dependent dielectric behavior of single cells.28,29 In each study, a marked increase in intracellular conductivity accompanied by a decrease in cell size was observed between the two populations early in apoptosis. Our group has investigated the observability of apoptosis by dielectric spectroscopy, which will be published in a separate paper.
Conclusions
This work demonstrates the relationship between changing dielectric properties of a cell population, as quantified by the shape of frequency scans, to observed divergences in predicted versus actual VCV. A novel AR method for quantifying the shape of the frequency scans allowed a linear relationship to be established between the observed divergence between predicted and actual VCV and the shape of the frequency scans. The work presented here was performed on a single data set to demonstrate the relationship.
The methods presented here may allow use of the full dielectric spectrum to predict VCV in bioreactors more accurately than with single-frequency permittivity methods by accounting for changes in cell physiological state that occur in the death phase. The ability to measure VCV accurately online in bioreactors would enable the implementation of process-control schemes (e.g., specific cell-rate feeding) that would be more difficult or impossible using other technologies. More datasets would be needed, however, to determine the robustness of such a method. The relationship between changing cell state and measured single-frequency permittivity is complex and likely depends on the nature of the cell state measured. A comprehensive study across multiple cell lines, process conditions, and cell death modes would improve understanding of this relationship and the applicability of the method to an online VCV monitoring application.
Additional work also remains to investigate the specific physiological changes that are detected by dielectric spectroscopy in the death phase. Such fundamental understanding will likely promote understanding of other important cellular processes that are of interest to the biopharmaceutical industry.
This initial work also demonstrates the possible utility of using commercial frequency-scanning probes for a use beyond measuring VCV: the online monitoring of cell state in the bioreactor. Where cell physiology is difficult to observe—during process-development experiments (e.g., during media and feed development) or in situ in a commercial process—dielectric spectroscopy may provide valuable information about cell state (particularly information about cell health) that cannot be obtained in near real time. Because of the frequency with which the dielectric data may be collected, this near-real-time feedback of cell-level data also may be especially useful for process control.
Acknowledgments
We gratefully acknowledge the contributions of our fellow Bend Research staff members.
We also wish to acknowledge Dr. Seongkyu Yoon and Dr. Haewoo Lee for valuable input when reviewing the manuscript.
We also wish to acknowledge the support of Pfizer during this work.
Literature Cited
- 1.Aehle M, Kuprijanov A, Schaepe S, Simutis R, Lübbert A. Increasing batch-to-batch reproducibility of CHO cultures by robust open-loop control. Cytotechnology. 2011;63:41–47. doi: 10.1007/s10616-010-9320-y. [DOI] [PMC free article] [PubMed] [Google Scholar]
- 2.Junker BH, Wang HY. Bioprocess monitoring and computer control: key roots of the current PAT initiative. Biotechnol Bioeng. 2006;95:226–261. doi: 10.1002/bit.21087. [DOI] [PubMed] [Google Scholar]
- 3.Read EK, Park JT, Shah RB, Riley BS, Brorson KA, Rathore AS. Process analytical technology (PAT) for biopharmaceutical products: part I. Concepts and applications. Biotechnol Bioeng. 2010;105:276–284. doi: 10.1002/bit.22528. [DOI] [PubMed] [Google Scholar]
- 4.Read EK, Shah RB, Riley BS, Park JT, Brorson KA, Rathore AS. Process analytical technology (PAT) for biopharmaceutical products: part II. Concepts and applications. Biotechnol Bioeng. 2010;105:285–295. doi: 10.1002/bit.22529. [DOI] [PubMed] [Google Scholar]
- 5.O'Callaghan PM, James DC. Systems biotechnology of mammalian cell factories. Brief Funct Genomic Proteomic. 2008;7:95–110. doi: 10.1093/bfgp/eln012. [DOI] [PubMed] [Google Scholar]
- 6.Mulukutla BC, Gramer M, Hu W-S. On metabolic shift to lactate consumption in fed-batch culture of mammalian cells. Metab Eng. 2012;14:138–149. doi: 10.1016/j.ymben.2011.12.006. [DOI] [PubMed] [Google Scholar]
- 7.Goudar C, Biener R, Boisart C, Heidemann R, Piret J, de Graaf A, Konstantinov K. Metabolic flux analysis of CHO cells in perfusion culture by metabolite balancing and 2D [13C, 1H] COSY NMR spectroscopy. Metab Eng. 2010;12:138–149. doi: 10.1016/j.ymben.2009.10.007. [DOI] [PubMed] [Google Scholar]
- 8.Follstad BD, Balcarcel RR, Stephanopoulos G, Wang DI. Metabolic flux analysis of hybridoma continuous culture steady state multiplicity. Biotechnol Bioeng. 1999;63:675–683. doi: 10.1002/(sici)1097-0290(19990620)63:6<675::aid-bit5>3.0.co;2-r. [DOI] [PubMed] [Google Scholar]
- 9.Henry O, Kamen A, Perrier M. Monitoring the physiological state of mammalian cell perfusion processes by on-line estimation of intracellular fluxes. J Process Control. 2007;17:241–251. [Google Scholar]
- 10.Ruffieux PA, von Stockar U, Marison IW. Measurement of volumetric (OUR) and determination of specific (qO2) oxygen uptake rates in animal cell cultures. J Biotechnol. 1998;63:85–95. doi: 10.1016/s0168-1656(98)00046-7. [DOI] [PubMed] [Google Scholar]
- 11.Konstantinov KB, Pambayun R, Matanguihan R, Yoshida T, Perusicn CM, Hu WS. On-line monitoring of hybridoma cell growth using a laser turbidity sensor. Biotechnol Bioeng. 1992;40:1337–1342. doi: 10.1002/bit.260401107. [DOI] [PubMed] [Google Scholar]
- 12.Carvell JP, Dowd JE. On-line measurements and control of viable cell density in cell culture manufacturing processes using radio-frequency impedance. Cytotechnology. 2006;50:35–48. doi: 10.1007/s10616-005-3974-x. [DOI] [PMC free article] [PubMed] [Google Scholar]
- 13.Ansorge S, Esteban G, Schmid G. On-line monitoring of infected Sf-9 insect cell cultures by scanning permittivity measurements and comparison with off-line biovolume measurements. Cytotechnology. 2007;55:115–124. doi: 10.1007/s10616-007-9093-0. [DOI] [PMC free article] [PubMed] [Google Scholar]
- 14.Cannizzaro C, Gügerli R, Marison I, von Stockar U. On-line biomass monitoring of CHO perfusion culture with scanning dielectric spectroscopy. Biotechnol Bioeng. 2003;84:597–610. doi: 10.1002/bit.10809. [DOI] [PubMed] [Google Scholar]
- 15.Altman SA, Randers L, Rao G. Comparison of trypan blue dye exclusion and fluorometric assays for mammalian cell viability determinations. Biotechnol Prog. 1999;9:671–674. doi: 10.1021/bp00024a017. [DOI] [PubMed] [Google Scholar]
- 16.Justice C, Brix A, Freimark D, Kraume M, Pfromm P, Eichenmueller B, Czermak P. Process control in cell culture technology using dielectric spectroscopy. Biotechnol Adv. 2011;29:391–401. doi: 10.1016/j.biotechadv.2011.03.002. [DOI] [PubMed] [Google Scholar]
- 17.Schwan H. Electrical properties of tissue and cell suspensions. Adv Biol Med Phys. 1957;5:147–208. doi: 10.1016/b978-1-4832-3111-2.50008-0. [DOI] [PubMed] [Google Scholar]
- 18.Asami K. Characterization of heterogeneous systems by dielectric spectroscopy. Prog Polym Sci. 2002;27:1617–1659. [Google Scholar]
- 19.Morgan H, Sun T, Holmes D, Gawad S, Green NG. Single cell dielectric spectroscopy. J Phys D Appl Phys. 2007;40:61–70. [Google Scholar]
- 20.Sun T, Morgan H. Single-cell microfluidic impedance cytometry: a review. Microfluid Nanofluidics. 2010;8:423–443. [Google Scholar]
- 21.Hanai T, Koizumi N, Irimajiri A. A method for determining the dielectric constant and the conductivity of membrane-bounded particles of biological relevance. Biophys Struct Mech. 1975;1:285–294. doi: 10.1007/BF00537642. [DOI] [PubMed] [Google Scholar]
- 22.Cole KS, Cole RH. Dispersion and absorption in dielectrics I. Alternating current characteristics. J Chem Phys. 1941;9:341. [Google Scholar]
- 23.Cannizzaro C, Gügerli R, Marison I, von Stockar U. On-line biomass monitoring of CHO perfusion culture with scanning dielectric spectroscopy. Biotechnol Bioeng. 2003;84:597–610. doi: 10.1002/bit.10809. [DOI] [PubMed] [Google Scholar]
- 24.Asami K, Yamaguchi T. Dielectric spectroscopy of plant protoplasts. Biophys J. 1992;63:1493–4199. doi: 10.1016/S0006-3495(92)81734-4. [DOI] [PMC free article] [PubMed] [Google Scholar]
- 25.Ron A, Singh RR, Fishelson N, Shur I, Socher R, Benayahu D, Shacham-Diamand Y. Cell-based screening for membranal and cytoplasmatic markers using dielectric spectroscopy. Biophys Chem. 2008;135:59–68. doi: 10.1016/j.bpc.2008.03.003. [DOI] [PubMed] [Google Scholar]
- 26.Zimmermann D, Zhou A, Kiesel M, Feldbauer K, Terpitz U, Haase W, Schneider-Hohendorf T, Bamberg E, Sukhorukov VL. Effects on capacitance by overexpression of membrane proteins. Biochem Biophys Res Commun. 2008;369:1022–1026. doi: 10.1016/j.bbrc.2008.02.153. [DOI] [PubMed] [Google Scholar]
- 27.Ansorge S, Esteban G, Schmid G. Multifrequency permittivity measurements enable on-line monitoring of changes in intracellular conductivity due to nutrient limitations during batch cultivations of CHO cells. Biotechnol Prog. 2010;26:272–283. doi: 10.1002/btpr.347. [DOI] [PubMed] [Google Scholar]
- 28.Chin S, Hughes MP, Coley HM, Labeed FH. Rapid assessment of early biophysical changes in K562 cells during apoptosis determined using dielectrophoresis. Int J Nanomedicine. 2006;1:333–337. [PMC free article] [PubMed] [Google Scholar]
- 29.Labeed FH, Coley HM, Hughes MP. Differences in the biophysical properties of membrane and cytoplasm of apoptotic cells revealed using dielectrophoresis. Biochim Biophys Acta. 2006;1760:922–929. doi: 10.1016/j.bbagen.2006.01.018. [DOI] [PubMed] [Google Scholar]
- 30.Lee RM, Choi H, Shin J-S, Kim K, Yoo K-H. Distinguishing between apoptosis and necrosis using a capacitance sensor. Biosens Bioelectron. 2009;24:2586–2591. doi: 10.1016/j.bios.2009.01.028. [DOI] [PubMed] [Google Scholar]
- 31.Patel P, Markx G. Dielectric measurement of cell death. Enzyme Microb Technol. 2008;43:463–470. [Google Scholar]
- 32.Wang X, Becker FF, Gascoyne PRC. Membrane dielectric changes indicate induced apoptosis in HL-60 cells more sensitively than surface phosphatidylserine expression or DNA fragmentation. Biochim Biophys Acta (BBA)-Biomembranes. 2002;1564:412–420. doi: 10.1016/s0005-2736(02)00495-9. [DOI] [PMC free article] [PubMed] [Google Scholar]
- 33.Ansorge S, Esteban G, Schmid G. On-line monitoring of responses to nutrient feed additions by multi-frequency permittivity measurements in fed-batch cultivations of CHO cells. Cytotechnology. 2010;62:121–132. doi: 10.1007/s10616-010-9267-z. [DOI] [PMC free article] [PubMed] [Google Scholar]
- 34.Harris CM, Todd RW, Bungard SJ, Lovitt RW, Morris G, Keli DB. Dielectric permittivity of microbial suspensions at radio frequencies: a novel method for the real-time estimation of microbial biomass. Enzyme Microb Technol. 1986;9:181–186. [Google Scholar]
- 35.Opel CF, Li J, Amanullah A. Quantitative modeling of viable cell density, cell size, intracellular conductivity, and membrane capacitance in batch and fed-batch CHO processes using dielectric spectroscopy. Biotechnol Prog. 2010;26:1187–1199. doi: 10.1002/btpr.425. [DOI] [PubMed] [Google Scholar]
- 36.Schmid G, Ansorge S, Zacher D. On-line measurement of viable cell density in animal cell culture processes. Poster Present Cell Cult Eng IX, Cancun, Mex. 2004;I:4070. [Google Scholar]
- 37.Carvell J, Williams J, Lee M, Logan D, Park S, Sy UK. On-line monitoring of the live cell concentration in disposable bioreactors. 2009. pp. 3–5. Proc 21st Annu Meet Eur Soc Anim Cell Technol. Dublin, IR.
- 38.Seewöster T, Lehmann J. Cell size distribution as a parameter for the predetermination of exponential growth during repeated batch cultivation of CHO cells. Biotechnol Bioeng. 1997;55:793–797. doi: 10.1002/(SICI)1097-0290(19970905)55:5<793::AID-BIT9>3.0.CO;2-6. [DOI] [PubMed] [Google Scholar]
- 39.Templeton N, Dean J, Reddy P, Young JD. Peak antibody production is associated with increased oxidative metabolism in an industrially relevant fed-batch CHO cell culture. Biotechnol Bioeng. 2013;110:2013–2024. doi: 10.1002/bit.24858. [DOI] [PubMed] [Google Scholar]
- 40.Gheorghiu E. Monitoring cell cycle by impedance spectroscopy: experimental and theoretical aspects. Bioelectrochem Bioenerg. 1998;45:139–143. [Google Scholar]
- 41.Geerts A, Niki T, Hellemans K, De Craemer D, Van Den Berg K, Lazou JM, Stange G, Van De Winkel M, De Bleser P. Purification of rat hepatic stellate cells by side scatter-activated cell sorting. Hepatology. 1998;27:590–598. doi: 10.1002/hep.510270238. [DOI] [PubMed] [Google Scholar]
- 42.Dabros M, Dennewald D, Currie DJ, Lee MH, Todd RW, Marison IW, von Stockar U. Cole–Cole, linear and multivariate modeling of capacitance data for on-line monitoring of biomass. Bioprocess Biosyst Eng. 2009;32:161–173. doi: 10.1007/s00449-008-0234-4. [DOI] [PubMed] [Google Scholar]
- 43.Wold S, Sjöström M, Eriksson L. PLS-regression: a basic tool of chemometrics. Chemom Intell Lab. 2001;58:109–130. [Google Scholar]
- 44.Mehmood T, Liland KH, Snipen L, Sæbø S. A review of variable selection methods in partial least squares regression. Chemom Intell Lab Syst. 2012;118:62–69. [Google Scholar]
- 45.Yardley JE, Kell DB, Barrett J, Davey CL. On-line, real-time measurements of cellular biomass using dielectric spectroscopy. Biotechnol Genet Eng Rev. 2000;17:3–35. doi: 10.1080/02648725.2000.10647986. [DOI] [PubMed] [Google Scholar]
- 46.Di Biasio A, Cametti C. Effect of shape on the dielectric properties of biological cell suspensions. Bioelectrochemistry. 2007;71:149–156. doi: 10.1016/j.bioelechem.2007.03.002. [DOI] [PubMed] [Google Scholar]
- 47.Arden N, Betenbaugh MJ. Life and death in mammalian cell culture: strategies for apoptosis inhibition. Trends Biotechnol. 2004;22:174–180. doi: 10.1016/j.tibtech.2004.02.004. [DOI] [PubMed] [Google Scholar]


